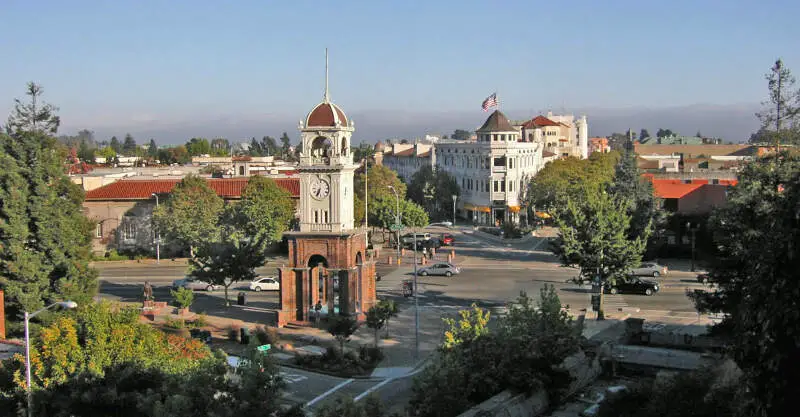

Life in Santa Cruz County research summary. HomeSnacks has been researching the quality of life in Santa Cruz County over the past eight years using Census data, FBI crime data, cost of living data, and other primary sources. Based on the most recently available data, we found the following about life in Santa Cruz County:
The population in Santa Cruz County is 268,571.
The median home value in Santa Cruz County is $1,147,849.
The median income in Santa Cruz County is $104,409.
The median rent in Santa Cruz County is $2,094.
The unemployment rate in Santa Cruz County is 5.9%.
The poverty rate in Santa Cruz County is 11.4%.
The average high in Santa Cruz County is 61.4° and there are 62.1 inches of rainfall annually.
The average high in Santa Cruz County is 61.4°.
There are 99.83 nice days each year.
Expect an average of 62.1 inches of rain each year with 0.0 inches of snow.
There is an average of 7:23 hours of sun each day in Santa Cruz County.
| Stat | Santa Cruz County |
|---|---|
| Mean High | 61.4 |
| Nice Days | 99.83 |
| Rainfall | 62.1 |
| Snowfall | 0.0 |
| Sunny_hours | 7:23 |


The current population in Santa Cruz County is 268,571. The population has decreased -0.7% from 2019.
| Year | Population | % Change |
|---|---|---|
| 2022 | 272,138 | -0.4% |
| 2021 | 273,170 | -0.3% |
| 2020 | 273,962 | - |
Santa Cruz County is 50.0% female with 134,315 female residents.
Santa Cruz County is 50.0% male with 134,256 male residents.
| Gender | Santa Cruz County | CA | USA |
|---|---|---|---|
| Female | 50.0% | 49.9% | 50.4% |
| Male | 50.0% | 50.1% | 49.6% |
Santa Cruz County is:
55.7% White with 149,686 White residents.
0.8% African American with 2,193 African American residents.
0.1% American Indian with 182 American Indian residents.
4.7% Asian with 12,536 Asian residents.
0.2% Hawaiian with 452 Hawaiian residents.
0.5% Other with 1,324 Other residents.
3.8% Two Or More with 10,275 Two Or More residents.
34.2% Hispanic with 91,923 Hispanic residents.
| Race | Santa Cruz County | CA | USA |
|---|---|---|---|
| White | 55.7% | 35.2% | 58.9% |
| African American | 0.8% | 5.3% | 12.1% |
| American Indian | 0.1% | 0.3% | 0.6% |
| Asian | 4.7% | 14.9% | 5.7% |
| Hawaiian | 0.2% | 0.3% | 0.2% |
| Other | 0.5% | 0.4% | 0.4% |
| Two Or More | 3.8% | 3.8% | 3.5% |
| Hispanic | 34.2% | 39.7% | 18.7% |
3.9% of households in Santa Cruz County earn Less than $10,000.
2.8% of households in Santa Cruz County earn $10,000 to $14,999.
5.4% of households in Santa Cruz County earn $15,000 to $24,999.
5.1% of households in Santa Cruz County earn $25,000 to $34,999.
7.6% of households in Santa Cruz County earn $35,000 to $49,999.
11.5% of households in Santa Cruz County earn $50,000 to $74,999.
11.9% of households in Santa Cruz County earn $75,000 to $99,999.
16.8% of households in Santa Cruz County earn $100,000 to $149,999.
12.6% of households in Santa Cruz County earn $150,000 to $199,999.
22.4% of households in Santa Cruz County earn $200,000 or more.
| Income | Santa Cruz County | CA | USA |
|---|---|---|---|
| Less than $10,000 | 3.9% | 4.4% | 4.9% |
| $10,000 to $14,999 | 2.8% | 3.2% | 3.8% |
| $15,000 to $24,999 | 5.4% | 5.6% | 7.0% |
| $25,000 to $34,999 | 5.1% | 6.0% | 7.4% |
| $35,000 to $49,999 | 7.6% | 8.7% | 10.7% |
| $50,000 to $74,999 | 11.5% | 13.7% | 16.1% |
| $75,000 to $99,999 | 11.9% | 12.0% | 12.8% |
| $100,000 to $149,999 | 16.8% | 17.8% | 17.1% |
| $150,000 to $199,999 | 12.6% | 10.7% | 8.8% |
| $200,000 or more | 22.4% | 17.9% | 11.4% |
7.0% of adults in Santa Cruz County completed < 9th grade.
4.0% of adults in Santa Cruz County completed 9-12th grade.
16.0% of adults in Santa Cruz County completed high school / ged.
22.0% of adults in Santa Cruz County completed some college.
8.0% of adults in Santa Cruz County completed associate's degree.
25.0% of adults in Santa Cruz County completed bachelor's degree.
12.0% of adults in Santa Cruz County completed master's degree.
3.0% of adults in Santa Cruz County completed professional degree.
3.0% of adults in Santa Cruz County completed doctorate degree.
| Education | Santa Cruz County | CA | USA |
|---|---|---|---|
| < 9th Grade | 7% | 8% | 3% |
| 9-12th Grade | 4% | 7% | 6% |
| High School / GED | 16% | 20% | 26% |
| Some College | 22% | 20% | 20% |
| Associate's Degree | 8% | 8% | 9% |
| Bachelor's Degree | 25% | 22% | 21% |
| Master's Degree | 12% | 9% | 10% |
| Professional Degree | 3% | 3% | 2% |
| Doctorate Degree | 3% | 2% | 2% |
HomeSnacks is based in Durham, NC.
We aim to deliver bite-sized pieces of infotainment about where you live.
We use data, analytics, and a sense of humor to determine quality of life for places across the nation.