Everyone wants a bit of a blissful breeze or a scoop of sunny sanctuary when looking for a place to live in New Jersey.
The more sun, the more you can go outside. The more you go outside, the more you’ll feel at peace. The more you’ll feel at peace, the more you’ll enjoy where you live.
So it makes sense to try and find the places with the best weather in New Jersey. We used Saturday Night Science to compare the number of sunny days, total precipitation, and the deviation from the ideal 70-degree weather for 139 places in New Jersey over 10,000 people.
Grab your shades and put away your raincoat as we look at the cities with the best weather in New Jersey.
291.1 sunny days · 64.8 degree average high
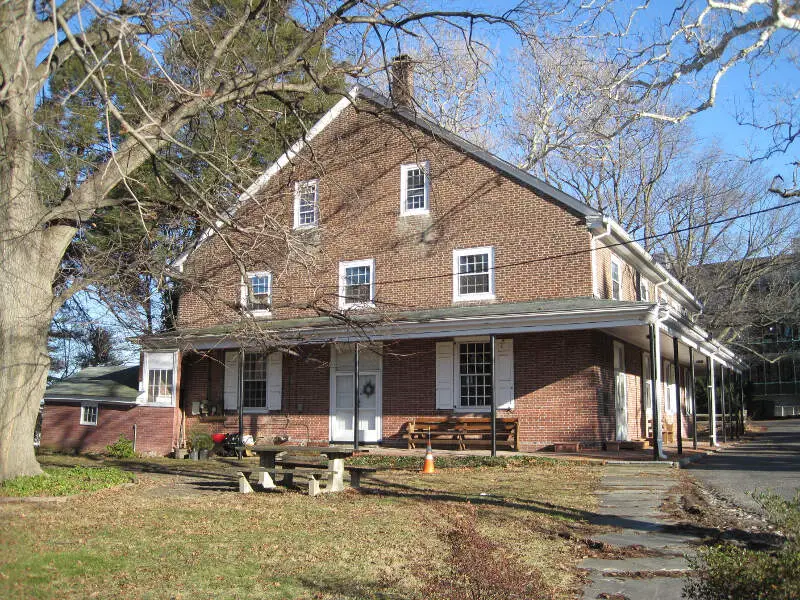
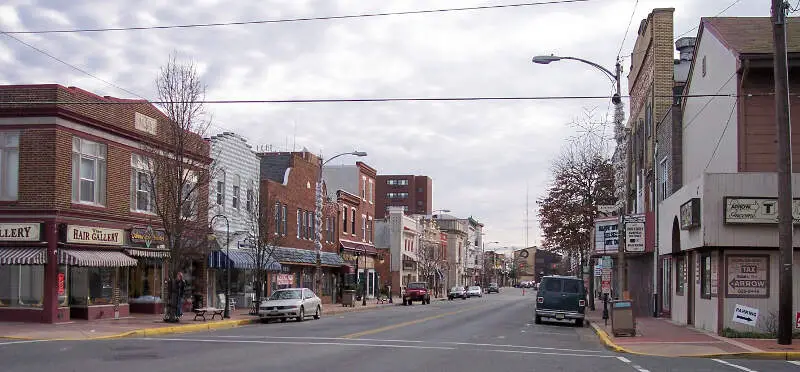
Williamstown is an unincorporated community and census-designated place located within Monroe Township, in Gloucester County, New Jersey, United States. As of the 2010 United States Census, the CDP’s population was 15,567.
Data | Crime | Cost of living | Movers
291.1 sunny days · 64.8 degree average high
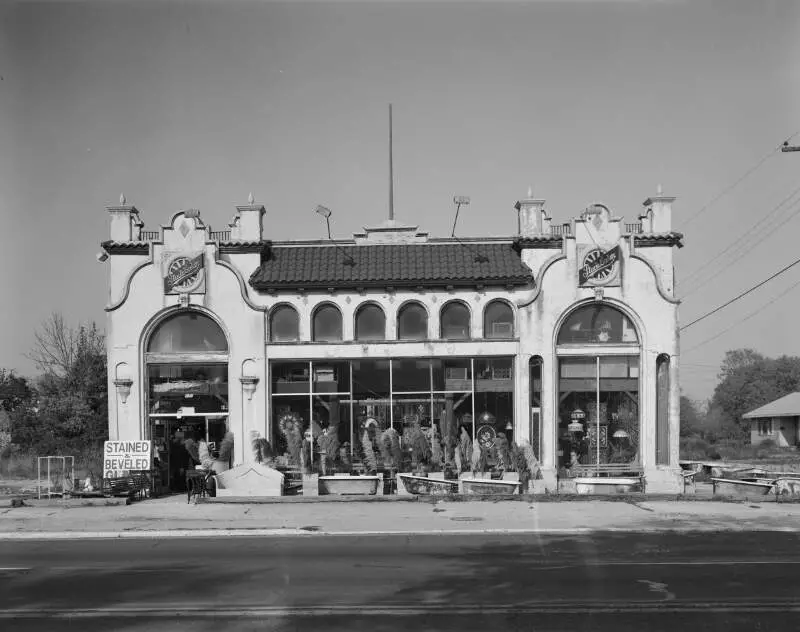
Woodbury is a city in Gloucester County, New Jersey, in the United States. As of the 2010 United States Census the city’s population was 10,174, reflecting a decline of 133 from the 10,307 counted in the 2000 Census, which had in turn declined by 597 from the 10,904 counted in the 1990 Census. Woodbury is the county seat of Gloucester County.
Data | Crime | Cost of living | Movers
294.8 sunny days · 65.1 degree average high
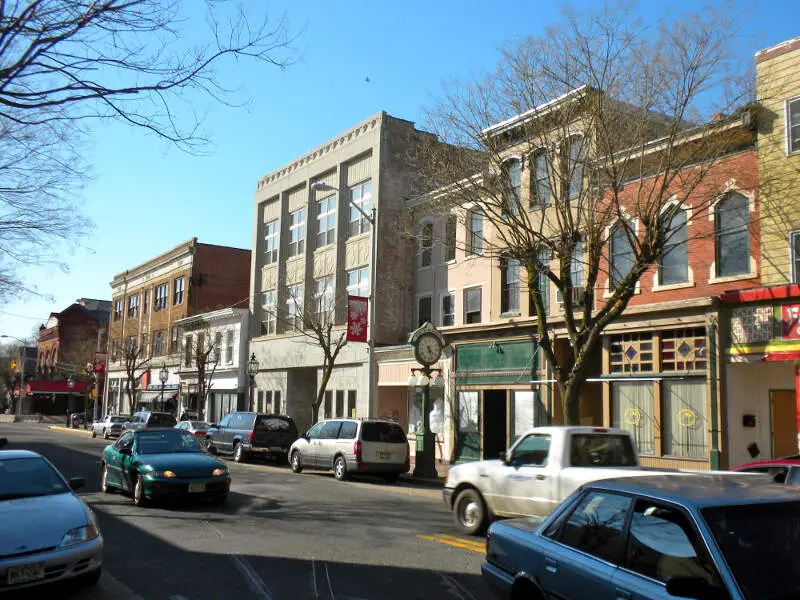
Vineland is a city in Cumberland County, New Jersey, United States. As of the 2010 United States Census, the city had a total population of 60,724, reflecting an increase of 4,453 from the 56,271 counted in the 2000 Census, which had in turn increased by 1,491 from the 54,780 counted in the 1990 Census. Vineland, Millville and Bridgeton are the three principal New Jersey cities of the Vineland-Millville-Bridgeton Primary Metropolitan Statistical Area, which encompasses those three cities and all of Cumberland County for statistical purposes and had a population of 156,898 as of the 2010 Census.
Data | Crime | Cost of living | Movers
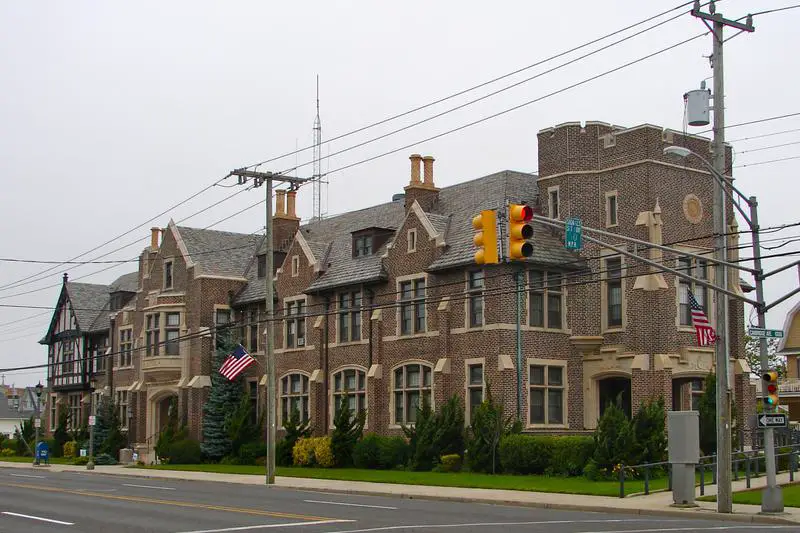
293.2 sunny days · 63.9 degree average high
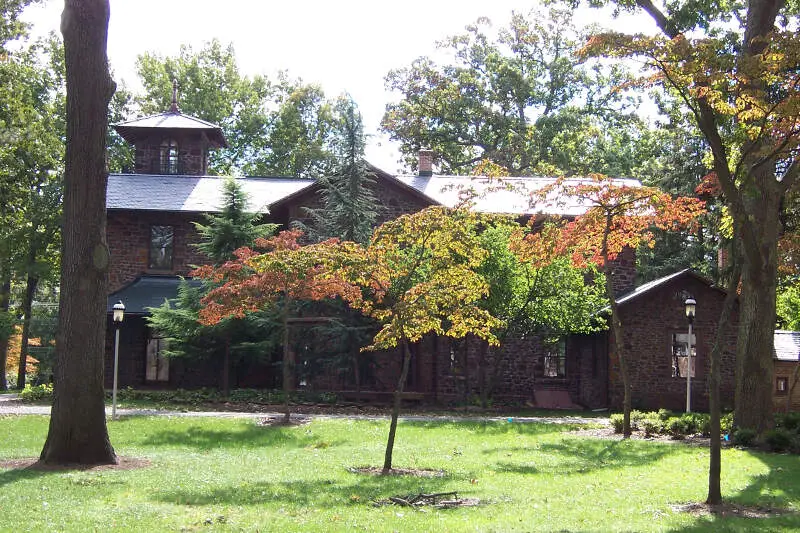
Somers Point is the oldest settlement in Atlantic County, New Jersey, United States. It was first settled in 1693, and was incorporated as a borough in 1886. Somers Point was incorporated as a city in 1902. At the 2010 United States Census, the city’s population was 10,795, reflecting a decline of 819 from the 11,614 counted in the 2000 Census, which had in turn increased by 398 from the 11,216 counted in the 1990 Census.
Data | Crime | Cost of living | Movers
294.8 sunny days · 65.0 degree average high
Millville is a city in Cumberland County, New Jersey, United States. As of the 2010 United States Census, the city’s population was 28,400, reflecting an increase of 1,553 from the 26,847 counted in the 2000 Census, which had in turn increased by 855 from the 25,992 counted in the 1990 Census. Millville, Bridgeton and Vineland are the three principal New Jersey cities of the Vineland-Millville-Bridgeton Primary Metropolitan Statistical Area which encompasses those cities and all of Cumberland County for statistical purposes.
Data | Crime | Cost of living | Movers
293.2 sunny days · 63.8 degree average high
Data | Crime | Cost of living | Movers
288.7 sunny days · 65.1 degree average high
Bridgeton is a city in Cumberland County, New Jersey, United States, in the southern part of the state, on the Cohansey River, near Delaware Bay. As of the 2010 United States Census, the city’s population was 25,349, reflecting an increase of 2,578 from the 22,771 counted in the 2000 Census, which had in turn increased by 3,829 from the 18,942 counted in the 1990 Census. It is the county seat of Cumberland County. Bridgeton, Millville, and Vineland are the three principal cities of the Vineland-Millville-Bridgeton Primary Metropolitan Statistical Area, which encompasses those cities and all of Cumberland County for statistical purposes and which constitutes a part of the Delaware Valley.
Data | Crime | Cost of living | Movers
288.2 sunny days · 65.0 degree average high
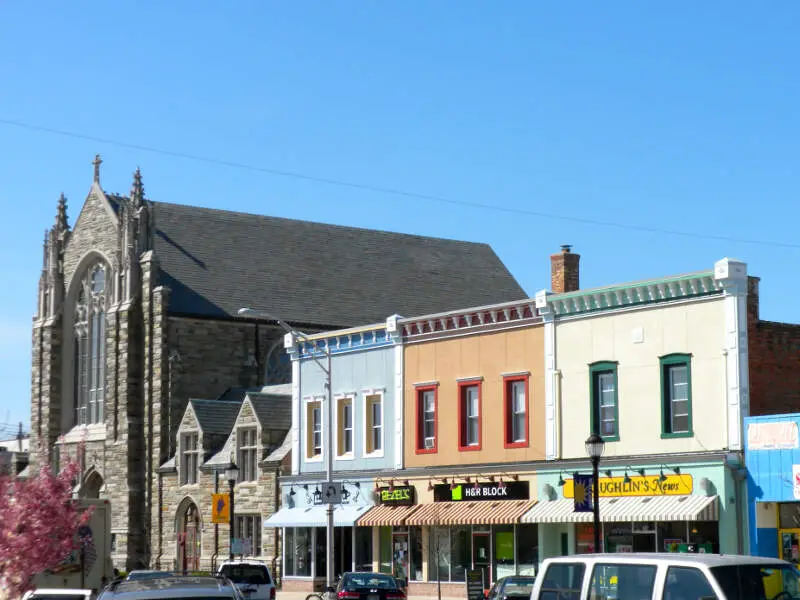
Glassboro is a borough in Gloucester County, New Jersey, United States. As of the 2010 United States Census, the borough’s population was 18,579, reflecting a decline of 489 from the 19,068 counted in the 2000 Census, which had in turn increased by 3,454 over the 15,614 counted in the 1990 Census.
Data | Crime | Cost of living | Movers
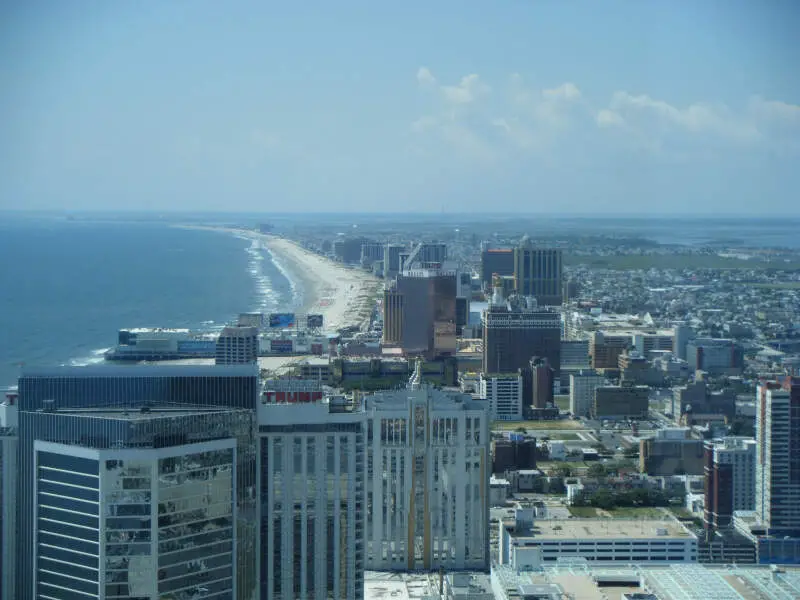
297.4 sunny days · 62.1 degree average high
Atlantic City is a resort city in Atlantic County, New Jersey, United States, known for its casinos, boardwalks, and beaches. In 2010, it had a population of 39,558. The city was incorporated on May 1, 1854, from portions of Egg Harbor Township and Galloway Township. It borders Absecon, Brigantine, Pleasantville, Ventnor City, West Atlantic City, and the Atlantic Ocean.
Data | Crime | Cost of living | Movers
297.4 sunny days · 62.3 degree average high
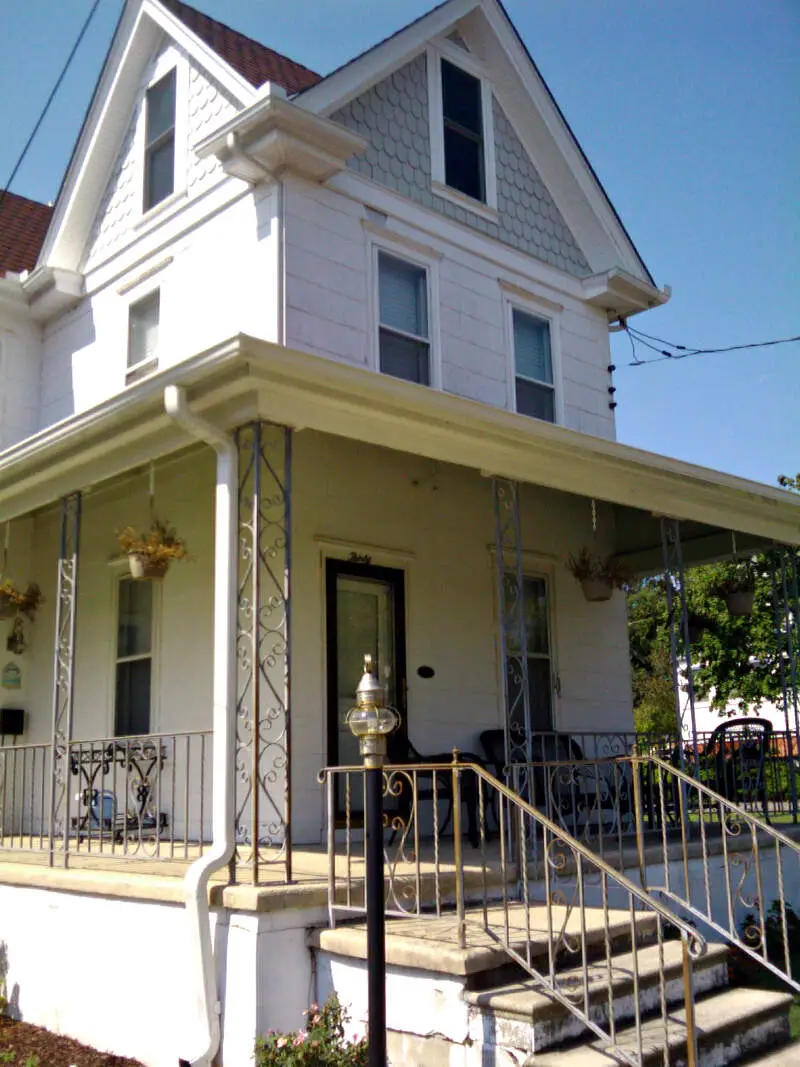
Ventnor City is a city in Atlantic County, New Jersey, United States. As of the 2010 United States Census, the city’s population was 10,650, reflecting a decrease of 2,260 from the 12,910 counted in the 2000 Census, which had in turn increased by 1,905 from the 11,005 counted in the 1990 Census.
Data | Crime | Cost of living | Movers
The receipts
Compare the top ten
Pick a metric. The bars rescale. The red line is New Jersey’s statewide median.
On the map
Where New Jersey’s best weather is
Saturday Night Science
How We Determined The Cities In New Jersey With The Best Weather
To rank the most fair weather cities in New Jersey, we used Saturday Night Science and the National Oceanic and Atmospheric Administration (NOAA) database, to see which cities in the Garden State get the best weather.
We used the following criteria to find the best weather:
- Number of sunny days
- Highest average low
- Average high deviation from 70 degrees
- Least amount of rain
- Least amount of snow
We ranked each city of over 10,000 people in New Jersey from best to worst on each criterion. We then averaged each ranking into a weather quality index. The city with the best index, Williamstown, was anointed the city with the best weather in New Jersey.
Before we get too far, here are the annual precipitation rates for major cities: Newark (48.1 inches), Jersey City (47.5 inches), and Paterson (50.4 inches).
The cities with the best weather in New Jersey are Williamstown, Woodbury, Vineland, Somers Point, Millville, Pleasantville, Bridgeton, Glassboro, Atlantic City, and Ventnor City.
There’s a complete chart at the bottom.
The full plate
Detailed List Of Places With The Best Weather In New Jersey
Click any column to sort. Search by city name.
| Rank | City | Population | Sunny Days | Avg. High | Precipitation (Inches) | Snow (Inches) |
|---|---|---|---|---|---|---|
| 1 | Williamstown | 15,539 | 291.1 | 64.8 | 45.5 | 16.6 |
| 2 | Woodbury | 10,087 | 291.1 | 64.8 | 45.5 | 16.6 |
| 3 | Vineland | 60,987 | 294.8 | 65.1 | 45.1 | 15.2 |
| 4 | Somers Point | 10,776 | 293.2 | 63.9 | 43.5 | 16.1 |
| 5 | Millville | 28,515 | 294.8 | 65.0 | 43.4 | 13.1 |
| 6 | Pleasantville | 20,518 | 293.2 | 63.8 | 43.1 | 17.0 |
| 7 | Bridgeton | 25,201 | 288.7 | 65.1 | 43.7 | 13.9 |
| 8 | Glassboro | 18,958 | 288.2 | 65.0 | 46.6 | 17.4 |
| 9 | Atlantic City | 39,547 | 297.4 | 62.1 | 40.6 | 13.8 |
| 10 | Ventnor City | 10,593 | 297.4 | 62.3 | 41.4 | 14.1 |
| 11 | Ocean City | 11,470 | 293.2 | 62.8 | 42.6 | 15.9 |
| 12 | Collingswood | 13,925 | 284.9 | 65.0 | 46.5 | 12.0 |
| 13 | Springdale | 14,145 | 285.3 | 65.0 | 46.7 | 12.3 |
| 14 | Greentree | 11,283 | 285.3 | 65.0 | 46.7 | 12.3 |
| 15 | Echelon | 11,276 | 285.3 | 65.0 | 46.7 | 12.3 |
| 16 | Pine Hill | 10,419 | 285.3 | 65.0 | 46.7 | 12.3 |
| 17 | Bellmawr | 11,507 | 284.9 | 64.9 | 46.2 | 13.5 |
| 18 | Camden | 76,904 | 284.4 | 64.9 | 46.4 | 13.4 |
| 19 | Moorestown-Lenola | 14,217 | 288.5 | 64.6 | 46.7 | 14.2 |
| 20 | Browns Mills | 10,831 | 288.5 | 64.6 | 46.7 | 14.2 |
| 21 | Marlton | 10,271 | 288.5 | 64.6 | 46.7 | 14.2 |
| 22 | Haddonfield | 11,474 | 284.9 | 64.9 | 46.8 | 10.3 |
| 23 | Gloucester City | 11,386 | 284.4 | 64.9 | 46.1 | 14.3 |
| 24 | Lindenwold | 17,492 | 284.9 | 64.9 | 46.9 | 11.4 |
| 25 | Hammonton | 14,735 | 285.9 | 65.3 | 45.9 | 18.5 |
| 26 | Hoboken | 52,452 | 292.3 | 62.8 | 47.6 | 25.6 |
| 27 | Ocean Acres | 16,000 | 286.8 | 63.4 | 45.9 | 15.4 |
| 28 | Holiday City-Berkeley | 12,132 | 286.8 | 63.4 | 45.9 | 15.4 |
| 29 | Perth Amboy | 52,179 | 290.4 | 64.0 | 47.8 | 24.9 |
| 30 | Avenel | 18,793 | 290.4 | 64.0 | 48.2 | 24.7 |
| 31 | Harrison | 14,629 | 290.5 | 63.5 | 48.0 | 25.4 |
| 32 | Jersey City | 259,651 | 292.3 | 62.9 | 47.5 | 26.1 |
| 33 | Beachwood | 11,128 | 285.4 | 64.2 | 47.0 | 12.6 |
| 34 | New Milford | 16,640 | 291.1 | 63.0 | 47.3 | 25.5 |
| 35 | Secaucus | 18,170 | 292.3 | 63.0 | 48.2 | 25.6 |
| 36 | Rahway | 28,644 | 290.4 | 64.0 | 48.4 | 24.7 |
| 37 | Carteret | 23,965 | 290.4 | 63.6 | 48.2 | 25.4 |
| 38 | Middlesex | 13,831 | 288.6 | 63.9 | 47.8 | 22.2 |
| 39 | Guttenberg | 11,595 | 291.2 | 62.8 | 47.8 | 25.9 |
| 40 | Bergenfield | 27,339 | 291.1 | 62.8 | 47.4 | 25.5 |
| 41 | River Edge | 11,566 | 291.1 | 63.0 | 47.7 | 25.5 |
| 42 | Manville | 10,454 | 288.6 | 63.4 | 47.3 | 20.9 |
| 43 | Trenton | 84,632 | 287.4 | 64.2 | 48.3 | 20.6 |
| 44 | Kearny | 41,866 | 290.5 | 63.3 | 48.1 | 25.7 |
| 45 | Bound Brook | 10,515 | 288.6 | 63.6 | 47.5 | 21.5 |
| 46 | Dumont | 17,820 | 291.1 | 62.7 | 47.1 | 25.5 |
| 47 | Union City | 68,656 | 292.3 | 62.3 | 47.9 | 25.6 |
| 48 | Hamilton Square | 13,456 | 287.0 | 63.9 | 48.1 | 21.1 |
| 49 | Mercerville | 13,371 | 287.0 | 63.9 | 48.1 | 21.1 |
| 50 | Bayonne | 65,378 | 289.3 | 63.2 | 47.9 | 26.5 |
| 51 | Woodbridge | 19,822 | 288.0 | 63.8 | 47.8 | 24.7 |
| 52 | Iselin | 19,146 | 288.0 | 63.8 | 47.8 | 24.7 |
| 53 | Colonia | 17,517 | 288.0 | 63.8 | 47.8 | 24.7 |
| 54 | Fords | 15,085 | 288.0 | 63.8 | 47.8 | 24.7 |
| 55 | Princeton Meadows | 13,839 | 288.0 | 63.8 | 47.8 | 24.7 |
| 56 | Kendall Park | 10,323 | 288.0 | 63.8 | 47.8 | 24.7 |
| 57 | Tinton Falls | 17,872 | 287.5 | 62.8 | 46.8 | 24.9 |
| 58 | Asbury Park | 15,945 | 287.5 | 62.8 | 46.8 | 24.9 |
| 59 | West Freehold | 14,000 | 287.5 | 62.8 | 46.8 | 24.9 |
| 60 | Freehold | 11,978 | 287.5 | 62.8 | 46.8 | 24.9 |
| 61 | Robertsville | 11,334 | 287.5 | 62.8 | 46.8 | 24.9 |
| 62 | Paramus | 26,760 | 291.1 | 62.9 | 47.9 | 25.4 |
| 63 | Roselle | 21,466 | 290.4 | 63.7 | 48.4 | 25.6 |
| 64 | Long Branch | 30,721 | 287.6 | 61.9 | 47.3 | 24.7 |
| 65 | Red Bank | 12,238 | 287.6 | 63.0 | 46.8 | 26.1 |
| 66 | North Arlington | 15,734 | 290.5 | 63.0 | 48.4 | 26.0 |
| 67 | Linden | 41,322 | 290.4 | 63.7 | 48.5 | 25.7 |
| 68 | Newark | 279,793 | 290.1 | 63.2 | 48.1 | 26.2 |
| 69 | Tenafly | 14,788 | 291.1 | 62.7 | 47.6 | 27.2 |
| 71 | Elizabeth | 127,759 | 289.3 | 63.6 | 48.3 | 26.7 |
| 72 | Englewood | 27,992 | 291.1 | 62.8 | 48.3 | 26.1 |
| 73 | Sayreville | 44,051 | 286.9 | 64.1 | 47.6 | 25.6 |
| 74 | South River | 16,274 | 286.9 | 63.9 | 47.6 | 25.3 |
| 75 | Somerville | 12,212 | 287.7 | 63.0 | 47.3 | 24.7 |
| 76 | South Plainfield | 23,871 | 286.4 | 63.9 | 48.3 | 23.8 |
| 77 | Point Pleasant | 18,426 | 285.4 | 62.4 | 46.7 | 24.6 |
| 78 | Metuchen | 13,765 | 286.4 | 63.8 | 48.1 | 24.8 |
| 79 | Eato | 12,298 | 287.6 | 62.7 | 47.2 | 26.2 |
| 80 | Plainfield | 50,678 | 286.4 | 63.8 | 48.5 | 23.6 |
| 81 | Westwood | 11,140 | 290.0 | 62.8 | 47.5 | 26.8 |
| 82 | Little Ferry | 10,856 | 285.5 | 63.1 | 48.6 | 25.6 |
| 83 | Somerset | 24,409 | 287.5 | 62.9 | 48.3 | 23.3 |
| 84 | North Plainfield | 22,156 | 287.5 | 62.9 | 48.3 | 23.3 |
| 85 | Franklin Park | 15,238 | 287.5 | 62.9 | 48.3 | 23.3 |
| 86 | Bradley Gardens | 13,994 | 287.5 | 62.9 | 48.3 | 23.3 |
| 87 | Highland Park | 14,263 | 286.9 | 64.0 | 47.8 | 26.0 |
| 88 | Martinsville | 11,950 | 288.6 | 62.1 | 48.0 | 21.1 |
| 89 | Westfield | 30,552 | 284.5 | 63.8 | 48.6 | 23.8 |
| 90 | Wanaque | 11,617 | 289.5 | 61.5 | 48.1 | 22.6 |
| 91 | New Brunswick | 56,338 | 286.9 | 64.0 | 47.7 | 26.5 |
| 92 | West New York | 51,860 | 287.0 | 62.2 | 48.3 | 26.0 |
| 93 | Hackensack | 44,035 | 285.5 | 63.0 | 48.4 | 25.6 |
| 94 | East Orange | 64,578 | 290.5 | 62.8 | 48.5 | 26.2 |
| 95 | Rutherford | 18,434 | 285.5 | 63.0 | 48.8 | 25.6 |
| 96 | Edgewater | 11,935 | 287.0 | 62.4 | 48.6 | 26.0 |
| 97 | Wallington | 11,584 | 285.5 | 63.1 | 49.1 | 25.5 |
| 98 | Pompton Lakes | 11,179 | 289.5 | 61.9 | 48.5 | 23.5 |
| 99 | Hillsdale | 10,452 | 290.0 | 62.6 | 47.9 | 26.4 |
| 100 | Fairview | 14,233 | 287.0 | 62.3 | 48.6 | 26.0 |
| 101 | Ridgefield Park | 12,969 | 285.5 | 62.9 | 48.6 | 26.0 |
Source: NOAA climate data. 139 New Jersey cities with more than 10,000 residents.
Summary
Summary: The Cities With The Best Weather In New Jersey For 2026
If you’re looking for the New Jersey cities with the most sunny days, the least rain and snow, and highs closest to a perfect 70 degrees, this is an accurate list.
The cities with the best weather in New Jersey are Williamstown, Woodbury, Vineland, Somers Point, Millville, Pleasantville, Bridgeton, Glassboro, Atlantic City, and Ventnor City.