Everyone wants a bit of a blissful breeze or a scoop of sunny sanctuary when looking for a place to live in North Carolina.
The more sun, the more you can go outside. The more you go outside, the more you’ll feel at peace. The more you’ll feel at peace, the more you’ll enjoy where you live.
So it makes sense to try and find the places with the best weather in North Carolina. We used Saturday Night Science to compare the number of sunny days, total precipitation, and the deviation from the ideal 70-degree weather for 86 places in North Carolina over 10,000 people.
Grab your shades and put away your raincoat as we look at the cities with the best weather in North Carolina.

296.0 sunny days · 71.4 degree average high
Gastonia is the largest city and county seat of Gaston County, North Carolina, United States. It is also the second largest satellite city of the Charlotte area, behind Concord. The population was 71,741 at the 2010 Census. Gastonia is the 13th largest city in North Carolina. It is part of the Charlotte metropolitan area, officially designated the Charlotte Metropolitan Statistical Area. Gastonia has experienced steady growth, with a population increase between 2000 and 2010 of nearly 8.2%, according to the U.S. Census Bureau.
Data | Crime | Cost of living | Movers

296.5 sunny days · 71.7 degree average high
Mount Holly is a small suburban city in northeastern Gaston County, North Carolina, United States. The city is situated just west of the Catawba River, north of Interstate 85, south of North Carolina State Highway 16, and west of Charlotte. The population was 13,656 at the 2010 census, up from 9,618 at the 2000 census.
Data | Crime | Cost of living | Movers
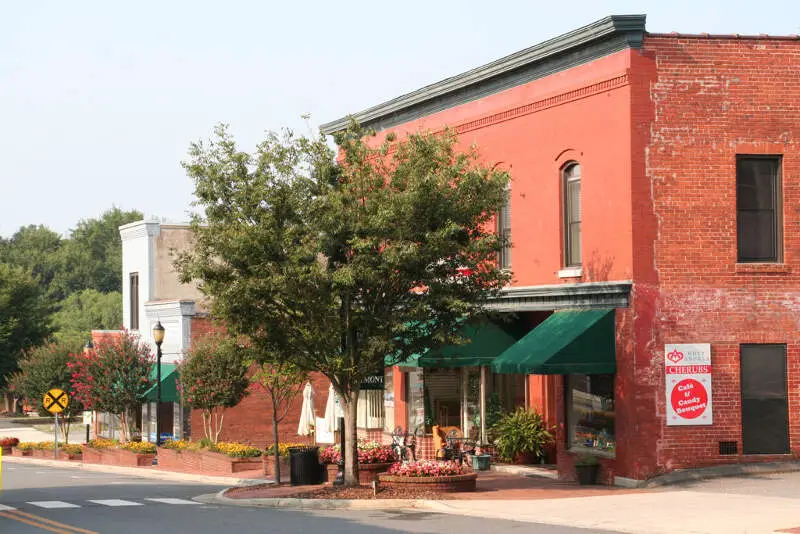
294.4 sunny days · 71.5 degree average high
Belmont is a small suburban city in Gaston County, North Carolina, United States, located about 15 miles west of uptown Charlotte and 9 miles east of Gastonia. The population was 10,076 at the 2010 census. Once known as Garibaldi Station, the name change for Belmont is disputed. Some say it was named for a prominent New York banker – August Belmont. Others contend the Pope ordered the abbot of the monastery to change the name since he would not tolerate an abbey in a place that bore the Garibaldi name. The abbot could see Crowder’s mountain from the property and named the town Belmont – “beautiful mountain”. Belmont is home to Belmont Abbey College.
Data | Crime | Cost of living | Movers

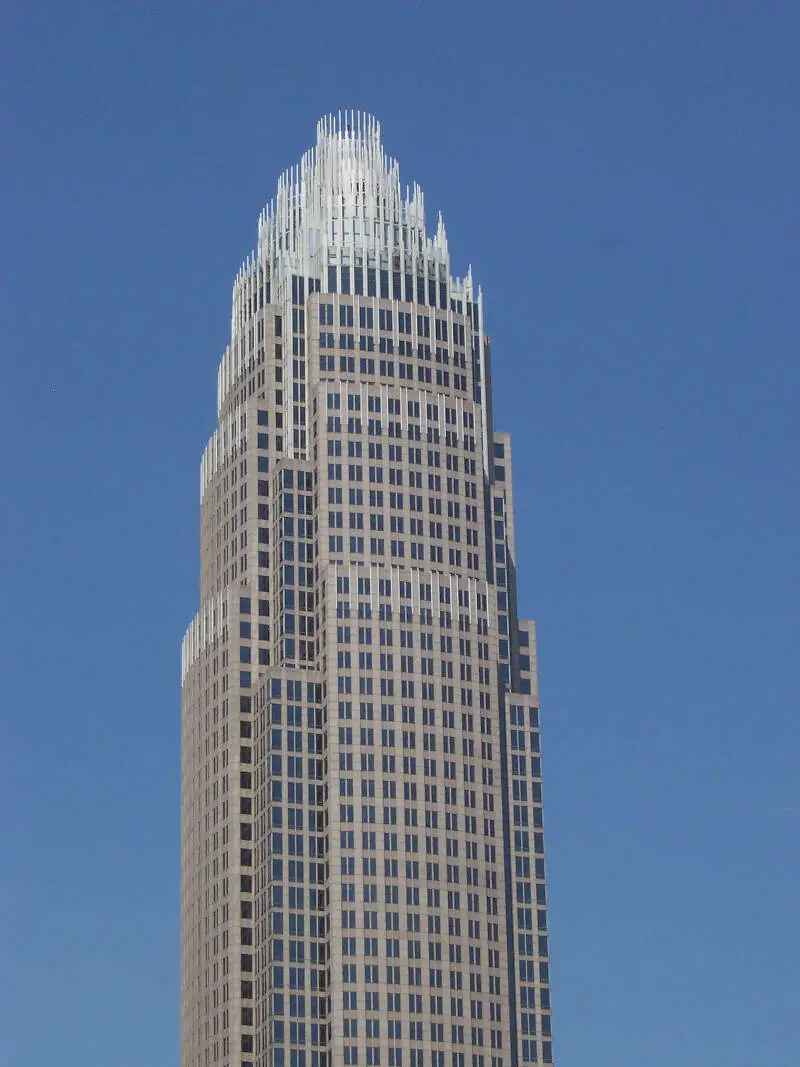
294.6 sunny days · 71.4 degree average high
Charlotte is the most populous city in the U.S. state of North Carolina. It is the county seat of Mecklenburg County. In 2016, the U.S.Census Bureau estimated the population was 842,051, making it the 17th-most populous city in the United States. The Charlotte metropolitan area ranks 22nd-largest in the U.S., and had a 2016 population of 2,474,314. The Charlotte metropolitan area is part of a sixteen-county market region or combined statistical area with a 2016 U.S.Census population estimate of 2,632,249. Between 2004 and 2014, Charlotte was ranked as the country’s fastest growing metro area, with 888,000 new residents. Based on U.S. Census data from 2005 to 2015, it also tops the 50 largest U.S. cities as the millennial hub. It is the second-largest city in the southeastern United States, just behind Jacksonville, Florida. It is the third-fastest growing major city in the United States. It is listed as a “gamma-minus” global city by the Globalization and World Cities Research Network. Residents are referred to as “Charlotteans”.
Data | Crime | Cost of living | Movers

296.5 sunny days · 70.8 degree average high
Cornelius is a lakeside town located along Lake Norman in northern Mecklenburg County, North Carolina, United States. The population was 24,866 at the 2010 census.
Data | Crime | Cost of living | Movers
294.4 sunny days · 71.4 degree average high
Data | Crime | Cost of living | Movers
291.7 sunny days · 71.4 degree average high
Matthews is a large suburban town of Charlotte located in southeastern Mecklenburg County, North Carolina. The population was 27,198 according to the 2010 Census.
Data | Crime | Cost of living | Movers
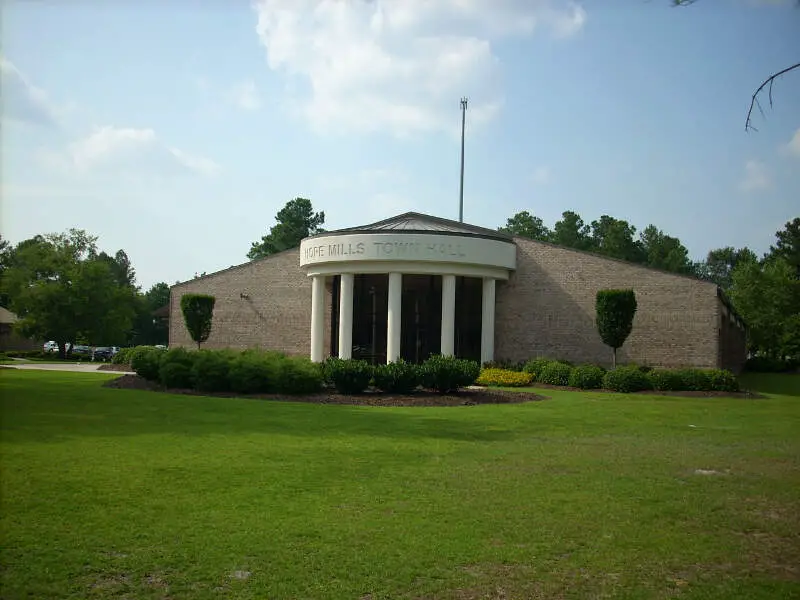
298.0 sunny days · 73.1 degree average high
Hope Mills is a town in Cumberland County, North Carolina, United States. The population was 15,176 at the 2010 census.
Data | Crime | Cost of living | Movers
291.3 sunny days · 71.0 degree average high
Data | Crime | Cost of living | Movers
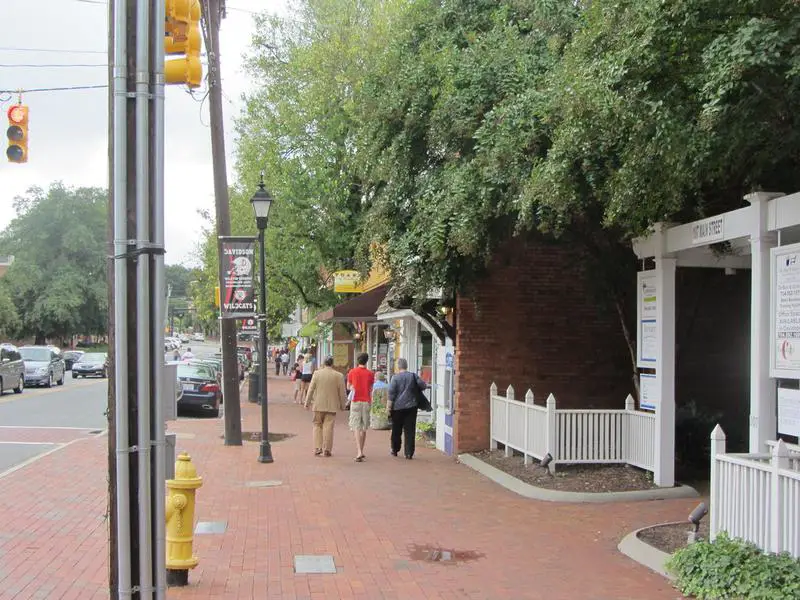
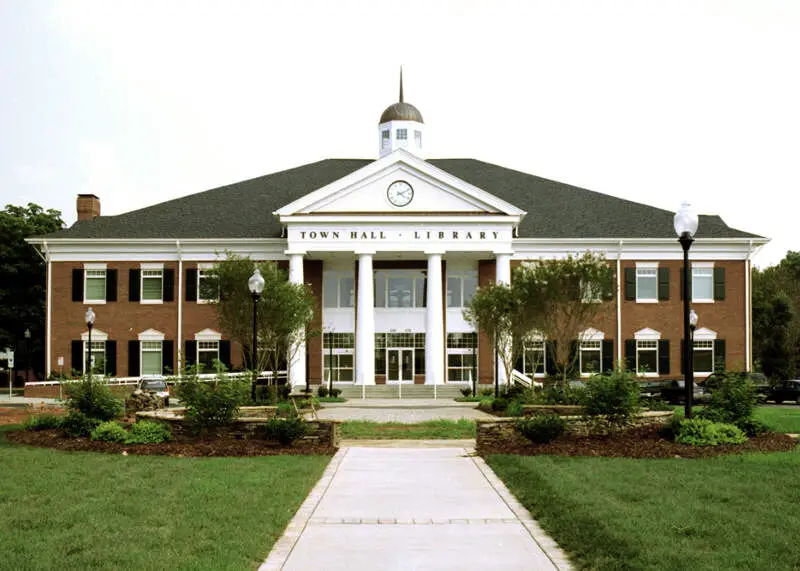
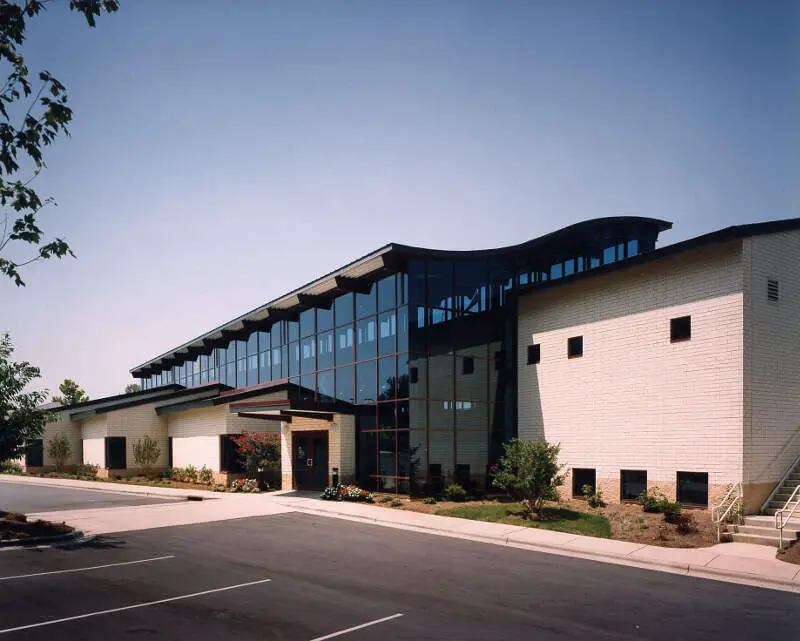
294.4 sunny days · 71.0 degree average high
Davidson is a lakeside town on Lake Norman in northern Mecklenburg County in the U.S. state of North Carolina. The population was 10,944 at the 2010 census. It is home to Davidson College. The town is centered on the college from which it takes its name.
Data | Crime | Cost of living | Movers
The receipts
Compare the top ten
Pick a metric. The bars rescale. The red line is North Carolina’s statewide median.
On the map
Where North Carolina’s best weather is
Saturday Night Science
How We Determined The Cities In North Carolina With The Best Weather
To rank the most fair weather cities in North Carolina, we used Saturday Night Science and the National Oceanic and Atmospheric Administration (NOAA) database, to see which cities in the Tar Heel State get the best weather.
We used the following criteria to find the best weather:
- Number of sunny days
- Highest average low
- Average high deviation from 70 degrees
- Least amount of rain
- Least amount of snow
We ranked each city of over 10,000 people in North Carolina from best to worst on each criterion. We then averaged each ranking into a weather quality index. The city with the best index, Gastonia, was anointed the city with the best weather in North Carolina.
Before we get too far, here are the annual precipitation rates for major cities: Charlotte (43.4 inches), Raleigh (45.6 inches), and Greensboro (43.8 inches).
The cities with the best weather in North Carolina are Gastonia, Mount Holly, Belmont, Charlotte, Cornelius, Mint Hill, Matthews, Hope Mills, Huntersville, and Davidson.
There’s a complete chart at the bottom.
The full plate
Detailed List Of Places With The Best Weather In North Carolina
Click any column to sort. Search by city name.
| Rank | City | Population | Sunny Days | Avg. High | Precipitation (Inches) | Snow (Inches) |
|---|---|---|---|---|---|---|
| 1 | Gastonia | 73,211 | 296.0 | 71.4 | 42.8 | 1.4 |
| 2 | Mount Holly | 13,924 | 296.5 | 71.7 | 42.5 | 1.3 |
| 3 | Belmont | 10,387 | 294.4 | 71.5 | 42.5 | 2.0 |
| 4 | Charlotte | 792,137 | 294.6 | 71.4 | 43.4 | 2.5 |
| 5 | Cornelius | 26,866 | 296.5 | 70.8 | 43.7 | 2.3 |
| 6 | Mint Hill | 24,545 | 294.4 | 71.4 | 43.5 | 2.5 |
| 7 | Matthews | 29,352 | 291.7 | 71.4 | 44.3 | 2.4 |
| 8 | Hope Mills | 16,123 | 298.0 | 73.1 | 46.3 | 0.9 |
| 9 | Huntersville | 50,433 | 291.3 | 71.0 | 43.5 | 2.3 |
| 10 | Davidson | 11,765 | 294.4 | 71.0 | 43.9 | 2.6 |
| 11 | Laurinburg | 15,694 | 300.6 | 73.6 | 45.2 | 1.6 |
| 12 | Stallings | 14,495 | 291.3 | 71.3 | 44.6 | 3.3 |
| 13 | Burlington | 52,241 | 292.3 | 70.6 | 44.5 | 2.5 |
| 14 | Indian Trail | 35,602 | 294.4 | 71.6 | 44.9 | 3.2 |
| 15 | Fayetteville | 202,521 | 291.7 | 72.7 | 46.0 | 1.6 |
| 16 | Waxhaw | 11,586 | 291.3 | 72.2 | 44.5 | 2.2 |
| 17 | Salisbury | 33,653 | 295.6 | 70.8 | 42.1 | 3.7 |
| 18 | Mooresville | 34,930 | 291.3 | 70.4 | 43.9 | 3.4 |
| 19 | Henderson | 15,311 | 289.6 | 69.8 | 44.3 | 2.5 |
| 20 | Spring Lake | 13,336 | 291.7 | 72.7 | 46.3 | 2.2 |
| 21 | Elizabeth City | 18,111 | 285.8 | 70.7 | 47.6 | 0.7 |
| 22 | Greensboro | 279,427 | 292.8 | 69.6 | 43.8 | 5.7 |
| 23 | Weddington | 10,091 | 291.2 | 72.0 | 45.2 | 2.5 |
| 24 | Rocky Mount | 56,642 | 290.8 | 71.3 | 46.2 | 1.6 |
| 25 | Kernersville | 23,617 | 294.4 | 69.1 | 44.1 | 4.9 |
| 26 | Graham | 14,468 | 291.6 | 70.7 | 44.9 | 2.6 |
| 27 | Sanford | 28,988 | 292.7 | 72.0 | 46.3 | 2.2 |
| 28 | Clemmons | 19,340 | 292.8 | 70.3 | 43.8 | 5.6 |
| 29 | Clayton | 17,869 | 291.3 | 71.4 | 46.4 | 2.4 |
| 30 | High Point | 108,031 | 288.9 | 69.7 | 44.6 | 3.9 |
| 31 | Concord | 83,903 | 293.0 | 71.6 | 45.0 | 3.7 |
| 32 | Kannapolis | 44,520 | 291.9 | 71.1 | 44.6 | 3.8 |
| 33 | Morrisville | 21,726 | 293.9 | 70.8 | 45.3 | 4.7 |
| 34 | Wake Forest | 34,786 | 290.2 | 70.8 | 45.0 | 3.1 |
| 35 | Reidsville | 14,191 | 294.1 | 69.7 | 45.1 | 6.8 |
| 36 | Asheboro | 25,897 | 290.5 | 70.4 | 45.4 | 4.1 |
| 37 | Southern Pines | 13,018 | 292.3 | 72.2 | 46.9 | 2.5 |
| 38 | Holly Springs | 28,640 | 287.4 | 70.5 | 46.4 | 3.0 |
| 39 | Monroe | 33,951 | 287.8 | 72.1 | 45.7 | 2.3 |
| 40 | Albemarle | 15,969 | 294.4 | 72.4 | 46.5 | 2.5 |
| 41 | Lincolnton | 10,696 | 291.7 | 70.7 | 46.7 | 3.6 |
| 42 | Lumberton | 21,721 | 288.8 | 73.6 | 47.4 | 0.3 |
| 43 | Durham | 246,084 | 290.7 | 70.7 | 45.5 | 3.5 |
| 44 | Winston-Salem | 236,642 | 290.7 | 69.7 | 44.1 | 6.2 |
| 45 | Raleigh | 432,520 | 290.9 | 71.0 | 45.6 | 3.7 |
| 46 | Knightdale | 13,243 | 289.0 | 71.3 | 46.0 | 2.8 |
| 47 | Cary | 151,186 | 290.0 | 70.7 | 46.2 | 4.1 |
| 48 | Kinston | 21,540 | 290.2 | 72.9 | 49.1 | 1.4 |
| 49 | Thomasville | 27,084 | 287.1 | 70.3 | 44.5 | 4.1 |
| 50 | Smithfield | 11,562 | 289.0 | 72.2 | 46.8 | 1.8 |
| 51 | Kings Mountain | 10,792 | 291.7 | 71.3 | 46.4 | 3.7 |
| 52 | Lexington | 19,129 | 291.2 | 71.3 | 43.6 | 4.1 |
| 53 | Eden | 15,483 | 287.4 | 69.7 | 43.7 | 4.0 |
| 54 | Archdale | 11,396 | 287.1 | 70.4 | 45.1 | 3.6 |
| 55 | Mebane | 13,309 | 287.4 | 70.7 | 45.2 | 2.7 |
| 56 | Lewisville | 13,212 | 289.7 | 69.7 | 44.5 | 6.3 |
| 57 | Fuquay-Varina | 21,399 | 288.7 | 71.4 | 46.0 | 3.0 |
| 58 | Murraysville | 14,844 | 287.4 | 73.3 | 57.1 | 1.0 |
| 59 | Wilmington | 111,998 | 287.6 | 73.4 | 57.1 | 1.1 |
| 60 | Shelby | 20,245 | 294.7 | 71.2 | 48.1 | 3.5 |
| 61 | Garner | 27,160 | 288.1 | 71.4 | 46.3 | 2.9 |
| 62 | Leland | 16,122 | 287.9 | 74.0 | 56.5 | 0.9 |
| 63 | Pinehurst | 15,313 | 289.6 | 72.1 | 47.2 | 2.5 |
| 64 | Havelock | 20,729 | 285.7 | 72.8 | 56.2 | 1.4 |
| 65 | Wilson | 49,478 | 287.1 | 71.8 | 46.7 | 1.8 |
| 66 | Piney Green | 13,738 | 285.2 | 73.1 | 55.8 | 1.2 |
| 67 | Apex | 42,220 | 290.6 | 70.9 | 46.5 | 3.8 |
| 68 | Harrisburg | 13,883 | 284.3 | 71.7 | 44.6 | 3.1 |
| 69 | Greenville | 88,598 | 289.7 | 72.5 | 48.9 | 3.0 |
| 70 | Jacksonville | 68,315 | 284.3 | 73.2 | 55.5 | 1.2 |
| 71 | Statesville | 25,443 | 285.0 | 70.1 | 44.8 | 4.4 |
| 72 | Chapel Hill | 58,766 | 288.6 | 70.7 | 46.6 | 3.6 |
| 73 | Roanoke Rapids | 15,557 | 287.1 | 70.7 | 46.4 | 3.4 |
| 74 | Summerfield | 10,622 | 287.1 | 69.2 | 43.9 | 6.4 |
| 75 | Tarboro | 11,292 | 288.4 | 71.8 | 45.4 | 4.6 |
| 76 | New Bern | 30,218 | 283.4 | 73.5 | 52.9 | 1.6 |
| 77 | Carrboro | 20,639 | 288.6 | 70.7 | 46.8 | 3.7 |
| 78 | Goldsboro | 35,952 | 288.6 | 72.8 | 47.4 | 3.7 |
| 79 | Newton | 12,980 | 281.9 | 70.6 | 46.0 | 4.5 |
| 80 | Hickory | 40,172 | 280.2 | 69.7 | 46.7 | 4.9 |
| 81 | Lenoir | 17,978 | 260.0 | 69.9 | 48.0 | 4.8 |
| 82 | Morganton | 16,748 | 260.0 | 70.7 | 48.1 | 4.1 |
| 83 | Asheville | 86,789 | 283.7 | 66.6 | 40.6 | 12.0 |
| 84 | Mount Airy | 10,391 | 284.4 | 68.8 | 47.2 | 9.9 |
| 85 | Boone | 17,966 | 291.8 | 61.1 | 54.7 | 37.1 |
| 86 | Hendersonville | 13,457 | 288.6 | 66.6 | 55.4 | 8.1 |
Source: NOAA climate data. 86 North Carolina cities with more than 10,000 residents.
Summary
Summary: The Cities With The Best Weather In North Carolina For 2026
If you’re looking for the North Carolina cities with the most sunny days, the least rain and snow, and highs closest to a perfect 70 degrees, this is an accurate list.
The cities with the best weather in North Carolina are Gastonia, Mount Holly, Belmont, Charlotte, Cornelius, Mint Hill, Matthews, Hope Mills, Huntersville, and Davidson.


