Shelby, NC
Demographics And Statistics
Living In Shelby, North Carolina Summary
Life in Shelby research summary. HomeSnacks has been using Saturday Night Science to research the quality of life in Shelby over the past nine years using Census, FBI, Zillow, and other primary data sources. Based on the most recently available data, we found the following about life in Shelby:
The population in Shelby is 21,868.
The median home value in Shelby is $208,171.
The median income in Shelby is $50,705.
The cost of living in Shelby is 89 which is 0.9x lower than the national average.
The median rent in Shelby is $899.
The unemployment rate in Shelby is 3.6%.
The poverty rate in Shelby is 18.2%.
The average high in Shelby is 71.2° and the average low is 47.6°.
Shelby SnackAbility
Overall SnackAbility
Shelby, NC Crime Report
Crime in Shelby summary. We use data from the FBI to determine the crime rates in Shelby. Key points include:
There were 766 total crimes in Shelby in the last reporting year.
The overall crime rate per 100,000 people in Shelby is 3,477.4 / 100k people.
The violent crime rate per 100,000 people in Shelby is 1,044.1 / 100k people.
The property crime rate per 100,000 people in Shelby is 2,433.3 / 100k people.
Overall, crime in Shelby is 64.09% above the national average.
Total Crimes
Above National Average
Crime In Shelby Comparison Table
| Statistic | Count Raw | Shelby / 100k People | North Carolina / 100k People | National / 100k People |
|---|---|---|---|---|
| Total Crimes Per 100K | 766 | 3,477.4 | 2,343.9 | 2,119.2 |
| Violent Crime | 230 | 1,044.1 | 375.8 | 359.0 |
| Murder | 5 | 22.7 | 7.5 | 5.0 |
| Robbery | 17 | 77.2 | 50.2 | 61.0 |
| Aggravated Assault | 197 | 894.3 | 290.1 | 256.0 |
| Property Crime | 536 | 2,433.3 | 1,968.1 | 1,760.0 |
| Burglary | 107 | 485.7 | 323.9 | 229.0 |
| Larceny | 378 | 1,716.0 | 1,390.2 | 1,272.0 |
| Car Theft | 51 | 231.5 | 254.1 | 259.0 |
Shelby, NC Cost Of Living
Cost of living in Shelby summary. We use data on the cost of living to determine how expensive it is to live in Shelby. Real estate prices drive most of the variance in cost of living around North Carolina. Key points include:
The cost of living in Shelby is 89 with 100 being average.
The cost of living in Shelby is 0.9x lower than the national average.
The median home value in Shelby is $208,171.
The median income in Shelby is $50,705.
Shelby's Overall Cost Of Living
Lower Than The National Average
Cost Of Living In Shelby Comparison Table
| Living Expense | Shelby | North Carolina | National Average | |
|---|---|---|---|---|
| Overall | 89 | 92 | 100 | |
| Services | 98 | 100 | 100 | |
| Groceries | 96 | 99 | 100 | |
| Health | 98 | 106 | 100 | |
| Housing | 74 | 86 | 100 | |
| Transportation | 98 | 93 | 100 | |
| Utilities | 93 | 95 | 100 | |
Shelby, NC Weather
The average high in Shelby is 71.2° and the average low is 47.6°.
There are 70.3 days of precipitation each year.
Expect an average of 48.1 inches of precipitation each year with 3.5 inches of snow.
| Stat | Shelby |
|---|---|
| Average Annual High | 71.2 |
| Average Annual Low | 47.6 |
| Annual Precipitation Days | 70.3 |
| Average Annual Precipitation | 48.1 |
| Average Annual Snowfall | 3.5 |
Average High
Days of Rain
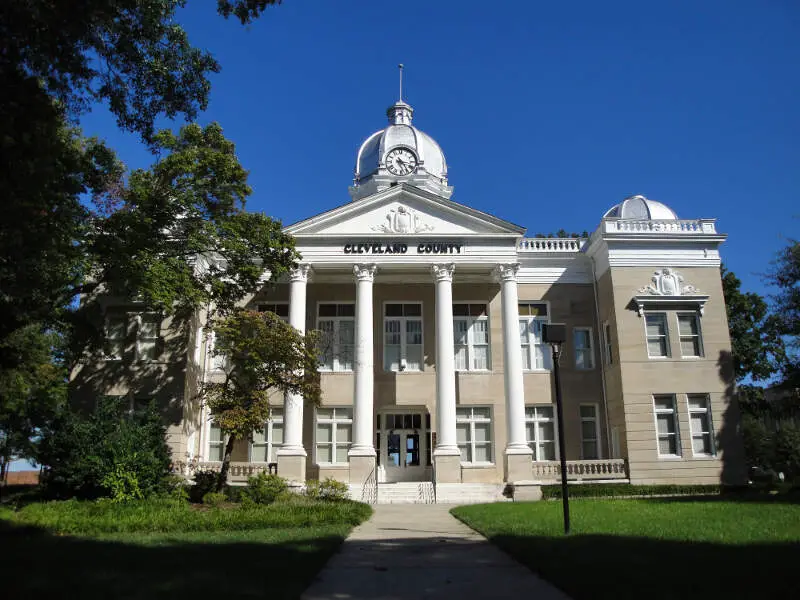
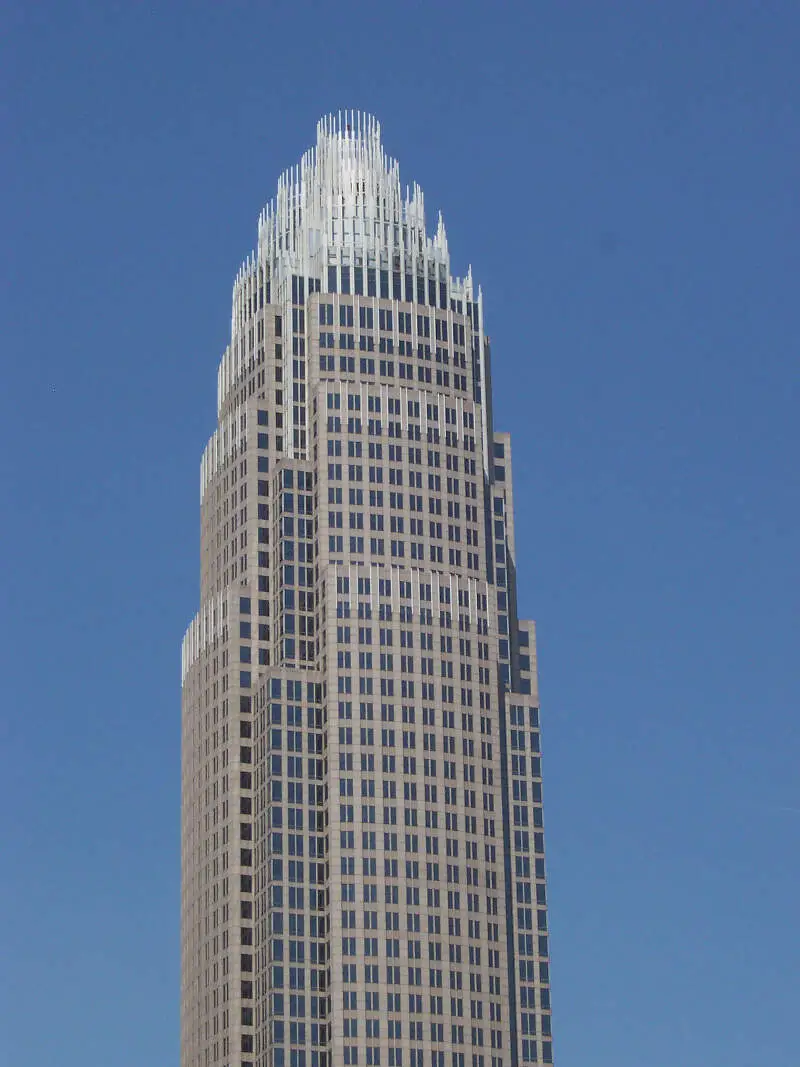
Shelby, NC Photos

1 Reviews & Comments About Shelby
/5

HomeSnacks User - None
from Shelby lived here 34 years best town and best fire dept. in Cleveland county
Rankings for Shelby in North Carolina


Locations Around Shelby
Map Of Shelby, NC
Best Places Around Shelby
Matthews, NC
Population 29,959
Davidson, NC
Population 14,852
Cornelius, NC
Population 32,009
Marvin, NC
Population 6,542
Black Mountain, NC
Population 8,462
Weddington, NC
Population 13,468
Huntersville, NC
Population 62,458
Charlotte, NC
Population 886,283
Tega Cay, SC
Population 13,267
Lake Norman of Catawba, NC
Population 9,308
Shelby Demographics And Statistics
Population over time in Shelby
The current population in Shelby is 21,868. The population has increased 7.1% from 2010.
| Year | Population | % Change |
|---|---|---|
| 2023 | 21,868 | 0.7% |
| 2022 | 21,712 | 0.7% |
| 2021 | 21,564 | 7.6% |
| 2020 | 20,046 | 0.2% |
| 2019 | 20,007 | -0.2% |
| 2018 | 20,053 | -0.0% |
| 2017 | 20,058 | -1.0% |
| 2016 | 20,259 | 0.1% |
| 2015 | 20,245 | -0.2% |
| 2014 | 20,283 | -0.3% |
| 2013 | 20,335 | 0.0% |
| 2012 | 20,331 | -0.2% |
| 2011 | 20,377 | -0.2% |
| 2010 | 20,417 | - |
Race / Ethnicity in Shelby
Shelby is:
52.7% White with 11,529 White residents.
32.3% African American with 7,068 African American residents.
0.4% American Indian with 91 American Indian residents.
0.8% Asian with 179 Asian residents.
0.3% Hawaiian with 67 Hawaiian residents.
0.1% Other with 23 Other residents.
8.6% Two Or More with 1,875 Two Or More residents.
4.7% Hispanic with 1,036 Hispanic residents.
| Race | Shelby | NC | USA |
|---|---|---|---|
| White | 52.7% | 60.6% | 58.2% |
| African American | 32.3% | 20.3% | 12.0% |
| American Indian | 0.4% | 0.8% | 0.5% |
| Asian | 0.8% | 3.1% | 5.7% |
| Hawaiian | 0.3% | 0.1% | 0.2% |
| Other | 0.1% | 0.4% | 0.5% |
| Two Or More | 8.6% | 3.7% | 3.9% |
| Hispanic | 4.7% | 10.9% | 19.0% |
Gender in Shelby
Shelby is 53.7% female with 11,736 female residents.
Shelby is 46.3% male with 10,132 male residents.
| Gender | Shelby | NC | USA |
|---|---|---|---|
| Female | 53.7% | 51.1% | 50.5% |
| Male | 46.3% | 48.9% | 49.5% |
Highest level of educational attainment in Shelby for adults over 25
2.0% of adults in Shelby completed < 9th grade.
7.0% of adults in Shelby completed 9-12th grade.
31.0% of adults in Shelby completed high school / ged.
18.0% of adults in Shelby completed some college.
14.0% of adults in Shelby completed associate's degree.
16.0% of adults in Shelby completed bachelor's degree.
8.0% of adults in Shelby completed master's degree.
3.0% of adults in Shelby completed professional degree.
1.0% of adults in Shelby completed doctorate degree.
| Education | Shelby | NC | USA |
|---|---|---|---|
| < 9th Grade | 2.0% | 4.0% | 5.0% |
| 9-12th Grade | 7.0% | 6.0% | 6.0% |
| High School / GED | 31.0% | 25.0% | 26.0% |
| Some College | 18.0% | 20.0% | 19.0% |
| Associate's Degree | 14.0% | 10.0% | 9.0% |
| Bachelor's Degree | 16.0% | 22.0% | 21.0% |
| Master's Degree | 8.0% | 9.0% | 10.0% |
| Professional Degree | 3.0% | 2.0% | 2.0% |
| Doctorate Degree | 1.0% | 2.0% | 2.0% |
Household Income For Shelby, North Carolina
8.4% of households in Shelby earn Less than $10,000.
7.2% of households in Shelby earn $10,000 to $14,999.
10.2% of households in Shelby earn $15,000 to $24,999.
10.0% of households in Shelby earn $25,000 to $34,999.
13.7% of households in Shelby earn $35,000 to $49,999.
18.9% of households in Shelby earn $50,000 to $74,999.
9.3% of households in Shelby earn $75,000 to $99,999.
11.7% of households in Shelby earn $100,000 to $149,999.
4.8% of households in Shelby earn $150,000 to $199,999.
6.0% of households in Shelby earn $200,000 or more.
| Income | Shelby | NC | USA |
|---|---|---|---|
| Less than $10,000 | 8.4% | 5.0% | 4.9% |
| $10,000 to $14,999 | 7.2% | 3.9% | 3.6% |
| $15,000 to $24,999 | 10.2% | 7.6% | 6.6% |
| $25,000 to $34,999 | 10.0% | 7.8% | 6.8% |
| $35,000 to $49,999 | 13.7% | 12.0% | 10.4% |
| $50,000 to $74,999 | 18.9% | 17.0% | 15.7% |
| $75,000 to $99,999 | 9.3% | 13.0% | 12.7% |
| $100,000 to $149,999 | 11.7% | 16.5% | 17.4% |
| $150,000 to $199,999 | 4.8% | 7.8% | 9.3% |
| $200,000 or more | 6.0% | 9.5% | 12.6% |


