Austinvs.Denver Which City Is Right for You in 2026?
A head-to-head guide to cost of living, jobs, transportation, weather, crime, and quality of life — so you can decide where to live, work, or visit.
Updated 2026-05-26 · By HomeSnacks Editorial
Austin vs. Denver at a glance
Choosing between Austin, TX and Denver, CO comes down to which trade-offs you're willing to make. Austin is the capital city of the U.S. state of Texas. With a population of 961,855 at the 2020 census, it is the 12th-most populous city in the U.S., fifth-most populous city in Texas, and second-most populous U.S. Denver is the capital and most populous city of the U.S. state of Colorado.
On cost of living, Austin is the cheaper city: its overall index sits at 124 versus 142 in Denver (100 = national average). Median home values run $508,530 in Austin and $539,666 in Denver, with median rents at $1,729 and $1,831 respectively. That puts the home-value-to-income ratio at 5.4x in Austin versus 5.7x in Denver.
Public safety is another point of divergence. Austin reports 3,709 total crimes per 100,000 residents annually versus 5,755 in Denver. Austin is the more racially diverse of the two on a Herfindahl index basis — Austin skews 47% White while Denver skews 54% White. On HomeSnacks' overall SnackAbility score, Denver edges ahead at 8/10 versus 7/10 for Austin.
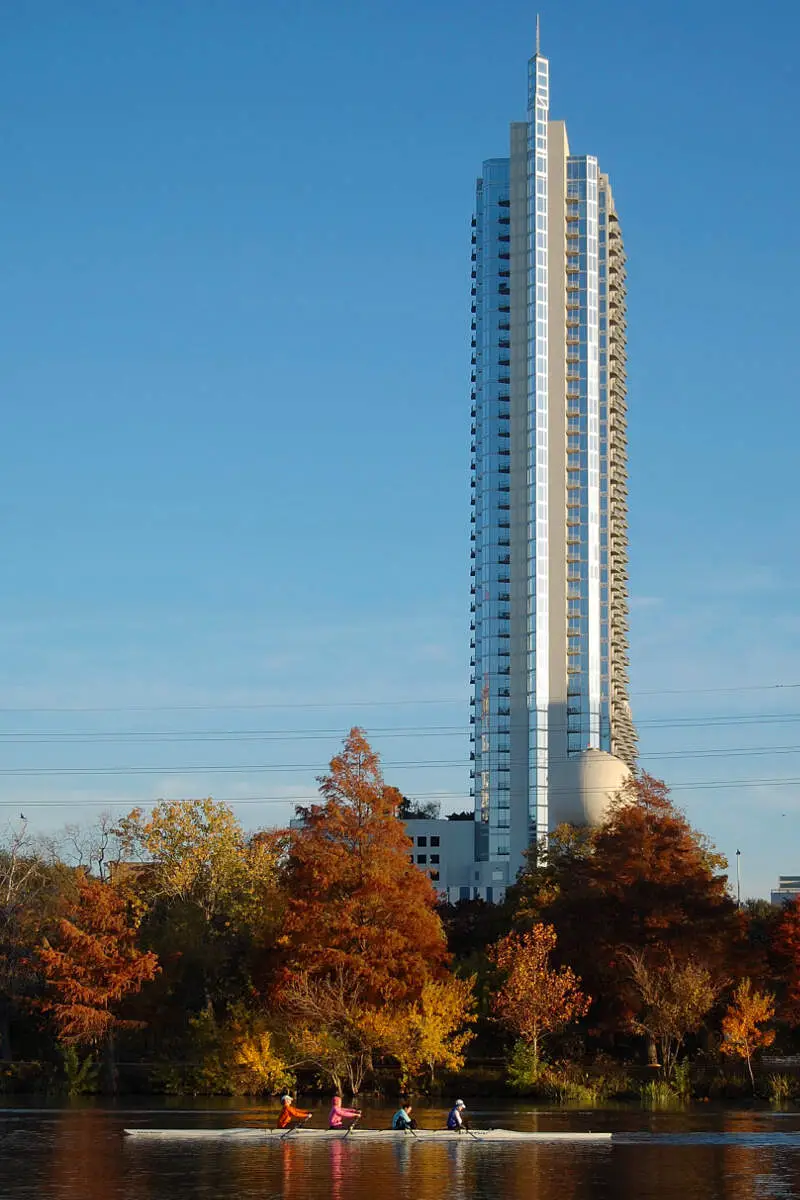
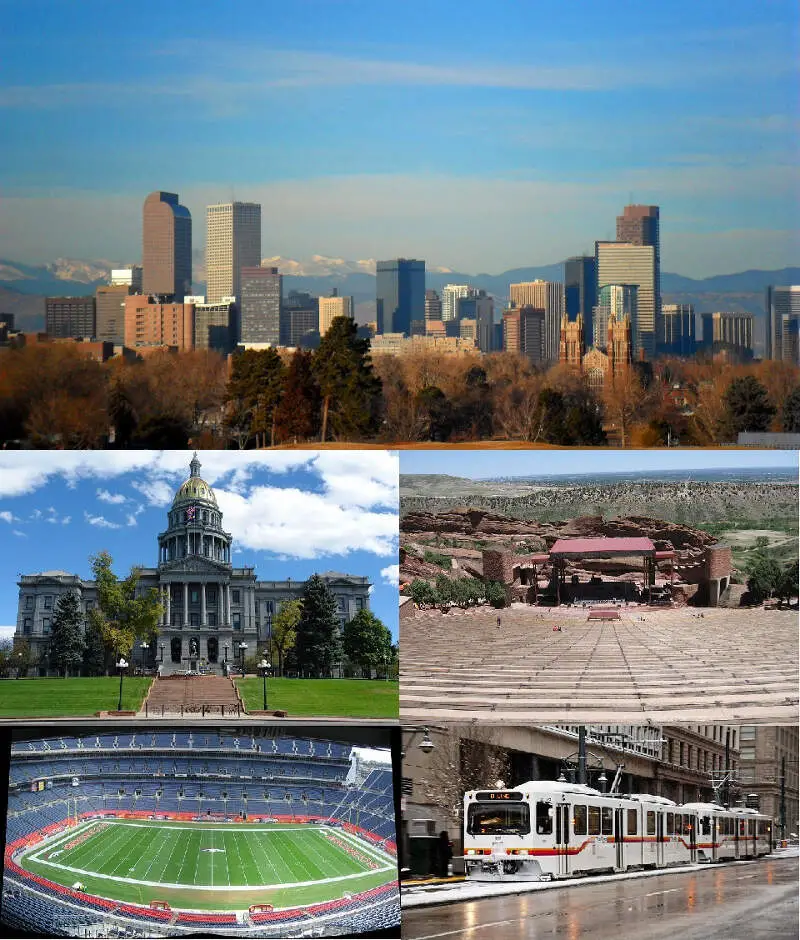
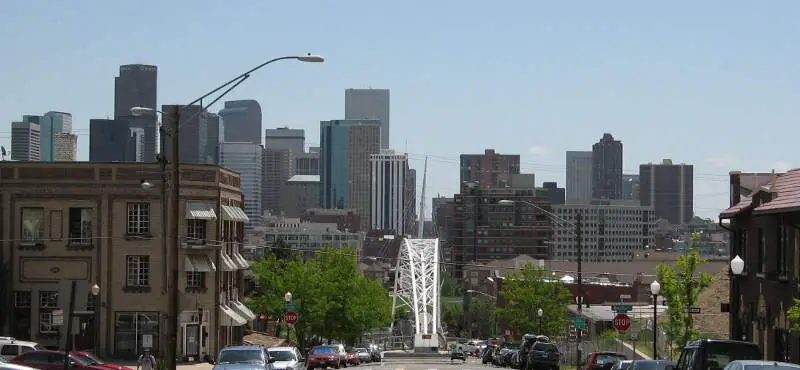
Austin vs. Denver in photos
A side-by-side look at each city.


Cost of living
Austin is the cheaper city overall — 13% higher in Denver than its rival. Index baseline: 100 = national average.
| Living expense | Austin | Denver | US average |
|---|---|---|---|
| Overall | 124 | 142 | 100 |
| Services | 99 | 108 | 100 |
| Groceries | 101 | 107 | 100 |
| Health | 185 | 214 | 100 |
| Housing | 98 | 113 | 100 |
| Transportation | 109 | 110 | 100 |
| Utilities | 104 | 111 | 100 |
Lower index = cheaper. 100 = U.S. national average. Bar inside each cell scales relative to the highest value in the table.
Sources: HomeSnacks Cost of Living indices, normalized so 100 = U.S. national average. Drill in: Austin cost of living, Denver cost of living, or the cheapest cities in America.
Housing breakdown
Home prices are higher in Denver. Compare absolute price and price-to-income — a $500k home in a $100k-income city is very different from one in a $50k-income city.
| Metric | Austin | Denver | United States |
|---|---|---|---|
| Median Home Value | $508,530 | $539,666 | $332,700 |
| Median Rent | $1,729 | $1,831 | $1,413 |
| Median Income | $93,658 | $94,718 | $80,734 |
| Home Value To Income | 5.4x | 5.7x | 4.1x |
| Rent To Monthly Income | 0.22x | 0.23x | 0.21x |
Source: U.S. Census Bureau ACS 2020-2024. See also states with the highest rent in America.
Crime
Austin is the safer city — total crime rate of 3,709 per 100k people vs 5,755 for Denver. US average: 2,119.
| Crime (per 100k) | Austin | Denver | US average |
|---|---|---|---|
| Total crime | 3,709 | 5,755 | 2,119 |
| Murder | 7 | 10 | 5 |
| Robbery | 85 | 176 | 61 |
| Aggravated Assault | 307 | 713 | 256 |
| Violent Crime | 467 | 993 | 359 |
| Burglary | 445 | 708 | 229 |
| Larceny | 2,198 | 2,822 | 1,272 |
| Car Theft | 599 | 1,232 | 259 |
| Property Crime | 3,242 | 4,762 | 1,760 |
Lower = safer. Bar inside each cell scales relative to the highest crime rate in the table.
Source: FBI Uniform Crime Reporting (2024). All rates are per 100,000 people. City pages: Austin crime, Denver crime. See also: safest cities in America.
Diversity
Austin is more racially diverse — lower HHI (closer to 0) means a more even mix across groups.
| Group | Austin | Denver | United States |
|---|---|---|---|
| White | 47.0% | 54.0% | 57.4% |
| African American | 7.3% | 8.6% | 11.9% |
| American Indian | 0.1% | 0.3% | 0.5% |
| Asian | 9.0% | 3.6% | 5.9% |
| Hawaiian | 0.0% | 0.1% | 0.2% |
| Other | 0.5% | 0.5% | 0.6% |
| Two Or More | 4.3% | 4.8% | 4.3% |
| Hispanic | 31.9% | 28.0% | 19.3% |
Source: U.S. Census ACS 2020-2024. Lower HHI = more even racial mix. See also: most diverse cities in America.
SnackAbility — overall quality of life
Denver scores higher overall — 8/10 vs 7/10. SnackAbility is our 1–10 quality-of-life score; the median U.S. city scores a 7.
SnackAbility is a HomeSnacks proprietary 1–10 score blending jobs, housing, education, commute, amenities, affordability, crime, and diversity. Median U.S. city ≈ 7. Data: Census, BLS, FBI. See also: best places to live in America.
Getting around: Austin vs. Denver
How each city handles commuting, transit, walkability, and car culture — the day-to-day reality that shapes where you'd actually want to live.
Austin runs almost entirely on cars. If you commute by car, expect stop-and-go on I-35, MoPac, or Highway 183; the metro has grown past 979,000 residents and the roads show it. Park-and-ride options have improved, but they won't change the situation much.
CapMetro's bus network and the MetroRail Red Line reach some central corridors. Service gaps mean most Austinites drive regardless.
Denver gives you a real alternative with RTD's light rail and commuter rail network radiating out of Union Station in LoDo. The W Line, A Line to the airport, and the growing Southeast corridor put genuine neighborhoods within a train ride of downtown. Denver's urban core is also more walkable and bikeable than Austin's sprawl, and the grid layout makes navigation straightforward.
If reducing car dependence matters to your decision, Denver has a meaningful edge.
Jobs and careers in Austin vs. Denver
The local job market, dominant industries, and which city to choose based on your career.
The median household incomes in these two cities are nearly identical: $93,658 in Austin versus $94,718 in Denver. That makes the job market the real differentiator. Austin has become a major tech hub, with Apple's campus in North Austin, Tesla and SpaceX in the eastern corridor, Oracle's relocated headquarters, Dell's longtime presence in Round Rock, and growing offices from Meta, Google, and Amazon.
State government also anchors steady public-sector employment.
Denver's economy is more diversified. The energy sector, aerospace companies like Lockheed Martin and Raytheon, UCHealth and SCL Health for healthcare workers, and a fast-growing tech scene centered around RiNo and downtown all drive hiring. Federal agencies have a large footprint here too.
If you work in oil-and-gas, defense, or healthcare, Denver's range of employers may actually be more appealing than Austin's heavier tilt toward consumer tech.
Weather and climate
What to expect day-to-day — sun, fog, heat, rain, and the seasonal extremes that shape the lifestyle.
Austin summers are genuinely brutal. Expect more than 90 days above 90°F each year, with stretches past 100°F in July and August. The humidity makes it feel worse.
Winters are mild, with lows rarely dropping below freezing for long. The 2021 ice storm showed how poorly the infrastructure handles rare hard freezes. If you hate cold, Austin wins on calendar days; if you hate relentless heat, it's a harder sell.
Denver sits at 5,280 feet and averages around 300 days of sunshine annually, but don't confuse sunny with warm. Winters bring real snow: Denver proper averages roughly 57 inches a year. Temperatures can swing 40 degrees in a single afternoon, though a January snowstorm can be followed by a 60°F afternoon within two days.
Summers are dry and pleasant, rarely cracking 95°F. Allergy sufferers should know Denver's altitude and grass pollen season can be intense in spring.
Culture, nightlife, and entertainment
Food, music, neighborhoods, and the city vibe that gives each place its personality.
Austin's identity is built on live music, and that's not marketing spin. The Red River Cultural District, Rainey Street, and the 6th Street corridor offer more nights of original live acts than almost any city its size. SXSW and Austin City Limits Music Festival draw international crowds, but the scene works fine outside festival weeks.
Franklin, la Barbecue, and Micklethwait put Austin's BBQ in a class of its own, and the Tex-Mex restaurant density is a real draw. The Keep Austin Weird ethos still shows up in South Congress and East Austin.
Denver's cultural personality centers on craft beer, outdoor lifestyle crossover, and an arts district in RiNo (River North). The Denver Art Museum holds a serious Western and Indigenous art collection. Red Rocks Amphitheatre hosts concerts in one of the most dramatic natural venues in the country.
The Colfax Avenue stretch has dive bars and independent venues. The food scene has matured, with strong Japanese, Mexican, and modern American options across Capitol Hill and LoHi.
Outdoor activities and day trips
Parks, beaches, hikes, and the weekend escapes that define life outside the city limits.
Austin's outdoor life revolves around water. Barton Springs Pool, a natural spring-fed swimming hole in Zilker Park, is an institution. Lady Bird Lake draws kayakers and paddleboarders year-round, and the Barton Creek Greenbelt offers hiking and swimming holes minutes from downtown.
The heat defines the experience: summer outdoor activity shifts heavily toward water and early mornings. Day trips to the Texas Hill Country, Hamilton Pool Preserve, or Enchanted Rock add weekend options within two hours.
Denver's proximity to the Rockies is hard to match. A dozen major ski resorts, including Breckenridge, Vail, Keystone, and Arapahoe Basin, sit within 90 minutes of downtown. Summer opens up world-class hiking in Rocky Mountain National Park, mountain biking on trails above Golden and Evergreen, and fly fishing along the South Platte.
Even in the city, Cherry Creek State Park and Chatfield Reservoir offer quick escapes. If four-season mountain access is part of what you're chasing, Denver is the obvious answer.
Bottom line: which city is right for you?
Based on the head-to-head data above, here's the short version — pick the city that lines up with what you actually care about.
Choose Austin if you prioritize…
- a lower cost of living (cheaper groceries, services, and day-to-day expenses).
- lower crime — a safer place to live, work, and raise a family.
- a more racially diverse community (lower HHI on Census data).
Choose Denver if you prioritize…
- more affordable housing relative to Austin.
- a higher overall SnackAbility quality-of-life score.
Methodology: winners are picked from public data — U.S. Census Bureau ACS (income, home value, rent, race/HHI), FBI Uniform Crime Reporting (crime rates per 100k), and HomeSnacks' proprietary SnackAbility quality-of-life score, which blends Bureau of Labor Statistics data with the above.
More about Texas & Colorado

Best Places To Live In Texas
Photo: Public domain
Cheapest Places To Live In Texas
Photo: Public domain
Most Dangerous Places In Texas
Photo: Public domain
Best Places To Raise A Family In Texas
Photo: Public domain
Best Places To Retire In Texas
Photo: Public domain
Richest Cities In Texas
Photo: Public domain
Safest Places In Texas
Photo: Public domain
Worst Places To Live In Texas
Photo: Public domain