
Before you decide to relocate to New Mexico, it’s important to research the exact cost of living around the state. And that’s what we’re going to help you do.
These are the places in New Mexico that cost a pretty penny — the most expensive cities in the state.
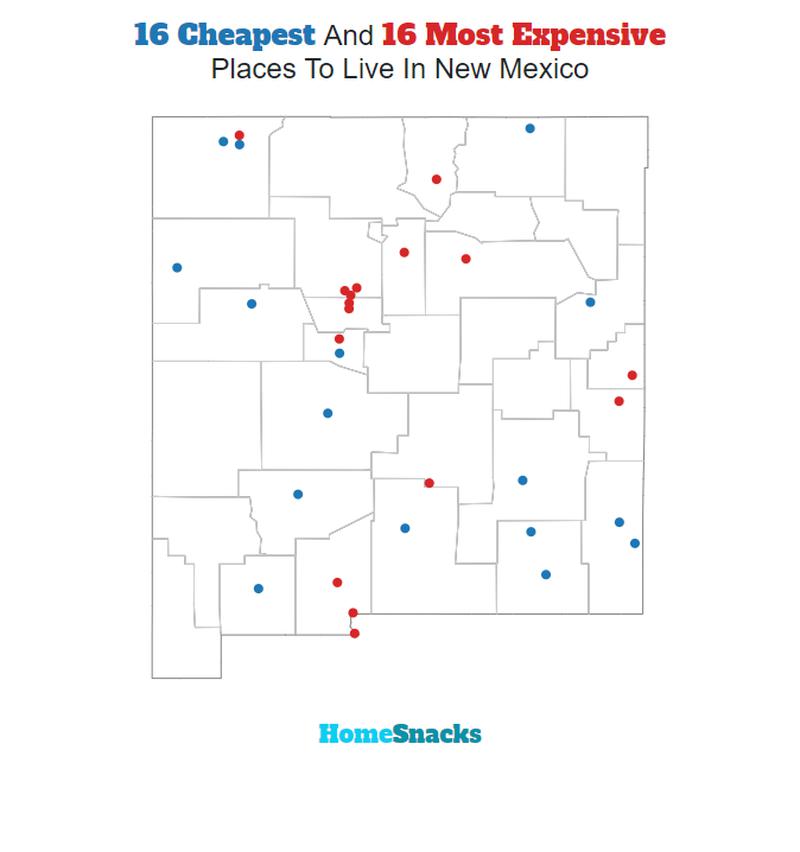
We used Saturday Night Science to compare the 2020-2024 American Community Survey on cost of living for the 34 places in New Mexico with more than 5,000 people.
After we saved up for months and could finally afford it, we landed on this list of the ten most expensive cities in New Mexico for 2026.
Table Of Contents: Top Ten | Methodology | Summary | Table
The 10 Most Expensive Places To Live In New Mexico For 2026
What’s the most expensive place to live in New Mexico? Well, HomeSnacks crunched the numbers and discovered that Corrales is the most expensive place to live in New Mexico.
Tucumcari (the cheapest place to live in New Mexico) can show these guys how to live on a budget in the coming years. Read on for how these places had costs rise faster than inflation.
And if you already knew these places were expensive, check out some more reading about New Mexico and the most expensive cities in the country:
The 10 Most Expensive Places To Live In New Mexico For 2026

/10
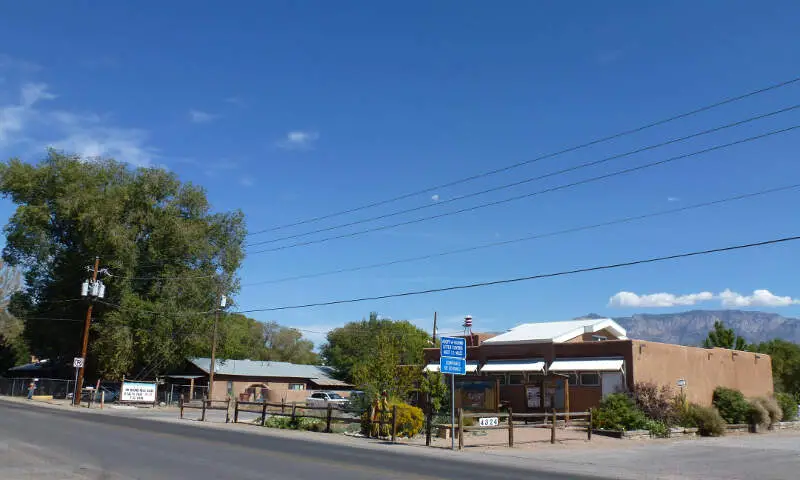
Population: 8,555
Cost Of Living Index: 131
Median Income: $102,307
Average Home Price: $703,888
Home Price To Income Ratio: 6.9x
More on Corrales: Data | Crime | Cost Of Living | Movers
The overall cost of living in Corrales is 131. The median income in Corrales comes in at $102,307 and the average home value is $703,888 for 2026.

/10
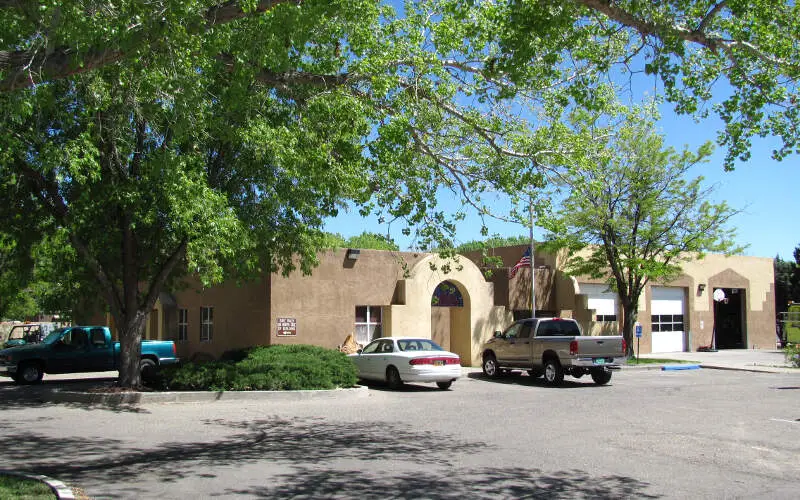
Population: 5,857
Cost Of Living Index: 127
Median Income: $72,992
Average Home Price: $705,207
Home Price To Income Ratio: 9.7x
More on Los Ranchos De Albuquerque: Data | Cost Of Living | Movers
The overall cost of living in Los Ranchos De Albuquerque is 127. The median income in Los Ranchos De Albuquerque comes in at $72,992 and the average home value is $705,207 for 2026.

/10
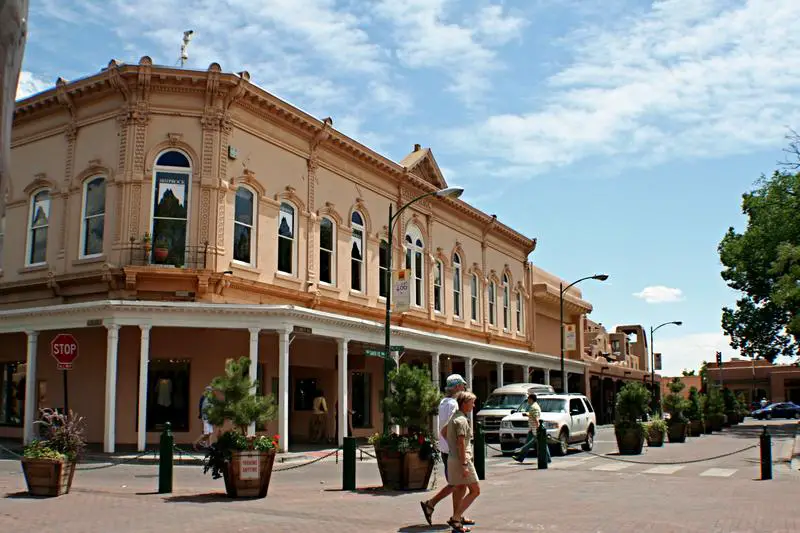
Population: 89,019
Cost Of Living Index: 113
Median Income: $73,482
Average Home Price: $580,021
Home Price To Income Ratio: 7.9x
More on Santa Fe: Data | Cost Of Living | Movers
The overall cost of living in Santa Fe is 113. The median income in Santa Fe comes in at $73,482 and the average home value is $580,021 for 2026.

/10
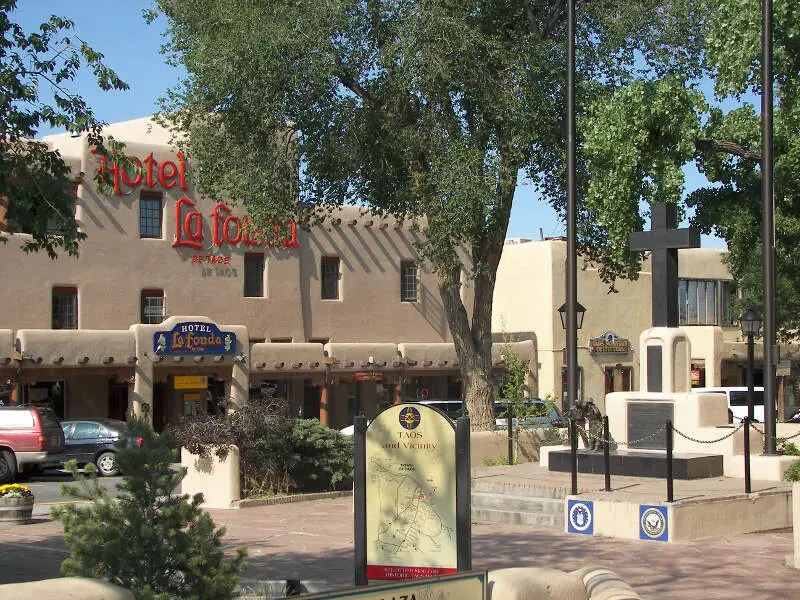
Population: 6,458
Cost Of Living Index: 107
Median Income: $47,304
Average Home Price: $439,303
Home Price To Income Ratio: 9.3x
More on Taos: Data | Crime | Cost Of Living | Movers
The overall cost of living in Taos is 107. The median income in Taos comes in at $47,304 and the average home value is $439,303 for 2026.
/10
Population: 6,124
Cost Of Living Index: 103
Median Income: $84,761
Average Home Price: $382,908
Home Price To Income Ratio: 4.5x
More on Edgewood: Data | Crime | Cost Of Living | Movers
The overall cost of living in Edgewood is 103. The median income in Edgewood comes in at $84,761 and the average home value is $382,908 for 2026.

/10
Population: 562,218
Cost Of Living Index: 102
Median Income: $68,317
Average Home Price: $344,457
Home Price To Income Ratio: 5.0x
More on Albuquerque: Data | Crime | Cost Of Living | Movers
The overall cost of living in Albuquerque is 102. The median income in Albuquerque comes in at $68,317 and the average home value is $344,457 for 2026.

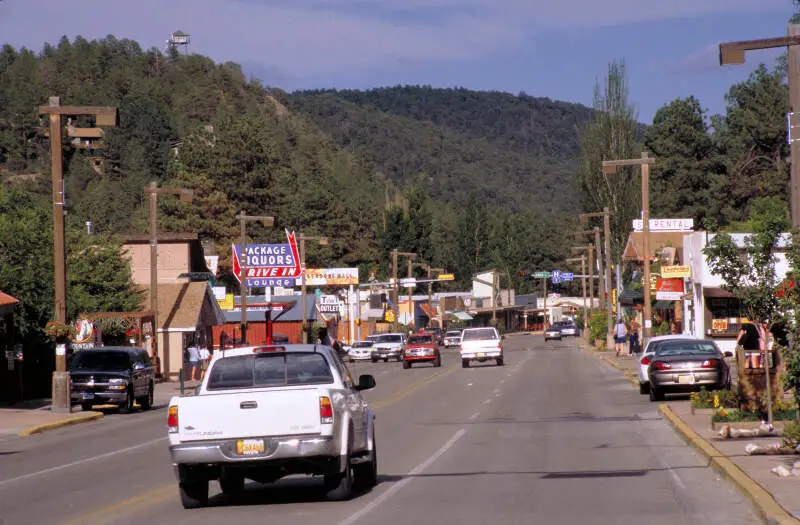
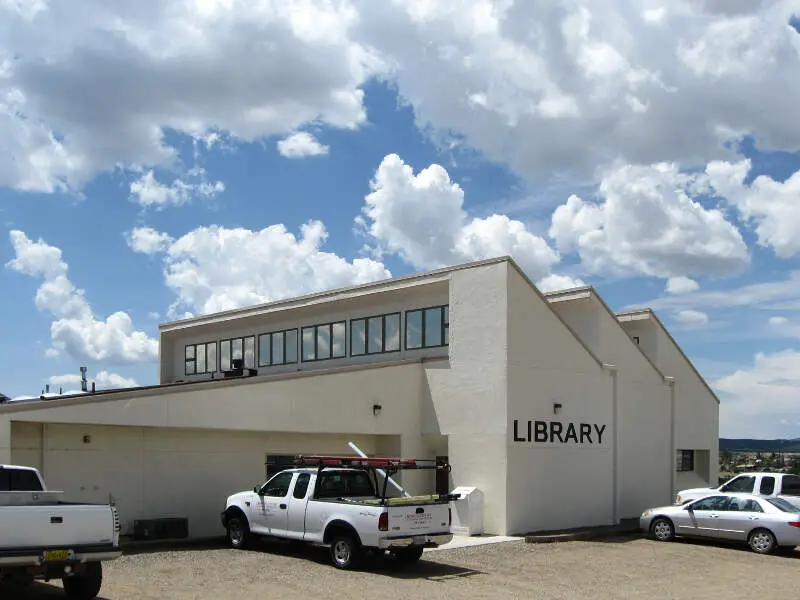
/10
Population: 7,699
Cost Of Living Index: 101
Median Income: $52,736
Average Home Price: $332,549
Home Price To Income Ratio: 6.3x
More on Ruidoso: Data | Crime | Cost Of Living | Movers
The overall cost of living in Ruidoso is 101. The median income in Ruidoso comes in at $52,736 and the average home value is $332,549 for 2026.


/10
Population: 108,515
Cost Of Living Index: 100
Median Income: $89,596
Average Home Price: $361,856
Home Price To Income Ratio: 4.0x
More on Rio Rancho: Data | Crime | Cost Of Living | Movers
The overall cost of living in Rio Rancho is 100. The median income in Rio Rancho comes in at $89,596 and the average home value is $361,856 for 2026.

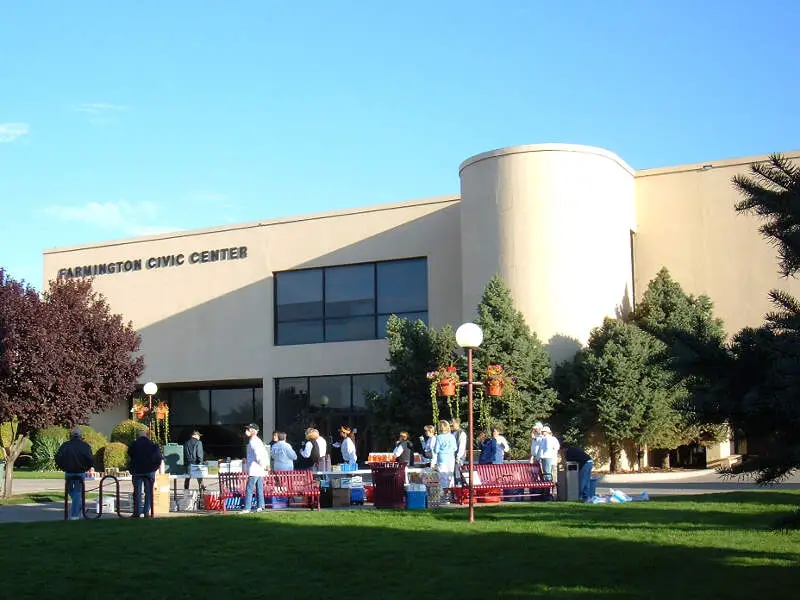
/10
Population: 46,314
Cost Of Living Index: 99
Median Income: $68,784
Average Home Price: $276,499
Home Price To Income Ratio: 4.0x
More on Farmington: Data | Crime | Cost Of Living | Movers
The overall cost of living in Farmington is 99. The median income in Farmington comes in at $68,784 and the average home value is $276,499 for 2026.

/10
Population: 18,618
Cost Of Living Index: 99
Median Income: $62,330
Average Home Price: $324,073
Home Price To Income Ratio: 5.2x
More on Los Lunas: Data | Crime | Cost Of Living | Movers
The overall cost of living in Los Lunas is 99. The median income in Los Lunas comes in at $62,330 and the average home value is $324,073 for 2026.
Methodology: How We Determined The Most Expensive Places To Live In The Land of Enchantment For 2026
The two most important things to think about when it comes to being able to afford a city in New Mexico are:
- How much money do I make?
- How much do I have to spend to live there?
You need to understand your costs in the context of how much money you make.
For example, if the median household earns $100,000 and spends $40,000 on housing, it’s actually cheaper to live there than a place with a median income of $50,000 and housing costs of $21,000. You might spend more on housing, but you have more money overall to play with.
With that example in mind, we derived several statistics from the latest Census American Community Survey 2020-2024 around incomes and costs. They are:
- Overall Cost Of Living Index
- Median Home Price / Median Income (lower is better)
- Median Income / Median Rent (Higher is better)
- Median Home Price
You can then compare these metrics in each of the places in New Mexico to figure out which is the most expensive.
You are left with a “Cost of Living Index” by taking the average rank of each of these metrics for each city.
So we used that cost of living index to rank all of the 34 places in New Mexico that have more than 5,000 people.
The place with the highest cost of living in New Mexico according to the data is Corrales. We updated this article for 2026. This article is our eleventh time ranking the most expensive places to live in New Mexico.
Summary: Taking A Chunk Out Of Your Paycheck In New Mexico For 2026
Well, there you have it, the places in New Mexico that have the highest cost of living, with Corrales ranking as the most expensive city in the Land of Enchantment.
The most expensive cities in New Mexico are Corrales, Los Ranchos de Albuquerque, Santa Fe, Taos, Edgewood, Albuquerque, Ruidoso, Rio Rancho, Farmington, and Los Lunas.
Here’s a look at the most affordable cities in New Mexico according to the data:
- Tucumcari
- Truth or Consequences
- Deming
For more New Mexico reading, check out:
- Best Places To Live In New Mexico
- Cheapest Places To Live In New Mexico
- Most Dangerous Cities In New Mexico
- Best Places To Raise A Family In New Mexico
- Safest Places In New Mexico
- Worst Places To Live In New Mexico
Most Expensive Cities In New Mexico
| Rank | City | Cost Of Living | Population | Median Income | Average Home Price | Home/Income Ratio |
|---|---|---|---|---|---|---|
| 1 | Corrales | 131 | 8,555 | $102,307 | $703,888 | 6.9x |
| 2 | Los Ranchos de Albuquerque | 127 | 5,857 | $72,992 | $705,207 | 9.7x |
| 3 | Santa Fe | 113 | 89,019 | $73,482 | $580,021 | 7.9x |
| 4 | Taos | 107 | 6,458 | $47,304 | $439,303 | 9.3x |
| 5 | Edgewood | 103 | 6,124 | $84,761 | $382,908 | 4.5x |
| 6 | Albuquerque | 102 | 562,218 | $68,317 | $344,457 | 5.0x |
| 7 | Ruidoso | 101 | 7,699 | $52,736 | $332,549 | 6.3x |
| 8 | Rio Rancho | 100 | 108,515 | $89,596 | $361,856 | 4.0x |
| 9 | Farmington | 99 | 46,314 | $68,784 | $276,499 | 4.0x |
| 10 | Los Lunas | 99 | 18,618 | $62,330 | $324,073 | 5.2x |
| 11 | Carlsbad | 98 | 31,746 | $72,306 | $251,561 | 3.5x |
| 12 | Artesia | 98 | 12,576 | $74,915 | $245,539 | 3.3x |
| 13 | Bernalillo | 96 | 9,086 | $63,880 | $347,986 | 5.4x |
| 14 | Aztec | 95 | 6,150 | $41,977 | $274,928 | 6.5x |
| 15 | Las Cruces | 93 | 114,197 | $55,422 | $290,022 | 5.2x |
| 16 | Sunland Park | 93 | 17,463 | $62,814 | $223,741 | 3.6x |
| 17 | Raton | 93 | 6,026 | $52,641 | $152,896 | 2.9x |
| 18 | Clovis | 92 | 37,942 | $54,820 | $161,214 | 2.9x |
| 19 | Silver City | 92 | 9,536 | $38,711 | $225,704 | 5.8x |
| 20 | Hobbs | 91 | 40,252 | $64,021 | $207,135 | 3.2x |
| 21 | Alamogordo | 91 | 31,307 | $55,952 | $223,172 | 4.0x |
| 22 | Socorro | 91 | 8,481 | $39,375 | $190,942 | 4.8x |
| 23 | Bloomfield | 91 | 7,395 | $48,472 | $252,907 | 5.2x |
| 24 | Roswell | 90 | 47,638 | $51,583 | $173,066 | 3.4x |
| 25 | Gallup | 90 | 21,023 | $58,303 | $219,327 | 3.8x |
| 26 | Lovington | 90 | 11,498 | $68,821 | $174,978 | 2.5x |
| 27 | Las Vegas | 88 | 13,000 | $45,125 | $241,426 | 5.4x |
| 28 | Portales | 88 | 11,968 | $50,555 | $134,843 | 2.7x |
| 29 | Anthony | 87 | 8,767 | $38,132 | $235,805 | 6.2x |
| 30 | Belen | 87 | 7,450 | $42,627 | $266,791 | 6.3x |
| 31 | Grants | 85 | 8,951 | $47,183 | $154,827 | 3.3x |
| 32 | Deming | 84 | 15,221 | $34,165 | $163,668 | 4.8x |
| 33 | Truth or Consequences | 83 | 6,019 | $33,788 | $152,062 | 4.5x |
| 34 | Tucumcari | 81 | 5,160 | $31,844 | $83,368 | 2.6x |