Compare Tampa to…
Tampa SnackAbility
Overall SnackAbility
Crime in Tampa summary. We use data from the FBI to determine the crime rates in Tampa. Key points include:
There were 7,805 total crimes in Tampa in the last reporting year.
The overall crime rate per 100,000 people in Tampa is 1,910.0 / 100k people.
The violent crime rate per 100,000 people in Tampa is 444.6 / 100k people.
The property crime rate per 100,000 people in Tampa is 1,465.3 / 100k people.
Overall, crime in Tampa is -9.87% below the national average.
Total Crimes
Below National Average
Crime In Tampa Comparison Table
| Statistic | Count Raw |
Tampa / 100k People |
Florida / 100k People |
National / 100k People |
|---|---|---|---|---|
| Total Crimes Per 100K | 7,805 | 1,910.0 | 1,687.5 | 2,119.2 |
| Violent Crime | 1,817 | 444.6 | 267.1 | 359.0 |
| Murder | 36 | 8.8 | 3.9 | 5.0 |
| Robbery | 241 | 59.0 | 38.2 | 61.0 |
| Aggravated Assault | 1,369 | 335.0 | 197.1 | 256.0 |
| Property Crime | 5,988 | 1,465.3 | 1,420.4 | 1,760.0 |
| Burglary | 684 | 167.4 | 152.5 | 229.0 |
| Larceny | 4,718 | 1,154.5 | 1,144.9 | 1,272.0 |
| Car Theft | 586 | 143.4 | 123.0 | 259.0 |
Source: FBI Uniform Crime Reporting (2024)
Cost of living in Tampa summary. We use data on the cost of living to determine how expensive it is to live in Tampa. Real estate prices drive most of the variance in cost of living around Florida. Key points include:
The cost of living in Tampa is 116 with 100 being average.
The cost of living in Tampa is 1.2x higher than the national average.
The median home value in Tampa is $374,888.
The median income in Tampa is $75,475.
Tampa's Overall Cost Of Living
Higher Than The National Average
Cost Of Living In Tampa Comparison Table
| Living Expense | Tampa | Florida | National Average |
|---|---|---|---|
| Overall | 116 | 104 | 100 |
| Services | 107 | 101 | 100 |
| Groceries | 105 | 105 | 100 |
| Health | 134 | 99 | 100 |
| Housing | 105 | 104 | 100 |
| Transportation | 113 | 109 | 100 |
| Utilities | 104 | 105 | 100 |
Source: Cost of living index, normalized to US average = 100
Tampa, FL Weather
The average high in Tampa is 82.0° and the average low is 63.6°.
There are 67.2 days of precipitation each year.
Expect an average of 49.6 inches of precipitation each year with 0.0 inches of snow.
| Stat | Tampa |
|---|---|
| Average Annual High | 82.0 |
| Average Annual Low | 63.6 |
| Annual Precipitation Days | 67.2 |
| Average Annual Precipitation | 49.6 |
| Average Annual Snowfall | 0.0 |
Average High
Days of Rain
Source: NOAA climate normals (30-year)
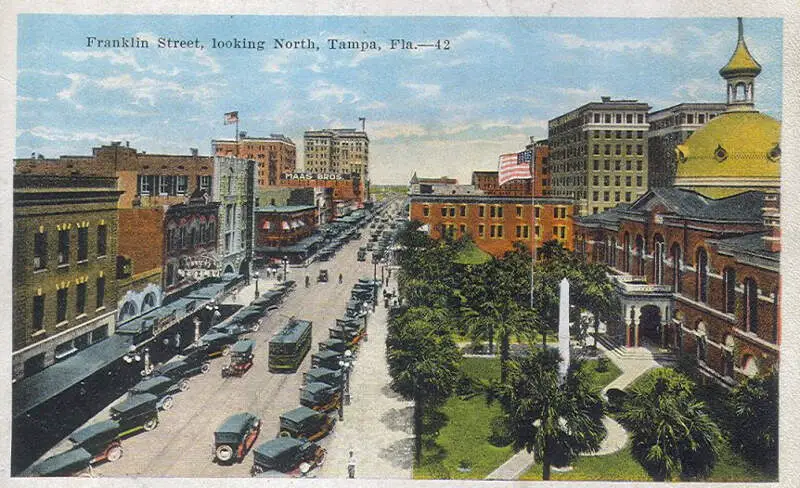
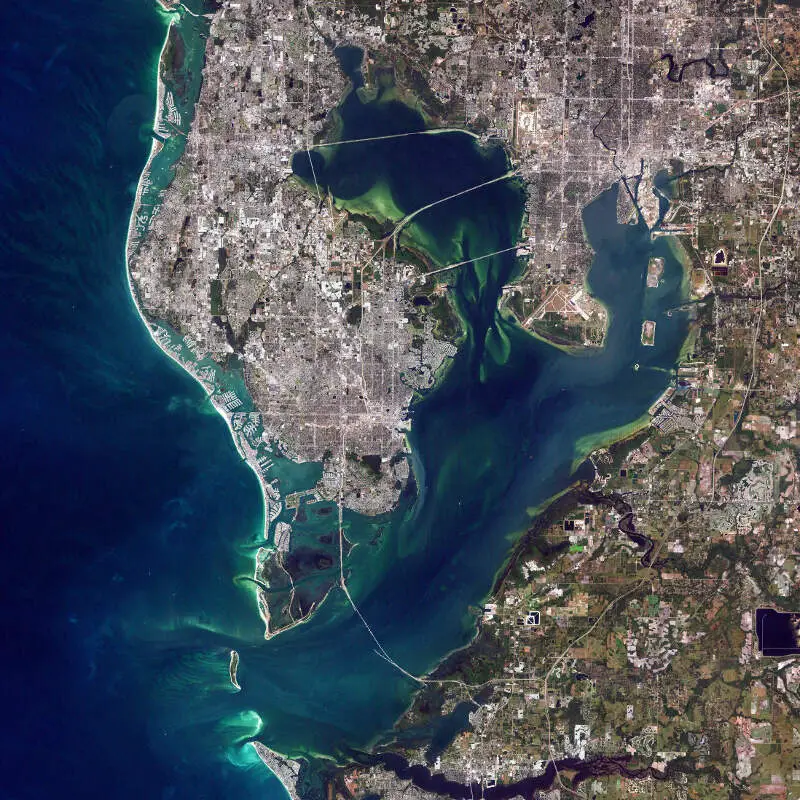
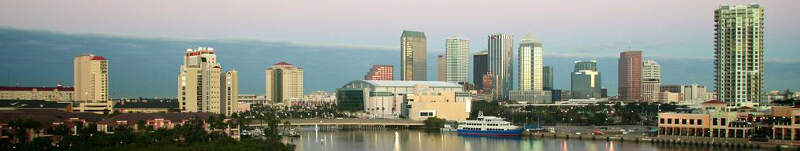
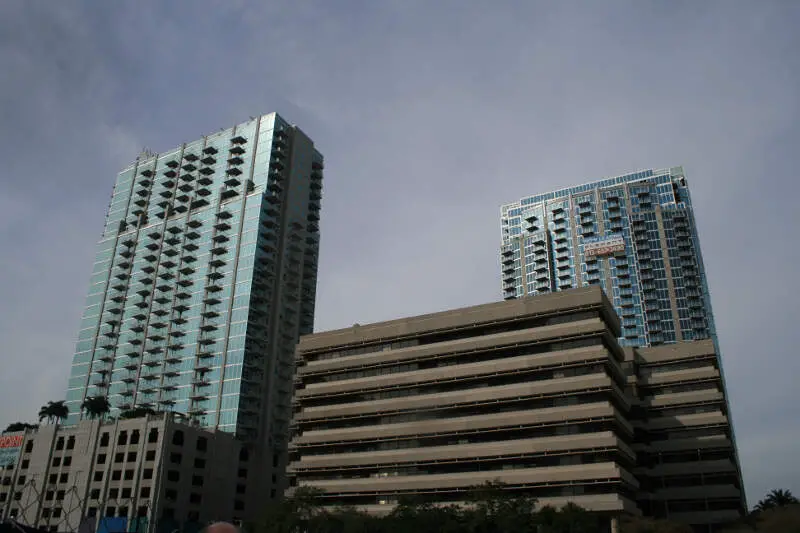
Tampa, FL Photos


4 Reviews & Comments About Tampa

the area i live in is very safe and secure, the schools are highly rated.
the place i lived in is very safe, the neighbors are good.
There were plenty of things to do in Tampa, but there definitely was also a lot of crime; everything from credit card theft at the gas pump to retail theft. The drivers in Florida are also terrible! There are constantly car accidents happening in Florida and because of this the car insurance is of course higher than other states. Kids also get their licenses at 16 and drive very irresponsibly and I was actually a victim of an 18-year-old's negligence while driving. I now have life-altering injuries because of it.
One of our favorite places to go in Tampa, before the accident, was Top Golf; it was lots of fun and it was right around the corner from where we lived. My girlfriend and I also enjoyed going out to eat at the Golden Corral or Longhorn Steakhouse; which were also very close to our home. We did have a lot of things close to where we lived, but a lot of other things, like the beach, were quite far away unfortunately.
It all went amazing there, weather is a little hot for me but there are many activities to do, and you can bring the whole family
My favorite place was busch gardens!! Best rollercoaster is Sheikra!! Seriously that's a experience that everyone needs
My parents live in Florida so its nice to visit with them when I get the chance. My mom and my stepfather live in Tampa while, my dad and stepmom live in Bonita Springs. My mother hates it that her kids and grandchildren live so far away but, my mother and stepdad would not live here. My mom's house is five minutes away from the airport so it is an easy pickup. Their condo has a lot of wildlife surrounding it. We have seen alligators, birds, monkeys, and domestic animals up close. It is nice to visit especially going to see the amusement parks. On the other hand, there have been two times where I have gotten sick but, I think it was something I ate.
I think there are a couple of things that stand out. They have numerous parades that throw out different types of beads. The Tampa Zoo is big on Christmas decorations and they always dress it up with different colored lights so that is something I like to see. My two year old daughter has never visited but, they have tons of children's events for her age. We are going to Florida this December so it will an experience for her. On the other hand, there is lots of wildlife which is a good thing to see but, can become dangerous if not handled properly.
Rankings & Articles For Tampa


Locations Around Tampa
Map Of Tampa, FL
Best Places Around Tampa
Safety Harbor, FL
Population 17,033
Carrollwood, FL
Population 36,725
Pinellas Park, FL
Population 53,560
Bloomingdale, FL
Population 23,827
Palm Harbor, FL
Population 61,512
Valrico, FL
Population 40,239
Northdale, FL
Population 25,710
Trinity, FL
Population 18,907
Citrus Park, FL
Population 28,804
Lutz, FL
Population 27,106
Tampa Demographics And Statistics
Population over time in Tampa
The current population in Tampa is 401,618. The population has increased 20.5% from 2010.
| Year | Population | % Change |
|---|---|---|
| 2024 | 401,618 | 2.1% |
| 2023 | 393,389 | 1.2% |
| 2022 | 388,768 | 2.2% |
| 2021 | 380,476 | -3.9% |
| 2020 | 395,912 | 2.1% |
| 2019 | 387,916 | 3.1% |
| 2018 | 376,345 | 2.2% |
| 2017 | 368,087 | 1.8% |
| 2016 | 361,477 | 1.7% |
| 2015 | 355,603 | 1.9% |
| 2014 | 348,934 | 1.5% |
| 2013 | 343,768 | 1.3% |
| 2012 | 339,391 | 1.0% |
| 2011 | 336,171 | 0.9% |
| 2010 | 333,327 | - |
Race / Ethnicity in Tampa
See the full breakdown
Tampa is:
44.3% White with 178,047 White residents.
19.5% African American with 78,182 African American residents.
0.1% American Indian with 243 American Indian residents.
4.7% Asian with 18,938 Asian residents.
0.1% Hawaiian with 497 Hawaiian residents.
0.7% Other with 2,775 Other residents.
4.4% Two Or More with 17,666 Two Or More residents.
26.2% Hispanic with 105,270 Hispanic residents.
| Race | Tampa | FL | USA |
|---|---|---|---|
| White | 44.3% | 50.4% | 57.4% |
| African American | 19.5% | 14.6% | 11.9% |
| American Indian | 0.1% | 0.1% | 0.5% |
| Asian | 4.7% | 2.9% | 5.9% |
| Hawaiian | 0.1% | 0.1% | 0.2% |
| Other | 0.7% | 0.7% | 0.6% |
| Two Or More | 4.4% | 3.8% | 4.3% |
| Hispanic | 26.2% | 27.4% | 19.3% |
Gender in Tampa
See the full breakdown
Tampa is 49.8% female with 200,043 female residents.
Tampa is 50.2% male with 201,575 male residents.
| Gender | Tampa | FL | USA |
|---|---|---|---|
| Female | 49.8% | 50.9% | 50.5% |
| Male | 50.2% | 49.1% | 49.5% |
Highest level of educational attainment in Tampa for adults over 25
See the full breakdown
5.0% of adults in Tampa completed < 9th grade.
6.0% of adults in Tampa completed 9-12th grade.
22.0% of adults in Tampa completed high school / ged.
14.0% of adults in Tampa completed some college.
8.0% of adults in Tampa completed associate's degree.
27.0% of adults in Tampa completed bachelor's degree.
12.0% of adults in Tampa completed master's degree.
4.0% of adults in Tampa completed professional degree.
2.0% of adults in Tampa completed doctorate degree.
| Education | Tampa | FL | USA |
|---|---|---|---|
| < 9th Grade | 5.0% | 5.0% | 4.0% |
| 9-12th Grade | 6.0% | 6.0% | 6.0% |
| High School / GED | 22.0% | 27.0% | 26.0% |
| Some College | 14.0% | 19.0% | 19.0% |
| Associate's Degree | 8.0% | 10.0% | 9.0% |
| Bachelor's Degree | 27.0% | 21.0% | 22.0% |
| Master's Degree | 12.0% | 9.0% | 10.0% |
| Professional Degree | 4.0% | 2.0% | 2.0% |
| Doctorate Degree | 2.0% | 1.0% | 2.0% |
Household Income For Tampa, Florida
See the full breakdown
6.8% of households in Tampa earn Less than $10,000.
4.0% of households in Tampa earn $10,000 to $14,999.
7.1% of households in Tampa earn $15,000 to $24,999.
6.7% of households in Tampa earn $25,000 to $34,999.
10.4% of households in Tampa earn $35,000 to $49,999.
14.9% of households in Tampa earn $50,000 to $74,999.
10.9% of households in Tampa earn $75,000 to $99,999.
14.9% of households in Tampa earn $100,000 to $149,999.
9.0% of households in Tampa earn $150,000 to $199,999.
15.5% of households in Tampa earn $200,000 or more.
| Income | Tampa | FL | USA |
|---|---|---|---|
| Less than $10,000 | 6.8% | 5.1% | 5.0% |
| $10,000 to $14,999 | 4.0% | 3.3% | 3.4% |
| $15,000 to $24,999 | 7.1% | 6.6% | 6.3% |
| $25,000 to $34,999 | 6.7% | 7.3% | 6.6% |
| $35,000 to $49,999 | 10.4% | 11.1% | 10.1% |
| $50,000 to $74,999 | 14.9% | 16.8% | 15.5% |
| $75,000 to $99,999 | 10.9% | 13.1% | 12.6% |
| $100,000 to $149,999 | 14.9% | 17.2% | 17.5% |
| $150,000 to $199,999 | 9.0% | 8.4% | 9.6% |
| $200,000 or more | 15.5% | 11.0% | 13.4% |
Source: U.S. Census ACS 5-year estimates (2024)


