Boise City, ID
Demographics And Statistics
Living In Boise City, Idaho Summary
Life in Boise City research summary. HomeSnacks has been using Saturday Night Science to research the quality of life in Boise City over the past nine years using Census, FBI, Zillow, and other primary data sources. Based on the most recently available data, we found the following about life in Boise City:
The population in Boise City is 235,701.
The median home value in Boise City is $490,432.
The median income in Boise City is $81,308.
The median rent in Boise City is $1,359.
The unemployment rate in Boise City is 3.8%.
The poverty rate in Boise City is 10.6%.
The average high in Boise City is 63.7° and the average low is 38.4°.
Table Of Contents
Boise City SnackAbility
Overall SnackAbility
Boise City, ID Weather
The average high in Boise City is 63.7° and the average low is 38.4°.
There are 38.9 days of precipitation each year.
Expect an average of 11.9 inches of precipitation each year with 30.6 inches of snow.
| Stat | Boise City |
|---|---|
| Average Annual High | 63.7 |
| Average Annual Low | 38.4 |
| Annual Precipitation Days | 38.9 |
| Average Annual Precipitation | 11.9 |
| Average Annual Snowfall | 30.6 |
Average High
Days of Rain
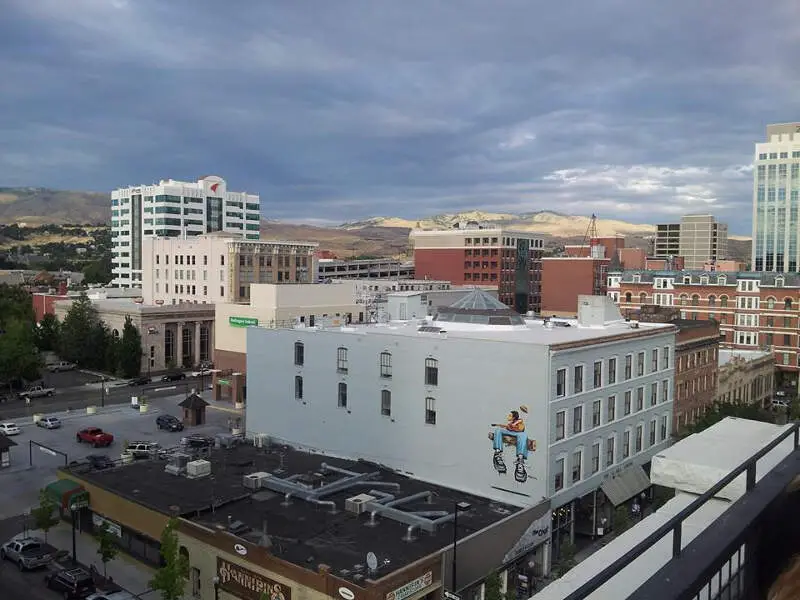
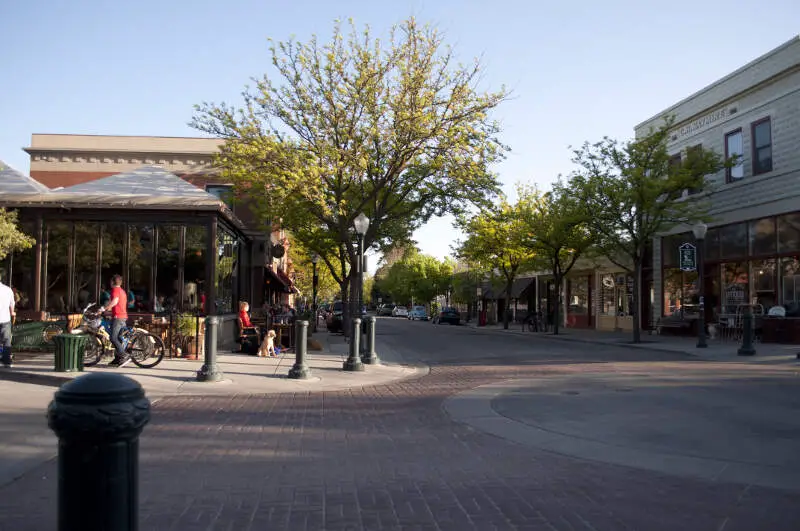
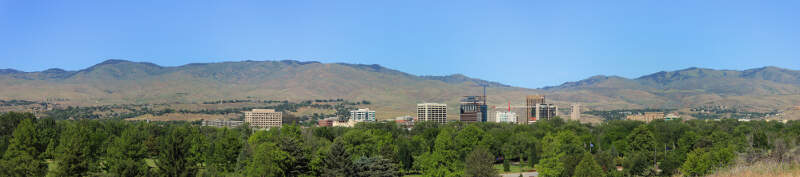
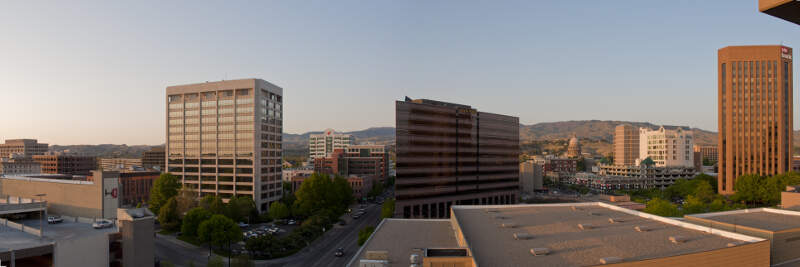
Boise City, ID Photos


Rankings for Boise City in Idaho


Locations Around Boise City
Map Of Boise City, ID
Best Places Around Boise City
Boise City Demographics And Statistics
Population over time in Boise City
The current population in Boise City is 235,701. The population has increased 14.2% from 2010.
| Year | Population | % Change |
|---|---|---|
| 2023 | 235,701 | 0.6% |
| 2022 | 234,192 | 1.1% |
| 2021 | 231,537 | 1.5% |
| 2020 | 228,057 | 0.9% |
| 2019 | 226,115 | 0.8% |
| 2018 | 224,300 | 1.6% |
| 2017 | 220,859 | 1.0% |
| 2016 | 218,677 | 2.1% |
| 2015 | 214,196 | 1.2% |
| 2014 | 211,655 | 0.9% |
| 2013 | 209,726 | 0.7% |
| 2012 | 208,332 | 0.4% |
| 2011 | 207,560 | 0.5% |
| 2010 | 206,481 | - |
Race / Ethnicity in Boise City
Boise City is:
80.4% White with 189,589 White residents.
1.3% African American with 3,072 African American residents.
0.3% American Indian with 730 American Indian residents.
3.3% Asian with 7,867 Asian residents.
0.3% Hawaiian with 600 Hawaiian residents.
0.5% Other with 1,114 Other residents.
4.4% Two Or More with 10,257 Two Or More residents.
9.5% Hispanic with 22,472 Hispanic residents.
| Race | Boise City | ID | USA |
|---|---|---|---|
| White | 80.4% | 79.3% | 58.2% |
| African American | 1.3% | 0.7% | 12.0% |
| American Indian | 0.3% | 0.8% | 0.5% |
| Asian | 3.3% | 1.3% | 5.7% |
| Hawaiian | 0.3% | 0.1% | 0.2% |
| Other | 0.5% | 0.5% | 0.5% |
| Two Or More | 4.4% | 3.9% | 3.9% |
| Hispanic | 9.5% | 13.3% | 19.0% |
Gender in Boise City
Boise City is 49.8% female with 117,407 female residents.
Boise City is 50.2% male with 118,294 male residents.
| Gender | Boise City | ID | USA |
|---|---|---|---|
| Female | 49.8% | 49.7% | 50.5% |
| Male | 50.2% | 50.3% | 49.5% |
Highest level of educational attainment in Boise City for adults over 25
3.0% of adults in Boise City completed < 9th grade.
3.0% of adults in Boise City completed 9-12th grade.
19.0% of adults in Boise City completed high school / ged.
22.0% of adults in Boise City completed some college.
7.0% of adults in Boise City completed associate's degree.
29.0% of adults in Boise City completed bachelor's degree.
12.0% of adults in Boise City completed master's degree.
3.0% of adults in Boise City completed professional degree.
2.0% of adults in Boise City completed doctorate degree.
| Education | Boise City | ID | USA |
|---|---|---|---|
| < 9th Grade | 3.0% | 3.0% | 5.0% |
| 9-12th Grade | 3.0% | 5.0% | 6.0% |
| High School / GED | 19.0% | 26.0% | 26.0% |
| Some College | 22.0% | 25.0% | 19.0% |
| Associate's Degree | 7.0% | 10.0% | 9.0% |
| Bachelor's Degree | 29.0% | 21.0% | 21.0% |
| Master's Degree | 12.0% | 7.0% | 10.0% |
| Professional Degree | 3.0% | 2.0% | 2.0% |
| Doctorate Degree | 2.0% | 1.0% | 2.0% |
Household Income For Boise City, Idaho
3.1% of households in Boise City earn Less than $10,000.
2.6% of households in Boise City earn $10,000 to $14,999.
6.0% of households in Boise City earn $15,000 to $24,999.
6.3% of households in Boise City earn $25,000 to $34,999.
11.2% of households in Boise City earn $35,000 to $49,999.
16.6% of households in Boise City earn $50,000 to $74,999.
15.1% of households in Boise City earn $75,000 to $99,999.
17.4% of households in Boise City earn $100,000 to $149,999.
10.0% of households in Boise City earn $150,000 to $199,999.
11.6% of households in Boise City earn $200,000 or more.
| Income | Boise City | ID | USA |
|---|---|---|---|
| Less than $10,000 | 3.1% | 3.5% | 4.9% |
| $10,000 to $14,999 | 2.6% | 2.9% | 3.6% |
| $15,000 to $24,999 | 6.0% | 6.6% | 6.6% |
| $25,000 to $34,999 | 6.3% | 7.1% | 6.8% |
| $35,000 to $49,999 | 11.2% | 11.4% | 10.4% |
| $50,000 to $74,999 | 16.6% | 18.6% | 15.7% |
| $75,000 to $99,999 | 15.1% | 15.0% | 12.7% |
| $100,000 to $149,999 | 17.4% | 18.3% | 17.4% |
| $150,000 to $199,999 | 10.0% | 8.0% | 9.3% |
| $200,000 or more | 11.6% | 8.4% | 12.6% |


