
Racial diversity in Illinois is a mixed bag.
There are parts of Illinois where there’s a high level of diversity. But where will you find the most diverse places in Illinois?
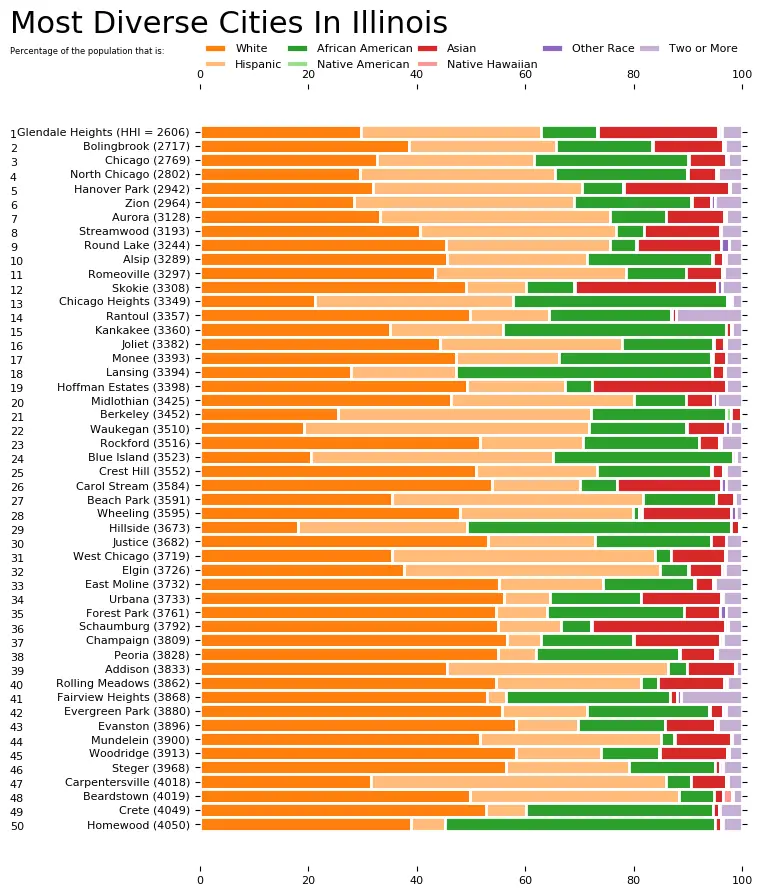
To answer that question, we went to the US Census data. Using Saturday Night Science, we measured the Gini coefficient for all 330 cities in Illinois to rank them from most to least diverse.
Table Of Contents: Top Ten | Methodology | Summary | Table
Here are the 10 most diverse places in Illinois for 2026:
So what city is the most diverse in Illinois? According to the most Census data, Bolingbrook took the number one over all spot for diversity in Illinois.
Read on below to see how we crunched the numbers and how your town ranked. To see where Illinois ranked as a state, we have a ranking of the most diverse states in Ameria.
For more Illinois reading:
The 10 Most Diverse Places In Illinois For 2026

/10
Population: 74,096
HHI: 2,577
% White: 34.8%
% African American: 17.7%
% Hispanic: 28.9%
% Asian: 14.1%
More on Bolingbrook: Data | Crime | Cost Of Living | Movers

/10
Population: 32,808
HHI: 2,632
% White: 27.8%
% African American: 10.0%
% Hispanic: 33.2%
% Asian: 25.5%
More on Glendale Heights: Data | Crime | Cost Of Living | Movers

/10
Population: 2,711,226
HHI: 2,726
% White: 32.1%
% African American: 27.4%
% Hispanic: 29.7%
% Asian: 7.2%
More on Chicago: Data | Crime | Cost Of Living | Movers

/10
Population: 30,643
HHI: 2,883
% White: 25.1%
% African American: 23.7%
% Hispanic: 40.5%
% Asian: 6.1%
More on North Chicago: Data | Cost Of Living | Movers

/10
Population: 36,732
HHI: 2,953
% White: 30.2%
% African American: 7.2%
% Hispanic: 40.5%
% Asian: 18.5%
More on Hanover Park: Data | Crime | Cost Of Living | Movers

/10
Population: 18,583
HHI: 3,030
% White: 40.0%
% African American: 24.3%
% Hispanic: 28.6%
% Asian: 2.3%
More on Alsip: Data | Crime | Cost Of Living | Movers

/10
Population: 179,898
HHI: 3,037
% White: 32.2%
% African American: 10.7%
% Hispanic: 41.6%
% Asian: 12.2%
More on Aurora: Data | Crime | Cost Of Living | Movers

/10
Population: 24,600
HHI: 3,084
% White: 24.5%
% African American: 23.1%
% Hispanic: 43.7%
% Asian: 2.9%
More on Zion: Data | Crime | Cost Of Living | Movers

/10
Population: 41,152
HHI: 3,162
% White: 40.5%
% African American: 14.3%
% Hispanic: 35.7%
% Asian: 6.1%
More on Romeoville: Data | Crime | Cost Of Living | Movers

/10
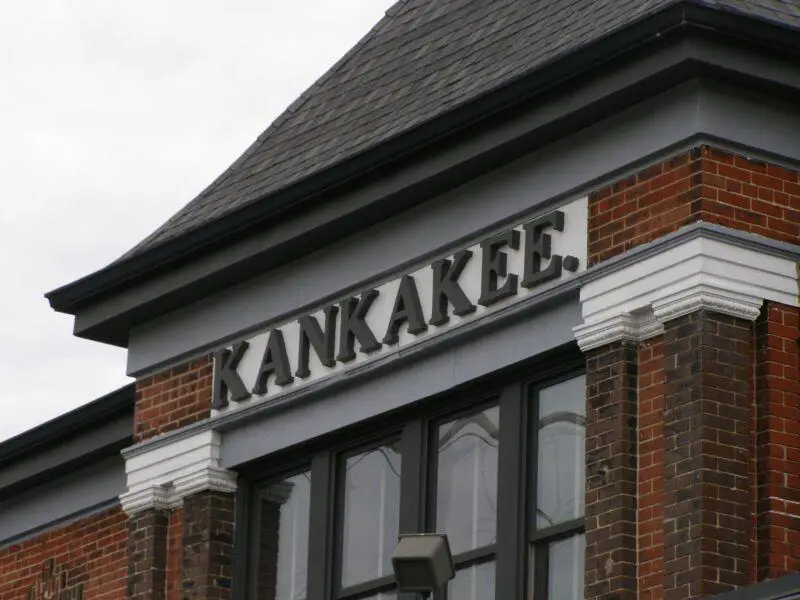
Population: 23,996
HHI: 3,179
% White: 31.3%
% African American: 39.8%
% Hispanic: 24.5%
% Asian: 0.9%
More on Kankakee: Data | Crime | Cost Of Living | Movers
Methodology: How we determined the most diverse cities in Illinois for 2026
We still believe in the accuracy of data — especially from the Census — and Saturday Night Science. So that’s where we went to get the race breakdown across Illinois.
That leads us to the Census’s most recently available data, the 2020-2024 American Community Survey data from the US Census.
Specifically, we looked at table B03002: HISPANIC OR LATINO ORIGIN BY RACE. Here are the category names as defined by the Census:
- White alone*
- Black or African American alone*
- American Indian and Alaska Native alone*
- Asian alone*
- Native Hawaiian and Other Pacific Islander alone*
- Some other race alone*
- Two or more races*
- Hispanic or Latino
We limited our analysis to non-CDPs with a population greater than 5,000 people. That left us with 330 cities.
We then calculated the HHI for each city by finding the racial breakdown of a city in percent terms, squaring them, and then adding the squares together. This left us with scores ranging from 2,577 (Bolingbrook) to 9,436 (Litchfield).
Finally, we ranked each city based on the HHI, with a lower score being more diverse than a high score. Bolingbrook took the distinction of being the most diverse, while Litchfield was the least diverse city.
We updated this article for 2026. This report is our eleventh time ranking the most diverse places in Illinois.
Summary: Diversity Across Illinois
If you’re looking for a scientific breakdown of diversity across Illinois, this is an accurate list.
The most diverse cities in Illinois are Bolingbrook, Glendale Heights, Chicago, North Chicago, Hanover Park, Alsip, Aurora, Zion, Romeoville, and Kankakee.
If you’re curious enough, here are the least diverse places in Illinois:
- Litchfield
- West Frankfort
- Jerseyville
For more Illinois reading, check out:
- Best Places To Live In Illinois
- Cheapest Places To Live In Illinois
- Most Dangerous Cities In Illinois
- Best Places To Raise A Family In Illinois
- Safest Places In Illinois
- Worst Places To Live In Illinois
Race By City In Illinois For 2026
| Rank | City | Population | HHI | % White | % Black | % Hispanic | % Asian |
|---|---|---|---|---|---|---|---|
| 1 | Bolingbrook, IL | 74,096 | 2,577 | 34.8% | 17.7% | 28.9% | 14.1% |
| 2 | Glendale Heights, IL | 32,808 | 2,632 | 27.8% | 10.0% | 33.2% | 25.5% |
| 3 | Chicago, IL | 2,711,226 | 2,726 | 32.1% | 27.4% | 29.7% | 7.2% |
| 4 | North Chicago, IL | 30,643 | 2,883 | 25.1% | 23.7% | 40.5% | 6.1% |
| 5 | Hanover Park, IL | 36,732 | 2,953 | 30.2% | 7.2% | 40.5% | 18.5% |
| 6 | Alsip, IL | 18,583 | 3,030 | 40.0% | 24.3% | 28.6% | 2.3% |
| 7 | Aurora, IL | 179,898 | 3,037 | 32.2% | 10.7% | 41.6% | 12.2% |
| 8 | Zion, IL | 24,600 | 3,084 | 24.5% | 23.1% | 43.7% | 2.9% |
| 9 | Romeoville, IL | 41,152 | 3,162 | 40.5% | 14.3% | 35.7% | 6.1% |
| 10 | Kankakee, IL | 23,996 | 3,179 | 31.3% | 39.8% | 24.5% | 0.9% |
| 11 | Streamwood, IL | 39,001 | 3,201 | 36.1% | 5.1% | 40.7% | 14.5% |
| 12 | Skokie, IL | 66,219 | 3,247 | 48.6% | 10.0% | 11.0% | 25.4% |
| 13 | Hoffman Estates, IL | 51,175 | 3,263 | 47.9% | 5.5% | 17.0% | 25.1% |
| 14 | Carol Stream, IL | 39,460 | 3,291 | 50.1% | 6.3% | 18.5% | 19.3% |
| 15 | Rockford, IL | 147,521 | 3,334 | 49.6% | 19.2% | 21.6% | 3.7% |
| 16 | Chicago Heights, IL | 26,736 | 3,340 | 21.4% | 40.3% | 35.5% | 0.3% |
| 17 | Joliet, IL | 150,445 | 3,379 | 44.0% | 16.0% | 34.2% | 2.4% |
| 18 | Forest Park, IL | 13,943 | 3,416 | 51.0% | 24.0% | 12.4% | 8.8% |
| 19 | Round Lake, IL | 18,628 | 3,427 | 44.5% | 3.7% | 35.8% | 12.1% |
| 20 | Evergreen Park, IL | 19,420 | 3,457 | 49.8% | 25.5% | 17.6% | 2.5% |
| 21 | Wheeling, IL | 38,433 | 3,461 | 49.1% | 3.8% | 28.1% | 15.3% |
| 22 | Westchester, IL | 16,436 | 3,463 | 48.4% | 20.0% | 26.6% | 3.8% |
| 23 | Urbana, IL | 39,341 | 3,468 | 52.9% | 18.7% | 10.1% | 14.2% |
| 24 | Steger, IL | 9,418 | 3,490 | 50.7% | 22.4% | 19.7% | 1.4% |
| 25 | Rantoul, IL | 12,421 | 3,513 | 52.0% | 17.9% | 20.1% | 0.8% |
| 26 | Fairview Heights, IL | 16,745 | 3,521 | 51.0% | 27.6% | 6.9% | 4.0% |
| 27 | Beach Park, IL | 14,115 | 3,530 | 32.8% | 10.9% | 47.8% | 7.2% |
| 28 | Crest Hill, IL | 20,628 | 3,530 | 50.5% | 15.0% | 27.0% | 2.4% |
| 29 | Midlothian, IL | 13,948 | 3,533 | 46.0% | 9.3% | 36.0% | 2.9% |
| 30 | Blue Island, IL | 21,741 | 3,533 | 18.0% | 30.7% | 47.5% | 0.6% |
| 31 | Berkeley, IL | 5,199 | 3,558 | 21.3% | 26.2% | 49.1% | 2.6% |
| 32 | East Moline, IL | 20,904 | 3,574 | 52.9% | 20.6% | 17.5% | 2.9% |
| 33 | Champaign, IL | 89,996 | 3,594 | 54.5% | 17.2% | 7.9% | 15.8% |
| 34 | Lansing, IL | 28,284 | 3,607 | 25.2% | 51.4% | 17.9% | 2.2% |
| 35 | Peoria, IL | 112,169 | 3,626 | 53.2% | 25.6% | 8.0% | 6.6% |
| 36 | Chicago Ridge, IL | 14,099 | 3,642 | 54.4% | 9.4% | 21.0% | 3.1% |
| 37 | Schaumburg, IL | 76,868 | 3,655 | 53.7% | 5.7% | 12.7% | 23.8% |
| 38 | West Chicago, IL | 25,395 | 3,656 | 35.3% | 3.0% | 47.8% | 10.3% |
| 39 | Rolling Meadows, IL | 24,027 | 3,665 | 50.9% | 2.6% | 29.2% | 14.3% |
| 40 | Elgin, IL | 114,934 | 3,673 | 34.9% | 5.2% | 48.7% | 6.6% |
| 41 | Mundelein, IL | 31,915 | 3,673 | 48.5% | 3.1% | 34.6% | 10.1% |
| 42 | Hillside, IL | 8,084 | 3,753 | 15.7% | 48.5% | 34.0% | 0.6% |
| 43 | Carbondale, IL | 22,158 | 3,754 | 54.2% | 26.3% | 7.1% | 7.3% |
| 44 | Woodridge, IL | 33,941 | 3,754 | 56.8% | 10.5% | 16.0% | 12.1% |
| 45 | Des Plaines, IL | 59,156 | 3,779 | 54.8% | 3.7% | 23.1% | 14.9% |
| 46 | Pingree Grove, IL | 10,914 | 3,794 | 57.1% | 12.3% | 17.6% | 6.5% |
| 47 | Dekalb, IL | 40,443 | 3,807 | 56.4% | 13.8% | 19.9% | 4.0% |
| 48 | Justice, IL | 12,324 | 3,823 | 56.3% | 17.1% | 18.0% | 5.1% |
| 49 | Crete, IL | 8,386 | 3,825 | 47.2% | 38.9% | 7.6% | 1.0% |
| 50 | Evanston, IL | 76,340 | 3,841 | 58.0% | 14.2% | 12.3% | 9.4% |
| 51 | Addison, IL | 35,489 | 3,868 | 40.8% | 3.2% | 46.0% | 8.6% |
| 52 | Homewood, IL | 19,294 | 3,875 | 44.3% | 43.1% | 6.4% | 1.4% |
| 53 | South Elgin, IL | 24,217 | 3,876 | 57.4% | 4.7% | 20.3% | 10.9% |
| 54 | Gurnee, IL | 30,510 | 3,911 | 58.2% | 7.7% | 17.0% | 12.9% |
| 55 | Morton Grove, IL | 24,619 | 3,916 | 53.0% | 2.0% | 8.0% | 32.0% |
| 56 | Beardstown, IL | 6,169 | 3,936 | 47.4% | 7.4% | 40.3% | 1.8% |
| 57 | Monee, IL | 5,108 | 3,937 | 50.5% | 35.7% | 10.3% | 0.8% |
| 58 | Waukegan, IL | 89,076 | 3,942 | 16.7% | 16.6% | 57.9% | 5.4% |
| 59 | Montgomery, IL | 21,515 | 4,004 | 53.8% | 7.9% | 32.1% | 2.1% |
| 60 | Bensenville, IL | 18,603 | 4,046 | 40.6% | 6.3% | 48.5% | 2.9% |
| 61 | Vernon Hills, IL | 26,876 | 4,102 | 57.9% | 1.9% | 11.5% | 24.6% |
| 62 | Lincolnwood, IL | 13,112 | 4,106 | 57.2% | 4.3% | 7.4% | 27.3% |
| 63 | Bartlett, IL | 40,501 | 4,119 | 59.0% | 4.1% | 15.0% | 19.7% |
| 64 | Danville, IL | 28,595 | 4,191 | 54.4% | 34.2% | 7.6% | 1.3% |
| 65 | Broadview, IL | 7,896 | 4,212 | 9.3% | 59.5% | 23.6% | 1.9% |
| 66 | Crestwood, IL | 10,579 | 4,233 | 61.0% | 16.3% | 13.4% | 1.1% |
| 67 | Palatine, IL | 66,293 | 4,234 | 60.7% | 4.5% | 19.2% | 12.5% |
| 68 | Oak Park, IL | 53,292 | 4,245 | 61.5% | 17.8% | 9.3% | 5.1% |
| 69 | Carpentersville, IL | 37,346 | 4,248 | 30.0% | 4.9% | 57.4% | 4.1% |
| 70 | Bridgeview, IL | 16,849 | 4,249 | 55.4% | 4.8% | 33.7% | 4.8% |
| 71 | Westmont, IL | 23,724 | 4,270 | 61.7% | 5.9% | 14.2% | 14.6% |
| 72 | North Riverside, IL | 7,249 | 4,276 | 56.6% | 8.5% | 31.5% | 1.7% |
| 73 | Mount Prospect, IL | 55,472 | 4,302 | 61.0% | 2.5% | 18.1% | 15.4% |
| 74 | Naperville, IL | 150,692 | 4,314 | 61.0% | 4.3% | 7.6% | 22.3% |
| 75 | Sauk Village, IL | 9,678 | 4,315 | 14.2% | 61.9% | 14.7% | 0.0% |
| 76 | Buffalo Grove, IL | 42,891 | 4,319 | 58.2% | 3.4% | 5.8% | 29.7% |
| 77 | Belleville, IL | 41,370 | 4,321 | 56.7% | 32.5% | 2.9% | 1.0% |
| 78 | Burbank, IL | 28,739 | 4,353 | 41.6% | 1.9% | 51.1% | 3.2% |
| 79 | Rock Island, IL | 36,151 | 4,361 | 62.5% | 15.6% | 13.3% | 3.8% |
| 80 | Oswego, IL | 36,375 | 4,365 | 62.4% | 10.1% | 17.9% | 4.4% |
| 81 | Round Lake Beach, IL | 27,079 | 4,366 | 34.5% | 4.2% | 56.1% | 2.2% |
| 82 | Shiloh, IL | 14,572 | 4,367 | 60.9% | 24.4% | 4.9% | 3.3% |
| 83 | Moline, IL | 42,197 | 4,381 | 62.1% | 10.5% | 19.8% | 3.2% |
| 84 | River Grove, IL | 10,451 | 4,389 | 52.5% | 2.1% | 40.0% | 4.7% |
| 85 | Round Lake Park, IL | 7,919 | 4,403 | 43.9% | 0.8% | 49.5% | 0.8% |
| 86 | Plano, IL | 12,203 | 4,409 | 52.9% | 1.3% | 39.8% | 0.8% |
| 87 | Harvey, IL | 20,230 | 4,411 | 2.4% | 53.6% | 39.1% | 2.2% |
| 88 | Maywood, IL | 23,201 | 4,419 | 4.5% | 55.1% | 36.9% | 1.3% |
| 89 | Niles, IL | 30,064 | 4,468 | 62.2% | 2.3% | 13.3% | 20.3% |
| 90 | Savoy, IL | 8,968 | 4,478 | 62.9% | 7.1% | 6.9% | 20.3% |
| 91 | Flossmoor, IL | 9,391 | 4,488 | 30.1% | 59.5% | 4.9% | 1.6% |
| 92 | Warrenville, IL | 14,718 | 4,496 | 61.4% | 4.7% | 25.6% | 6.5% |
| 93 | Wood Dale, IL | 13,933 | 4,537 | 59.1% | 2.7% | 31.8% | 5.1% |
| 94 | South Barrington, IL | 5,021 | 4,557 | 48.4% | 0.8% | 0.4% | 46.9% |
| 95 | Lyons, IL | 10,339 | 4,568 | 45.0% | 1.5% | 50.3% | 2.3% |
| 96 | Highwood, IL | 5,301 | 4,609 | 57.1% | 1.2% | 36.6% | 2.1% |
| 97 | Oak Brook, IL | 8,056 | 4,620 | 59.3% | 0.3% | 5.7% | 32.7% |
| 98 | Berwyn, IL | 55,595 | 4,632 | 24.9% | 7.4% | 62.8% | 3.8% |
| 99 | Oak Lawn, IL | 56,861 | 4,636 | 63.1% | 8.6% | 24.0% | 1.7% |
| 100 | Oak Forest, IL | 26,805 | 4,639 | 64.8% | 7.8% | 18.4% | 5.8% |