
Are you looking for love in Illinois?
Or are you just hoping to hook up with a hot Illinoisan?
Either way, we’ve got you covered here.
If you live in Illinois, there’s a pretty good chance there are a lot of singles in your area. The Prairie State has plenty of people over 18 who aren’t married or in a serious relationship.
That’s great news for people who are single and looking to mingle.
So, where are the best cities for singles in Illinois? We used Saturday Night Science to find out.
Table Of Contents: Top Ten | Methodology | Summary | Table
The 10 Best Cities For Singles In Illinois For 2026
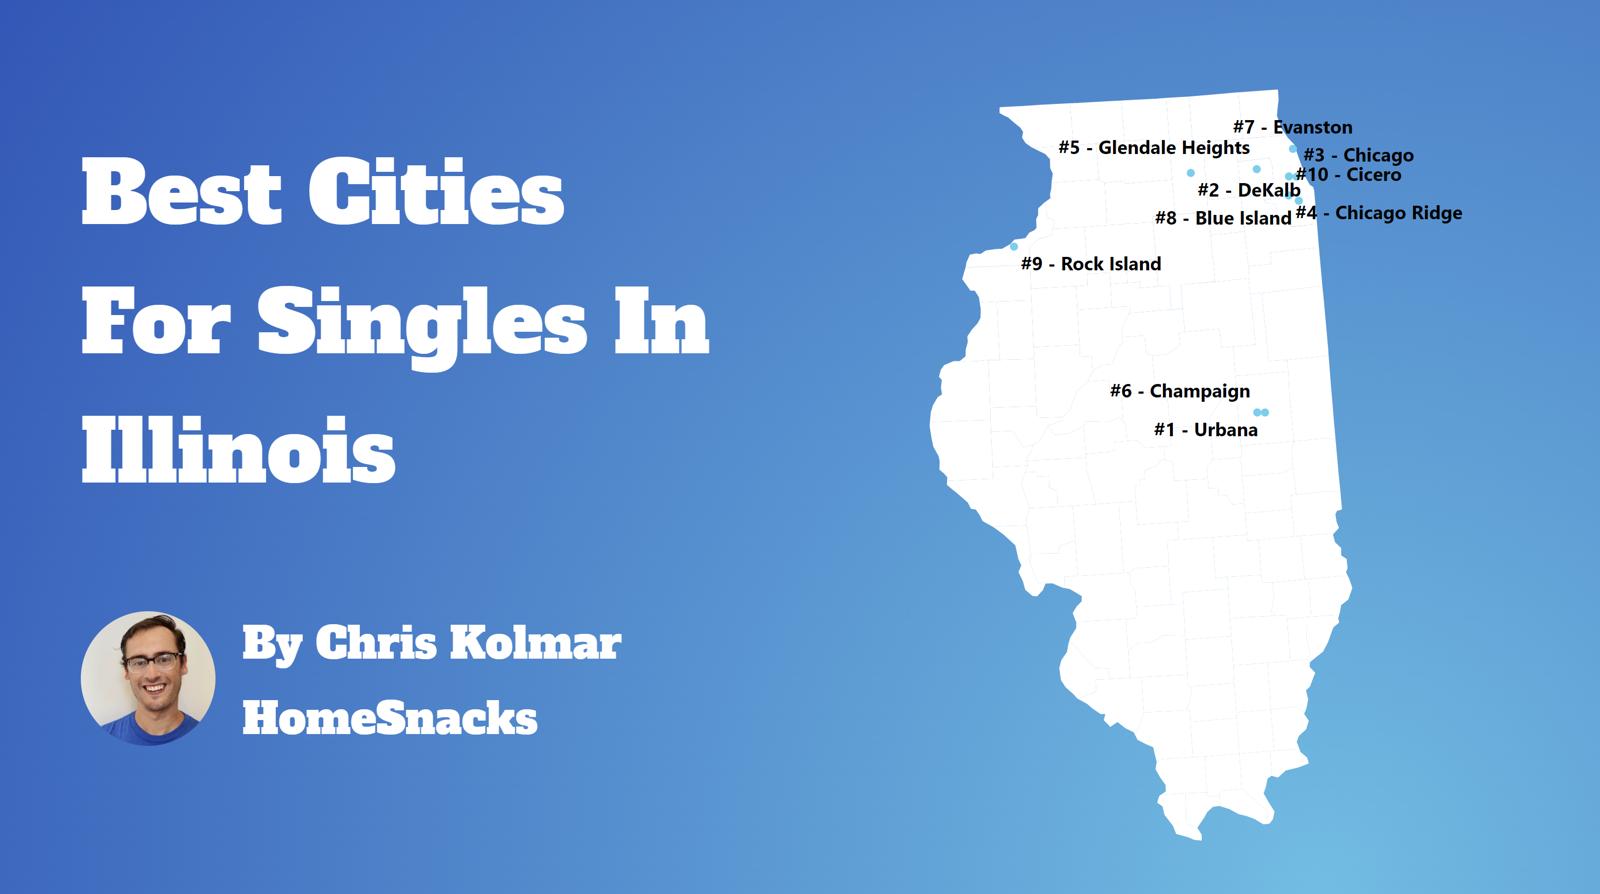
So, what was the best city for singles in Illinois? Champaign ranks as the best place for singles in Illinois if you care about things singles care about, like nightlife, affordable housing, and other singles.
Read below to see how we crunched the numbers and how each city ranked. If you live in or are close to one of these cities and are single, you should probably get out more often.
Just saying.
For more Illinois reading, check out:
- Best Places To Live In Illinois
- Cheapest Places To Live In Illinois
- Most Dangerous Cities In Illinois
The 10 Best Cities For Singles In Illinois For 2026


/10
Population: 89,996
Median Age: 26.6
Married households: 15.0%
Households with kids: 18.9%
More on Champaign: Data | Crime | Cost Of Living | Movers

Crime is getting worse by the day as many gangs from Chicago are moving into the area. Schools are not too bad but do not like the fact they use the city bus to transport children to school. It’s a college student town so population varies throughout the year.
Going go some of the college sporting events was neat. Not a whole lot to do outside of that. Winters are brutal with nasty winds.

/10
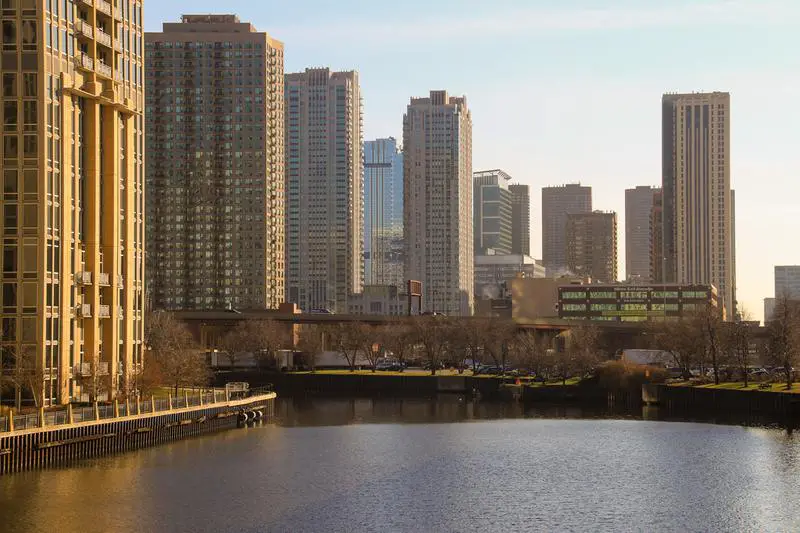
Population: 2,711,226
Median Age: 35.8
Married households: 14.0%
Households with kids: 23.3%
More on Chicago: Data | Crime | Cost Of Living | Movers
Where to begin- The city itself and state of Illinois run soley by the leftist Democrats. Really high taxes, crime that’s beyond out of control. Horrid public school systems and Crook County wrote the book on crooked politics. Now there used to be parts of the city that were safe but now even that’s long gone. Worse yet, the uber leftist rich have begun to push out the projects they created years ago immediately after MLK was murdered and cities burned to ground. The culture and people they single handedly destroyed and enslaved with welfare, purposely promoting single parent households and values related to everything other than what matters all in the name of votes. So now the last livable areas with decent schools, safe streets are vanishing with the relocation of these hood rats by the white loathing leftists.
One sided leftist politics that control Illinois.
Out of control taxes
Absolutely horrid roads
Absolutely horrid crime
Absolutely horrid schools
No end in site with Madigan always in control.
New clueless bleeding heart billionaire governor Pritzker catering to the race pimps and lefty rich.

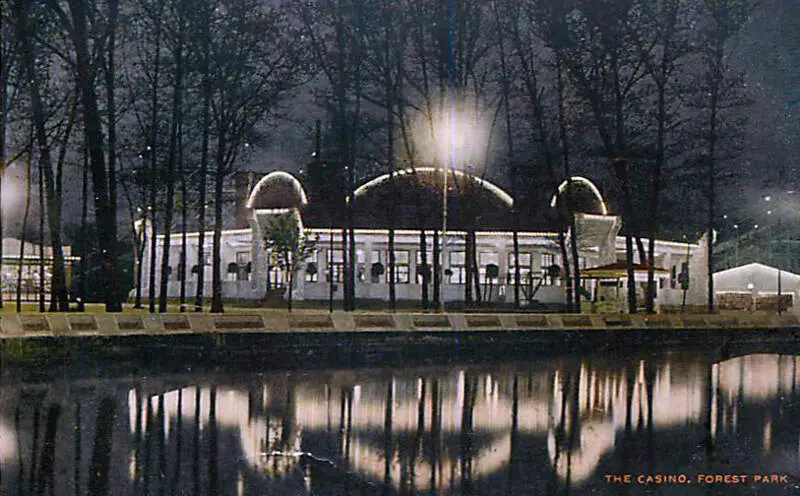
/10
Population: 13,943
Median Age: 40.0
Married households: 17.0%
Households with kids: 19.3%
More on Forest Park: Data | Crime | Cost Of Living | Movers

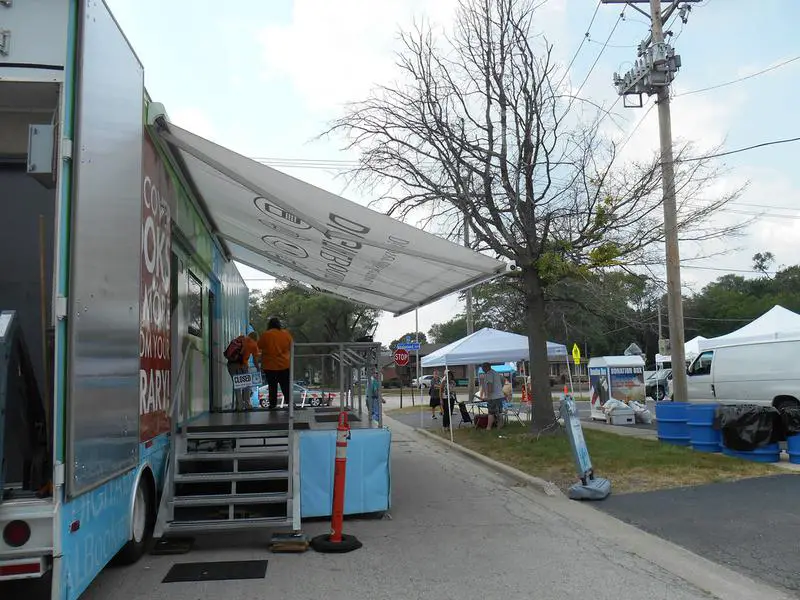
/10
Population: 14,099
Median Age: 34.0
Married households: 19.0%
Households with kids: 29.3%
More on Chicago Ridge: Data | Crime | Cost Of Living | Movers

/10
Population: 39,341
Median Age: 26.1
Married households: 11.0%
Households with kids: 14.2%
More on Urbana: Data | Crime | Cost Of Living | Movers

/10
Population: 21,741
Median Age: 38.1
Married households: 13.0%
Households with kids: 26.7%
More on Blue Island: Data | Crime | Cost Of Living | Movers

/10
Population: 32,808
Median Age: 36.1
Married households: 14.0%
Households with kids: 31.5%
More on Glendale Heights: Data | Crime | Cost Of Living | Movers

/10
Population: 40,443
Median Age: 26.1
Married households: 16.0%
Households with kids: 25.6%
More on Dekalb: Data | Crime | Cost Of Living | Movers

/10
Population: 82,797
Median Age: 34.4
Married households: 9.0%
Households with kids: 42.3%
More on Cicero: Data | Crime | Cost Of Living | Movers

/10
Population: 12,324
Median Age: 36.6
Married households: 17.0%
Households with kids: 32.5%
More on Justice: Data | Crime | Cost Of Living | Movers
Methodology: How do you determine which city is best for singles in Illinois anyways?
To give you the places in Illinois which are best for singles to find one another, we used Saturday Night Science to look at a handful of metrics. Of course, we want to measure the type of people who live in each city and make some assumptions about what single people like.
So we researched the internet for a database that contains all that information.
We threw a lot of criteria at this one to get the best, most complete results possible. Using the 2020-2024 American Community Survey Census data produced for the state of Illinois, we looked at every single city in the state. We paid particular attention to:
- Population density
- % of population that’s male vs. female (closer to a 50-50 ratio is better)
- % of households with kids
- Median age
- Number of unmarried people in each city
We then gave each city a “Singles Score.”
The higher the score, the better the city is for singles to find one another. We also limited our results to cities with over 10,000 people. For Illinois, that meant a total of 221 cities.
We updated this article for 2026. This is our eleventh time ranking the best cities for singles in Illinois.
Read on to see why Champaign is the talk of the town while Campton Hills is probably a bit on the bland side.
Summary: The Best Cities for Singles in Illinois for 2026
If you’re looking for a breakdown of cities in Illinois ranked by criteria that most agree make a place a great spot for finding a single person (and potentially love), this is an accurate list.
The best cities for singles in Illinois are Champaign, Chicago, Forest Park, Chicago Ridge, Urbana, Blue Island, Glendale Heights, DeKalb, Cicero, and Justice.
Here’s a look at the most boring cities in Illinois according to the data:
- Campton Hills
- Morton
- Mahomet
For more Illinois reading, check out:
- Best Places To Raise A Family In Illinois
- Safest Places In Illinois
- Worst Places To Live In Illinois
Best Cities For Singles In Illinois
| Rank | City | Population | Median Age | % Married Households | % Households /w Kids |
|---|---|---|---|---|---|
| 1 | Champaign, IL | 89,996 | 26.6 | 15.0% | 18.9% |
| 2 | Chicago, IL | 2,711,226 | 35.8 | 14.0% | 23.3% |
| 3 | Forest Park, IL | 13,943 | 40.0 | 17.0% | 19.3% |
| 4 | Chicago Ridge, IL | 14,099 | 34.0 | 19.0% | 29.3% |
| 5 | Urbana, IL | 39,341 | 26.1 | 11.0% | 14.2% |
| 6 | Blue Island, IL | 21,741 | 38.1 | 13.0% | 26.7% |
| 7 | Glendale Heights, IL | 32,808 | 36.1 | 14.0% | 31.5% |
| 8 | Dekalb, IL | 40,443 | 26.1 | 16.0% | 25.6% |
| 9 | Cicero, IL | 82,797 | 34.4 | 9.0% | 42.3% |
| 10 | Justice, IL | 12,324 | 36.6 | 17.0% | 32.5% |
| 11 | Evanston, IL | 76,340 | 38.4 | 15.0% | 23.3% |
| 12 | Carbondale, IL | 22,158 | 24.6 | 7.0% | 15.6% |
| 13 | Rock Island, IL | 36,151 | 37.4 | 21.0% | 24.2% |
| 14 | Maywood, IL | 23,201 | 34.6 | 15.0% | 37.7% |
| 15 | Carpentersville, IL | 37,346 | 33.8 | 15.0% | 43.2% |
| 16 | Burbank, IL | 28,739 | 38.6 | 19.0% | 35.6% |
| 17 | Hanover Park, IL | 36,732 | 35.3 | 16.0% | 40.6% |
| 18 | Streamwood, IL | 39,001 | 40.0 | 16.0% | 32.7% |
| 19 | Harvey, IL | 20,230 | 36.6 | 13.0% | 31.5% |
| 20 | Aurora, IL | 179,898 | 35.2 | 18.0% | 40.9% |
| 21 | Wheaton, IL | 53,557 | 36.8 | 27.0% | 28.9% |
| 22 | Waukegan, IL | 89,076 | 35.5 | 11.0% | 33.0% |
| 23 | Normal, IL | 53,569 | 25.0 | 20.0% | 21.9% |
| 24 | Riverdale, IL | 10,340 | 32.8 | 15.0% | 33.3% |
| 25 | Dolton, IL | 20,825 | 40.3 | 19.0% | 27.6% |
| 26 | Northlake, IL | 12,513 | 41.9 | 15.0% | 27.0% |
| 27 | Warrenville, IL | 14,718 | 36.5 | 25.0% | 27.6% |
| 28 | Midlothian, IL | 13,948 | 38.3 | 31.0% | 27.0% |
| 29 | Jacksonville, IL | 18,014 | 37.6 | 27.0% | 21.2% |
| 30 | Rolling Meadows, IL | 24,027 | 39.5 | 21.0% | 30.3% |
| 31 | Lisle, IL | 23,407 | 36.5 | 27.0% | 27.2% |
| 32 | Berwyn, IL | 55,595 | 37.8 | 18.0% | 35.4% |
| 33 | Moline, IL | 42,197 | 38.0 | 25.0% | 28.6% |
| 34 | Summit, IL | 10,846 | 38.1 | 8.0% | 33.5% |
| 35 | Macomb, IL | 14,894 | 27.6 | 17.0% | 17.6% |
| 36 | Wheeling, IL | 38,433 | 39.9 | 13.0% | 26.3% |
| 37 | Carol Stream, IL | 39,460 | 40.4 | 24.0% | 29.4% |
| 38 | Elmwood Park, IL | 23,868 | 41.5 | 21.0% | 27.0% |
| 39 | Lyons, IL | 10,339 | 40.8 | 22.0% | 29.6% |
| 40 | Hickory Hills, IL | 14,526 | 38.8 | 19.0% | 33.4% |
| 41 | Worth, IL | 10,700 | 39.4 | 25.0% | 27.4% |
| 42 | Lombard, IL | 43,619 | 39.2 | 30.0% | 26.9% |
| 43 | Schaumburg, IL | 76,868 | 39.6 | 23.0% | 30.9% |
| 44 | Franklin Park, IL | 18,197 | 38.3 | 14.0% | 35.1% |
| 45 | Charleston, IL | 17,062 | 29.6 | 27.0% | 17.5% |
| 46 | Bloomington, IL | 78,907 | 36.2 | 27.0% | 26.6% |
| 47 | Mundelein, IL | 31,915 | 38.1 | 23.0% | 32.0% |
| 48 | Rockford, IL | 147,521 | 37.7 | 21.0% | 27.4% |
| 49 | Peoria, IL | 112,169 | 35.5 | 23.0% | 26.1% |
| 50 | Bridgeview, IL | 16,849 | 39.4 | 17.0% | 28.4% |
| 51 | Niles, IL | 30,064 | 48.2 | 15.0% | 27.8% |
| 52 | River Grove, IL | 10,451 | 36.3 | 20.0% | 30.3% |
| 53 | Palatine, IL | 66,293 | 40.7 | 23.0% | 27.6% |
| 54 | Streator, IL | 12,330 | 37.6 | 32.0% | 25.9% |
| 55 | Park Forest, IL | 21,156 | 36.9 | 19.0% | 29.0% |
| 56 | Oak Park, IL | 53,292 | 40.3 | 21.0% | 28.5% |
| 57 | Palos Hills, IL | 18,081 | 41.7 | 23.0% | 26.3% |
| 58 | North Chicago, IL | 30,643 | 23.2 | 5.0% | 36.0% |
| 59 | Round Lake Beach, IL | 27,079 | 33.8 | 19.0% | 40.8% |
| 60 | Melrose Park, IL | 24,549 | 37.3 | 11.0% | 37.1% |
| 61 | Mount Prospect, IL | 55,472 | 41.1 | 25.0% | 31.2% |
| 62 | Zion, IL | 24,600 | 32.3 | 15.0% | 37.9% |
| 63 | Belvidere, IL | 24,752 | 38.7 | 22.0% | 31.6% |
| 64 | Oak Lawn, IL | 56,861 | 40.3 | 31.0% | 28.7% |
| 65 | Quincy, IL | 39,109 | 39.7 | 28.0% | 24.9% |
| 66 | Kankakee, IL | 23,996 | 36.1 | 18.0% | 33.3% |
| 67 | Elgin, IL | 114,934 | 36.7 | 20.0% | 36.2% |
| 68 | Glen Ellyn, IL | 28,390 | 39.8 | 30.0% | 34.9% |
| 69 | Woodridge, IL | 33,941 | 37.5 | 27.0% | 29.3% |
| 70 | Des Plaines, IL | 59,156 | 42.3 | 22.0% | 28.5% |
| 71 | Prospect Heights, IL | 15,618 | 42.8 | 23.0% | 23.9% |
| 72 | Bolingbrook, IL | 74,096 | 37.2 | 22.0% | 38.5% |
| 73 | Schiller Park, IL | 11,393 | 39.7 | 17.0% | 30.4% |
| 74 | Centralia, IL | 11,856 | 39.1 | 27.0% | 26.6% |
| 75 | River Forest, IL | 11,992 | 40.0 | 28.0% | 33.4% |
| 76 | Danville, IL | 28,595 | 39.8 | 22.0% | 25.9% |
| 77 | Chicago Heights, IL | 26,736 | 35.2 | 18.0% | 37.4% |
| 78 | Hoffman Estates, IL | 51,175 | 39.2 | 22.0% | 36.0% |
| 79 | Lincolnwood, IL | 13,112 | 45.6 | 21.0% | 32.9% |
| 80 | Villa Park, IL | 22,345 | 37.0 | 31.0% | 32.7% |
| 81 | Bradley, IL | 15,325 | 34.7 | 32.0% | 28.2% |
| 82 | Joliet, IL | 150,445 | 35.8 | 27.0% | 39.6% |
| 83 | Norridge, IL | 15,439 | 46.0 | 16.0% | 27.9% |
| 84 | Lincoln, IL | 13,281 | 39.2 | 32.0% | 25.6% |
| 85 | Galesburg, IL | 29,481 | 40.8 | 25.0% | 21.9% |
| 86 | Markham, IL | 11,355 | 34.2 | 16.0% | 36.5% |
| 87 | Skokie, IL | 66,219 | 43.2 | 17.0% | 31.6% |
| 88 | Evergreen Park, IL | 19,420 | 38.8 | 40.0% | 35.5% |
| 89 | O’fallon, IL | 32,262 | 37.8 | 22.0% | 36.0% |
| 90 | Gurnee, IL | 30,510 | 40.1 | 23.0% | 29.5% |
| 91 | Woodstock, IL | 26,147 | 39.7 | 23.0% | 29.4% |
| 92 | Vernon Hills, IL | 26,876 | 41.8 | 18.0% | 33.4% |
| 93 | Westmont, IL | 23,724 | 43.2 | 23.0% | 23.8% |
| 94 | Naperville, IL | 150,692 | 40.4 | 23.0% | 38.0% |
| 95 | Loves Park, IL | 23,502 | 37.2 | 26.0% | 25.3% |
| 96 | Oak Forest, IL | 26,805 | 40.5 | 38.0% | 30.1% |
| 97 | Addison, IL | 35,489 | 40.8 | 19.0% | 30.7% |
| 98 | Round Lake, IL | 18,628 | 36.1 | 23.0% | 39.5% |
| 99 | Sterling, IL | 14,717 | 42.6 | 32.0% | 27.4% |
| 100 | Bellwood, IL | 18,256 | 38.7 | 21.0% | 36.0% |