Most Hispanic/Latino cities in Illinois research summary. We used Saturday Night Science to analyze Illinois’s most recent Census data to determine the most Hispanic/Latino cities based on the percentage of Hispanic/Latino residents.
87.5% Hispanic · #1 most Hispanic in Illinois
Cicero is a suburb of Chicago and an incorporated town in Cook County, Illinois, United States. The population was 83,891 at the 2010 census. As of 2013, the town had a total population of 84,103, making it the 11th largest municipality in Illinois. Cicero is named for the town of Cicero, New York, which in turn was named for Marcus Tullius Cicero, the Roman statesman and orator.
Data | Crime | Cost of living | Movers
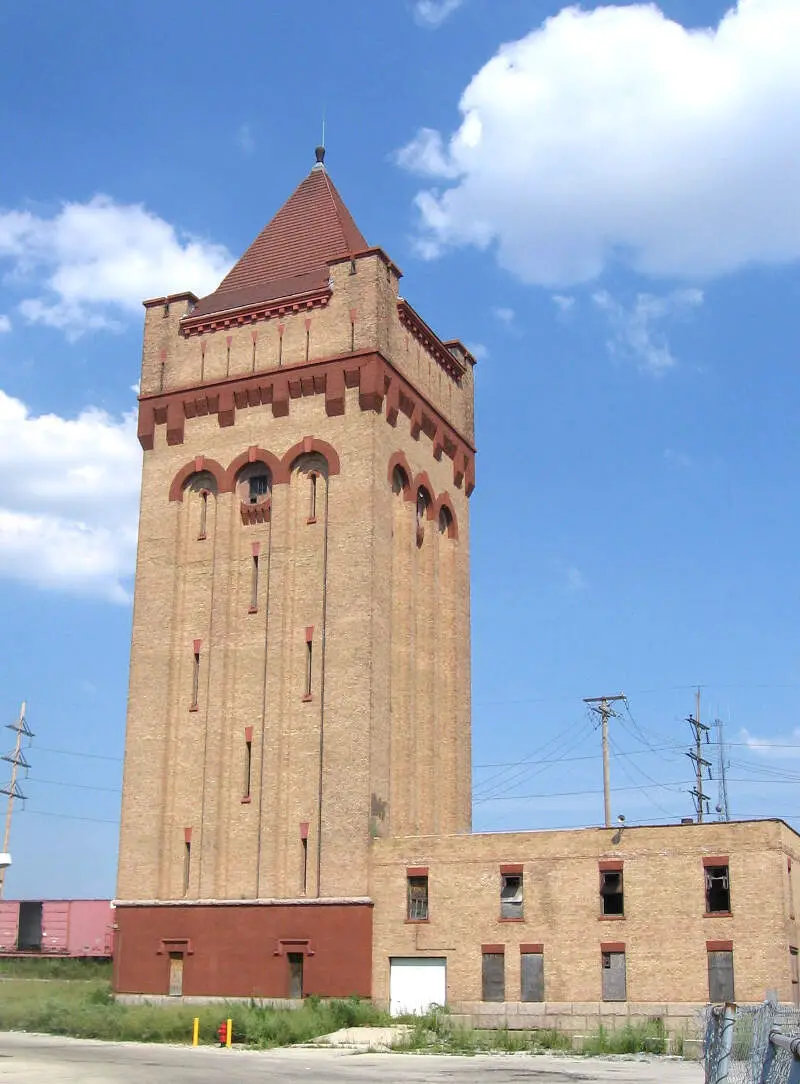
80.3% Hispanic · #2 most Hispanic in Illinois
Data | Crime | Cost of living | Movers
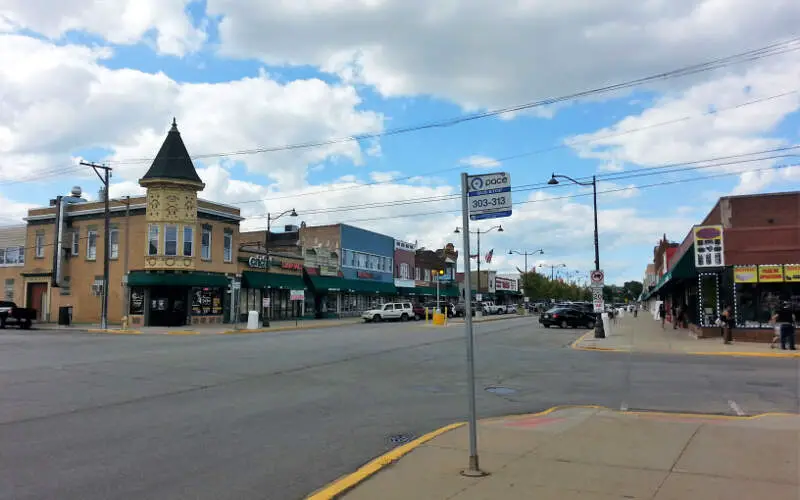
77.0% Hispanic · #3 most Hispanic in Illinois
Melrose Park is a village in Cook County, Illinois, United States. It is a suburb of Chicago,14 miles by road. As of the 2010 census it had a population of 25,411. Melrose Park had long been home to a large Italian-American population, but is now overwhelmingly Hispanic, based on US Census data.
Data | Crime | Cost of living | Movers
75.3% Hispanic · #4 most Hispanic in Illinois
Data | Crime | Cost of living | Movers
75.1% Hispanic · #5 most Hispanic in Illinois
Park City is a small city located in the Warren and Waukegan townships of Lake County, Illinois, United States. The population was 7,570 at the 2010 census.
Data | Crime | Cost of living | Movers
68.7% Hispanic · #6 most Hispanic in Illinois
Posen is a village in Cook County, Illinois, United States. Posen is the German-language name for the western Polish city of Pozna. The population of the village was 5,987 at the 2010 census, up from 4,730 in 2000.
Data | Crime | Cost of living | Movers
62.8% Hispanic · #7 most Hispanic in Illinois
Berwyn is a suburban city in Cook County, Illinois, coterminous with Berwyn Township, which was formed in 1908 after breaking off from Cicero Township. As of the 2010 census, the city had a total population of 56,657.
Data | Crime | Cost of living | Movers
62.2% Hispanic · #8 most Hispanic in Illinois
Data | Crime | Cost of living | Movers
62.1% Hispanic · #9 most Hispanic in Illinois
Data | Crime | Cost of living | Movers
57.9% Hispanic · #10 most Hispanic in Illinois
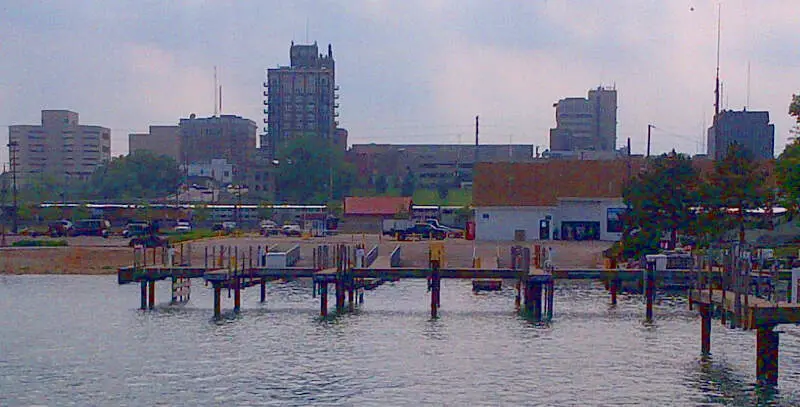
Waukegan is a city and the county seat of Lake County, Illinois, United States. It is part of the Chicago Metropolitan Area. As of the 2013 census estimate, the city had a population of 88,826. It is the ninth-largest city in Illinois by population, and it is the fifth-largest city on the western shore of Lake Michigan, after Chicago, Milwaukee, Green Bay, and Kenosha.
Data | Crime | Cost of living | Movers
The receipts
Compare the top ten
Pick a metric. The bars rescale. The red line is Illinois’s statewide median.
On the map
Where Illinois’s Hispanic and Latino communities live
Saturday Night Science
Methodology: How We Determined The Cities In Illinois With The Largest Hispanic Population For 2026
We used Saturday Night Science to compare data on race from the US Census for every city in Illinois.
Illinois’s most recently available data comes from the 2020-2024 American Community Survey.
Specifically, we looked at table B03002: Hispanic OR LATINO ORIGIN BY RACE. Here are the category names as defined by the Census:
- Hispanic or Latino
- White alone*
- Black or African American alone*
- American Indian and Alaska Native alone*
- Asian alone*
- Native Hawaiian and Other Pacific Islander alone*
- Some other race alone*
- Two or more races*
Our particular column of interest here was the number of people who identified as Hispanic or Latino.
We limited our analysis to places in Illinois with a population greater than 5,000 people. That left us with 324 cities.
We then calculated the percentage of Hispanic or Latino residents in each Illinois city. The percentages ranked from 87.5% to 0.2%.
Finally, we ranked each city based on the percentage of the Hispanic or Latino population, with a higher percentage being more Hispanic or Latino. Cicero was the most Hispanic or Latino, while Litchfield was the least Hispanic or Latino city.
We updated this article for 2026. This article represents our eleventh time ranking the cities in Illinois with the largest Hispanic/Latino population.
The full plate
Cities In Illinois By Hispanic Population
Click any column to sort. Search by city name.
| Rank | City | Population | Hispanic Population | % Hispanic |
|---|---|---|---|---|
| 1 | Cicero | 82,797 | 72,421 | 87.5% |
| 2 | Summit | 10,846 | 8,708 | 80.3% |
| 3 | Melrose Park | 24,549 | 18,914 | 77.0% |
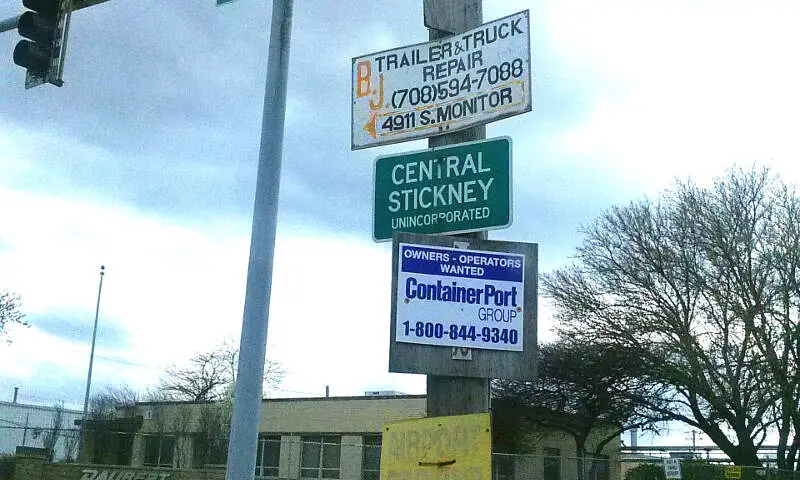
| 4 | Stickney | 6,952 | 5,232 | 75.3% |
| 5 | Park City | 7,827 | 5,877 | 75.1% |
| 6 | Posen | 5,292 | 3,636 | 68.7% |
| 7 | Berwyn | 55,595 | 34,902 | 62.8% |
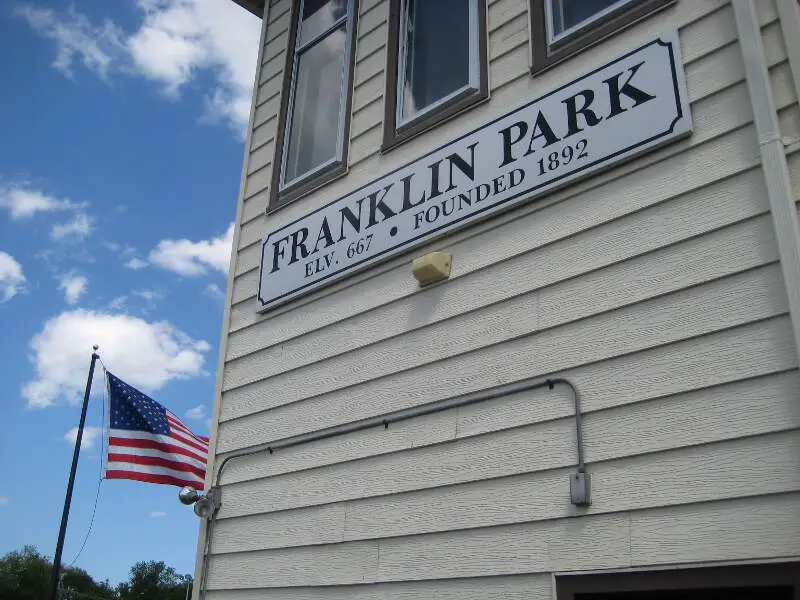
| 8 | Franklin Park | 18,197 | 11,312 | 62.2% |
| 9 | Northlake | 12,513 | 7,765 | 62.1% |
| 10 | Waukegan | 89,076 | 51,565 | 57.9% |
| 11 | Carpentersville | 37,346 | 21,436 | 57.4% |
| 12 | Harvard | 9,598 | 5,418 | 56.4% |
| 13 | Round Lake Beach | 27,079 | 15,198 | 56.1% |
| 14 | Burbank | 28,739 | 14,673 | 51.1% |
| 15 | Lyons | 10,339 | 5,205 | 50.3% |
| 16 | Round Lake Park | 7,919 | 3,923 | 49.5% |
| 17 | Berkeley | 5,199 | 2,553 | 49.1% |
| 18 | Elgin | 114,934 | 55,973 | 48.7% |
| 19 | Bensenville | 18,603 | 9,021 | 48.5% |
| 20 | Beach Park | 14,115 | 6,745 | 47.8% |
| 21 | West Chicago | 25,395 | 12,134 | 47.8% |
| 22 | Blue Island | 21,741 | 10,326 | 47.5% |
| 23 | Addison | 35,489 | 16,325 | 46.0% |
| 24 | Zion | 24,600 | 10,760 | 43.7% |
| 25 | Aurora | 179,898 | 74,887 | 41.6% |
| 26 | Streamwood | 39,001 | 15,860 | 40.7% |
| 27 | North Chicago | 30,643 | 12,410 | 40.5% |
| 28 | Hanover Park | 36,732 | 14,862 | 40.5% |
| 29 | Beardstown | 6,169 | 2,489 | 40.3% |
| 30 | River Grove | 10,451 | 4,183 | 40.0% |
| 31 | Plano | 12,203 | 4,851 | 39.8% |
| 32 | Elmwood Park | 23,868 | 9,487 | 39.7% |
| 33 | Harvey | 20,230 | 7,901 | 39.1% |
| 34 | Maywood | 23,201 | 8,562 | 36.9% |
| 35 | Highwood | 5,301 | 1,939 | 36.6% |
| 36 | Midlothian | 13,948 | 5,025 | 36.0% |
| 37 | Round Lake | 18,628 | 6,677 | 35.8% |
| 38 | Romeoville | 41,152 | 14,687 | 35.7% |
| 39 | Chicago Heights | 26,736 | 9,481 | 35.5% |
| 40 | Belvidere | 24,752 | 8,729 | 35.3% |
| 41 | Mundelein | 31,915 | 11,037 | 34.6% |
| 42 | Joliet | 150,445 | 51,435 | 34.2% |
| 43 | Hillside | 8,084 | 2,746 | 34.0% |
| 44 | Bridgeview | 16,849 | 5,682 | 33.7% |
| 45 | Glendale Heights | 32,808 | 10,885 | 33.2% |
| 46 | Mendota | 6,994 | 2,286 | 32.7% |
| 47 | Montgomery | 21,515 | 6,896 | 32.1% |
| 48 | Wood Dale | 13,933 | 4,427 | 31.8% |
| 49 | North Riverside | 7,249 | 2,284 | 31.5% |
| 50 | Chicago | 2,711,226 | 805,318 | 29.7% |
| 51 | Rolling Meadows | 24,027 | 7,021 | 29.2% |
| 52 | Bolingbrook | 74,096 | 21,446 | 28.9% |
| 53 | Alsip | 18,583 | 5,322 | 28.6% |
| 54 | Wheeling | 38,433 | 10,805 | 28.1% |
| 55 | Schiller Park | 11,393 | 3,160 | 27.7% |
| 56 | Bellwood | 18,256 | 4,936 | 27.0% |
| 57 | Crest Hill | 20,628 | 5,568 | 27.0% |
| 58 | Rochelle | 9,529 | 2,567 | 26.9% |
| 59 | Sterling | 14,717 | 3,945 | 26.8% |
| 60 | Westchester | 16,436 | 4,371 | 26.6% |
| 61 | Prospect Heights | 15,618 | 4,035 | 25.8% |
| 62 | Warrenville | 14,718 | 3,774 | 25.6% |
| 63 | Villa Park | 22,345 | 5,564 | 24.9% |
| 64 | Riverside | 9,039 | 2,219 | 24.5% |
| 65 | Kankakee | 23,996 | 5,878 | 24.5% |
| 66 | Gilberts | 8,606 | 2,099 | 24.4% |
| 67 | Oak Lawn | 56,861 | 13,665 | 24.0% |
| 68 | Broadview | 7,896 | 1,860 | 23.6% |
| 69 | Woodstock | 26,147 | 6,111 | 23.4% |
| 70 | Des Plaines | 59,156 | 13,649 | 23.1% |
| 71 | Rock Falls | 8,587 | 1,863 | 21.7% |
| 72 | Rockford | 147,521 | 31,816 | 21.6% |
| 73 | Chicago Ridge | 14,099 | 2,967 | 21.0% |
| 74 | Worth | 10,700 | 2,222 | 20.8% |
| 75 | Brookfield | 19,331 | 4,009 | 20.7% |
| 76 | North Aurora | 18,696 | 3,840 | 20.5% |
| 77 | South Elgin | 24,217 | 4,923 | 20.3% |
| 78 | Lake in the Hills | 28,800 | 5,852 | 20.3% |
| 79 | Rantoul | 12,421 | 2,499 | 20.1% |
| 80 | DeKalb | 40,443 | 8,058 | 19.9% |
| 81 | Moline | 42,197 | 8,335 | 19.8% |
| 82 | Steger | 9,418 | 1,857 | 19.7% |
| 83 | Yorkville | 23,617 | 4,575 | 19.4% |
| 84 | Palatine | 66,293 | 12,703 | 19.2% |
| 85 | Pontoon Beach | 6,025 | 1,145 | 19.0% |
| 86 | Countryside | 6,267 | 1,176 | 18.8% |
| 87 | Spring Valley | 5,476 | 1,019 | 18.6% |
| 88 | Wauconda | 14,027 | 2,607 | 18.6% |
| 89 | Harwood Heights | 8,821 | 1,634 | 18.5% |
| 90 | Carol Stream | 39,460 | 7,281 | 18.5% |
| 91 | Oak Forest | 26,805 | 4,932 | 18.4% |
| 92 | Genoa | 5,492 | 1,002 | 18.2% |
| 93 | Island Lake | 8,014 | 1,452 | 18.1% |
| 94 | Mount Prospect | 55,472 | 10,037 | 18.1% |
| 95 | Monmouth | 8,581 | 1,549 | 18.1% |
| 96 | Fox Lake | 11,131 | 2,008 | 18.0% |
| 97 | Justice | 12,324 | 2,219 | 18.0% |
| 98 | Lansing | 28,284 | 5,061 | 17.9% |
| 99 | Oswego | 36,375 | 6,507 | 17.9% |
| 100 | Markham | 11,355 | 2,025 | 17.8% |
Source: U.S. Census ACS 2020-2024. 324 cities with more than 5,000 residents.
Summary
Summary: Hispanic or Latino Populations Across Illinois
According to the most recent data, this is an accurate list if you’re looking for a breakdown of Latino populations for each place across Illinois.
The most Hispanic/Latino cities in Illinois are Cicero, Summit, Melrose Park, Stickney, Park City, Posen, Berwyn, Franklin Park, Northlake, and Waukegan.


