Batesville, IN
Demographics And Statistics
Living In Batesville, Indiana Summary
Life in Batesville research summary. HomeSnacks has been using Saturday Night Science to research the quality of life in Batesville over the past nine years using Census, FBI, Zillow, and other primary data sources. Based on the most recently available data, we found the following about life in Batesville:
The population in Batesville is 6,842.
The median home value in Batesville is $314,008.
The median income in Batesville is $66,806.
The cost of living in Batesville is 97 which is 1.0x lower than the national average.
The median rent in Batesville is $761.
The unemployment rate in Batesville is 3.7%.
The poverty rate in Batesville is 15.0%.
The average high in Batesville is 63.3° and the average low is 42.6°.
Table Of Contents
Batesville SnackAbility
Overall SnackAbility
Batesville, IN Cost Of Living
Cost of living in Batesville summary. We use data on the cost of living to determine how expensive it is to live in Batesville. Real estate prices drive most of the variance in cost of living around Indiana. Key points include:
The cost of living in Batesville is 97 with 100 being average.
The cost of living in Batesville is 1.0x lower than the national average.
The median home value in Batesville is $314,008.
The median income in Batesville is $66,806.
Batesville's Overall Cost Of Living
Lower Than The National Average
Cost Of Living In Batesville Comparison Table
| Living Expense | Batesville | Indiana | National Average | |
|---|---|---|---|---|
| Overall | 97 | 92 | 100 | |
| Services | 103 | 95 | 100 | |
| Groceries | 100 | 97 | 100 | |
| Health | 104 | 94 | 100 | |
| Housing | 81 | 73 | 100 | |
| Transportation | 101 | 94 | 100 | |
| Utilities | 98 | 107 | 100 | |
Batesville, IN Weather
The average high in Batesville is 63.3° and the average low is 42.6°.
There are 73.5 days of precipitation each year.
Expect an average of 44.2 inches of precipitation each year with 15.0 inches of snow.
| Stat | Batesville |
|---|---|
| Average Annual High | 63.3 |
| Average Annual Low | 42.6 |
| Annual Precipitation Days | 73.5 |
| Average Annual Precipitation | 44.2 |
| Average Annual Snowfall | 15.0 |
Average High
Days of Rain
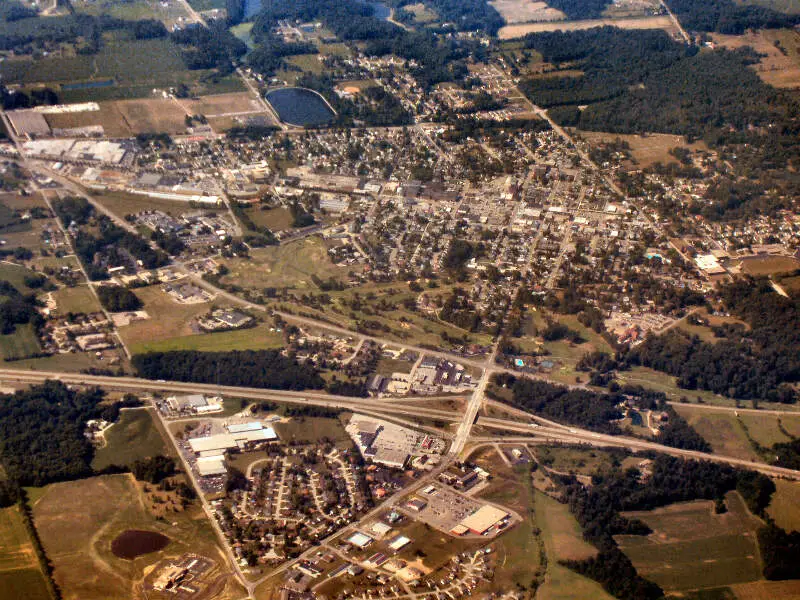
Batesville, IN Photos
Rankings for Batesville in Indiana


Locations Around Batesville
Map Of Batesville, IN
Best Places Around Batesville
Wyoming, OH
Population 8,712
Madeira, OH
Population 9,454
Dry Run, OH
Population 7,765
Montgomery, OH
Population 10,816
Mack, OH
Population 11,444
Covedale, OH
Population 6,306
Mason, OH
Population 35,148
Monfort Heights, OH
Population 12,203
Forestville, OH
Population 11,213
Batesville Demographics And Statistics
Population over time in Batesville
The current population in Batesville is 6,842. The population has increased 6.3% from 2010.
| Year | Population | % Change |
|---|---|---|
| 2023 | 6,842 | -3.0% |
| 2022 | 7,052 | -2.1% |
| 2021 | 7,204 | 3.7% |
| 2020 | 6,945 | 4.4% |
| 2019 | 6,651 | 1.5% |
| 2018 | 6,555 | 2.6% |
| 2017 | 6,389 | -0.4% |
| 2016 | 6,417 | 0.3% |
| 2015 | 6,398 | 0.0% |
| 2014 | 6,397 | -5.3% |
| 2013 | 6,753 | 0.4% |
| 2012 | 6,727 | 0.5% |
| 2011 | 6,694 | 4.0% |
| 2010 | 6,436 | - |
Race / Ethnicity in Batesville
Batesville is:
92.0% White with 6,292 White residents.
0.0% African American with 0 African American residents.
0.0% American Indian with 0 American Indian residents.
0.4% Asian with 25 Asian residents.
0.0% Hawaiian with 0 Hawaiian residents.
0.6% Other with 40 Other residents.
2.4% Two Or More with 162 Two Or More residents.
4.7% Hispanic with 323 Hispanic residents.
| Race | Batesville | IN | USA |
|---|---|---|---|
| White | 92.0% | 76.1% | 58.2% |
| African American | 0.0% | 9.1% | 12.0% |
| American Indian | 0.0% | 0.1% | 0.5% |
| Asian | 0.4% | 2.5% | 5.7% |
| Hawaiian | 0.0% | 0.0% | 0.2% |
| Other | 0.6% | 0.4% | 0.5% |
| Two Or More | 2.4% | 3.4% | 3.9% |
| Hispanic | 4.7% | 8.4% | 19.0% |
Gender in Batesville
Batesville is 50.4% female with 3,448 female residents.
Batesville is 49.6% male with 3,394 male residents.
| Gender | Batesville | IN | USA |
|---|---|---|---|
| Female | 50.4% | 50.4% | 50.5% |
| Male | 49.6% | 49.6% | 49.5% |
Highest level of educational attainment in Batesville for adults over 25
-2.0% of adults in Batesville completed < 9th grade.
4.0% of adults in Batesville completed 9-12th grade.
33.0% of adults in Batesville completed high school / ged.
27.0% of adults in Batesville completed some college.
10.0% of adults in Batesville completed associate's degree.
18.0% of adults in Batesville completed bachelor's degree.
8.0% of adults in Batesville completed master's degree.
1.0% of adults in Batesville completed professional degree.
1.0% of adults in Batesville completed doctorate degree.
| Education | Batesville | IN | USA |
|---|---|---|---|
| < 9th Grade | -2.0% | 3.0% | 5.0% |
| 9-12th Grade | 4.0% | 6.0% | 6.0% |
| High School / GED | 33.0% | 33.0% | 26.0% |
| Some College | 27.0% | 20.0% | 19.0% |
| Associate's Degree | 10.0% | 9.0% | 9.0% |
| Bachelor's Degree | 18.0% | 18.0% | 21.0% |
| Master's Degree | 8.0% | 8.0% | 10.0% |
| Professional Degree | 1.0% | 2.0% | 2.0% |
| Doctorate Degree | 1.0% | 1.0% | 2.0% |
Household Income For Batesville, Indiana
11.2% of households in Batesville earn Less than $10,000.
5.4% of households in Batesville earn $10,000 to $14,999.
4.0% of households in Batesville earn $15,000 to $24,999.
5.9% of households in Batesville earn $25,000 to $34,999.
10.4% of households in Batesville earn $35,000 to $49,999.
18.5% of households in Batesville earn $50,000 to $74,999.
13.3% of households in Batesville earn $75,000 to $99,999.
19.1% of households in Batesville earn $100,000 to $149,999.
6.7% of households in Batesville earn $150,000 to $199,999.
5.6% of households in Batesville earn $200,000 or more.
| Income | Batesville | IN | USA |
|---|---|---|---|
| Less than $10,000 | 11.2% | 4.9% | 4.9% |
| $10,000 to $14,999 | 5.4% | 3.5% | 3.6% |
| $15,000 to $24,999 | 4.0% | 7.1% | 6.6% |
| $25,000 to $34,999 | 5.9% | 7.8% | 6.8% |
| $35,000 to $49,999 | 10.4% | 12.2% | 10.4% |
| $50,000 to $74,999 | 18.5% | 17.9% | 15.7% |
| $75,000 to $99,999 | 13.3% | 13.9% | 12.7% |
| $100,000 to $149,999 | 19.1% | 17.2% | 17.4% |
| $150,000 to $199,999 | 6.7% | 7.9% | 9.3% |
| $200,000 or more | 5.6% | 7.6% | 12.6% |


