Munster, IN
Demographics And Statistics
Living In Munster, Indiana Summary
Life in Munster research summary. HomeSnacks has been using Saturday Night Science to research the quality of life in Munster over the past nine years using Census, FBI, Zillow, and other primary data sources. Based on the most recently available data, we found the following about life in Munster:
The population in Munster is 23,733.
The median home value in Munster is $350,123.
The median income in Munster is $105,764.
The cost of living in Munster is 110 which is 1.1x higher than the national average.
The median rent in Munster is $1,480.
The unemployment rate in Munster is 5.3%.
The poverty rate in Munster is 7.3%.
The average high in Munster is 59.8° and the average low is 41.8°.
Munster SnackAbility
Overall SnackAbility
Munster, IN Crime Report
Crime in Munster summary. We use data from the FBI to determine the crime rates in Munster. Key points include:
There were 254 total crimes in Munster in the last reporting year.
The overall crime rate per 100,000 people in Munster is 1,079.7 / 100k people.
The violent crime rate per 100,000 people in Munster is 51.0 / 100k people.
The property crime rate per 100,000 people in Munster is 1,028.7 / 100k people.
Overall, crime in Munster is -49.05% below the national average.
Total Crimes
Below National Average
Crime In Munster Comparison Table
| Statistic | Count Raw |
Munster / 100k People |
Indiana / 100k People |
National / 100k People |
|---|---|---|---|---|
| Total Crimes Per 100K | 254 | 1,079.7 | 1,691.5 | 2,119.2 |
| Violent Crime | 12 | 51.0 | 312.9 | 359.0 |
| Murder | 0 | 0.0 | 5.5 | 5.0 |
| Robbery | 4 | 17.0 | 34.5 | 61.0 |
| Aggravated Assault | 8 | 34.0 | 239.4 | 256.0 |
| Property Crime | 242 | 1,028.7 | 1,378.6 | 1,760.0 |
| Burglary | 8 | 34.0 | 176.8 | 229.0 |
| Larceny | 223 | 948.0 | 988.8 | 1,272.0 |
| Car Theft | 11 | 46.8 | 213.0 | 259.0 |
Munster, IN Cost Of Living
Cost of living in Munster summary. We use data on the cost of living to determine how expensive it is to live in Munster. Real estate prices drive most of the variance in cost of living around Indiana. Key points include:
The cost of living in Munster is 110 with 100 being average.
The cost of living in Munster is 1.1x higher than the national average.
The median home value in Munster is $350,123.
The median income in Munster is $105,764.
Munster's Overall Cost Of Living
Higher Than The National Average
Cost Of Living In Munster Comparison Table
| Living Expense | Munster | Indiana | National Average | |
|---|---|---|---|---|
| Overall | 110 | 92 | 100 | |
| Services | 108 | 95 | 100 | |
| Groceries | 102 | 97 | 100 | |
| Health | 109 | 94 | 100 | |
| Housing | 121 | 73 | 100 | |
| Transportation | 108 | 94 | 100 | |
| Utilities | 91 | 107 | 100 | |
Munster, IN Weather
The average high in Munster is 59.8° and the average low is 41.8°.
There are 74.5 days of precipitation each year.
Expect an average of 38.5 inches of precipitation each year with 30.6 inches of snow.
| Stat | Munster |
|---|---|
| Average Annual High | 59.8 |
| Average Annual Low | 41.8 |
| Annual Precipitation Days | 74.5 |
| Average Annual Precipitation | 38.5 |
| Average Annual Snowfall | 30.6 |
Average High
Days of Rain
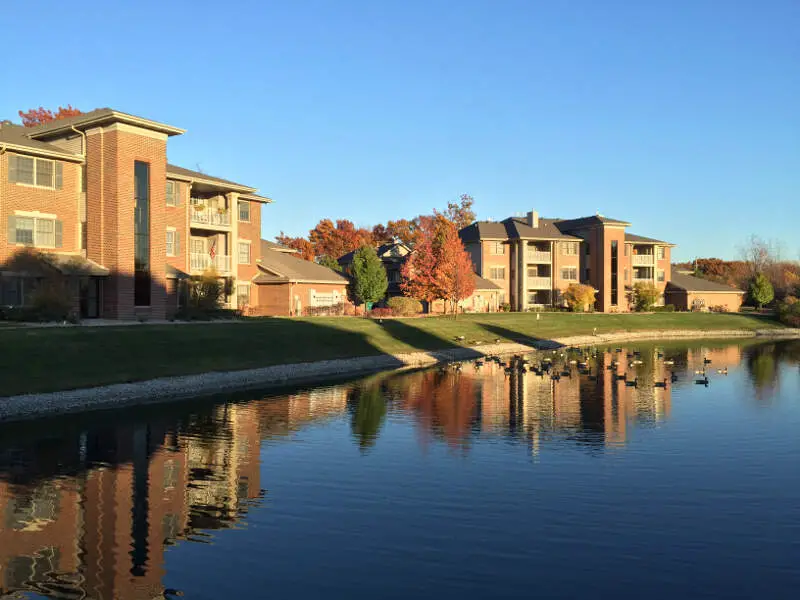
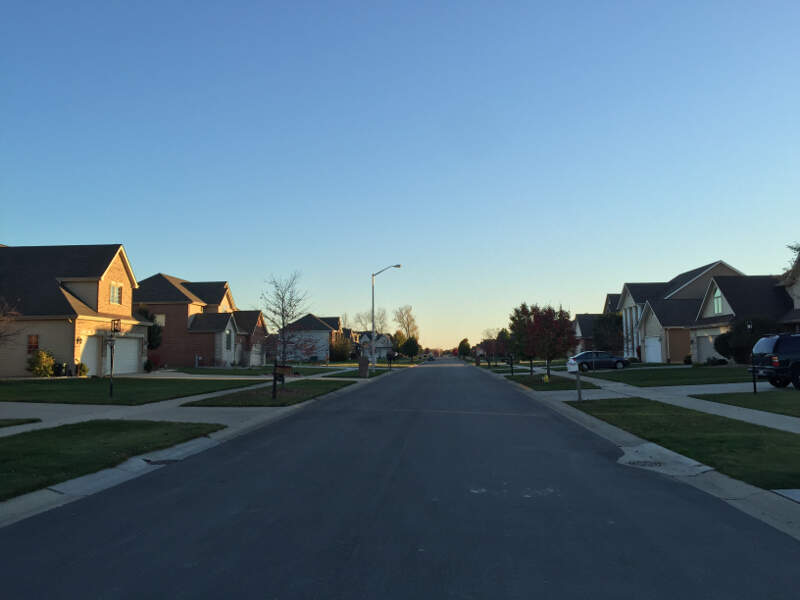
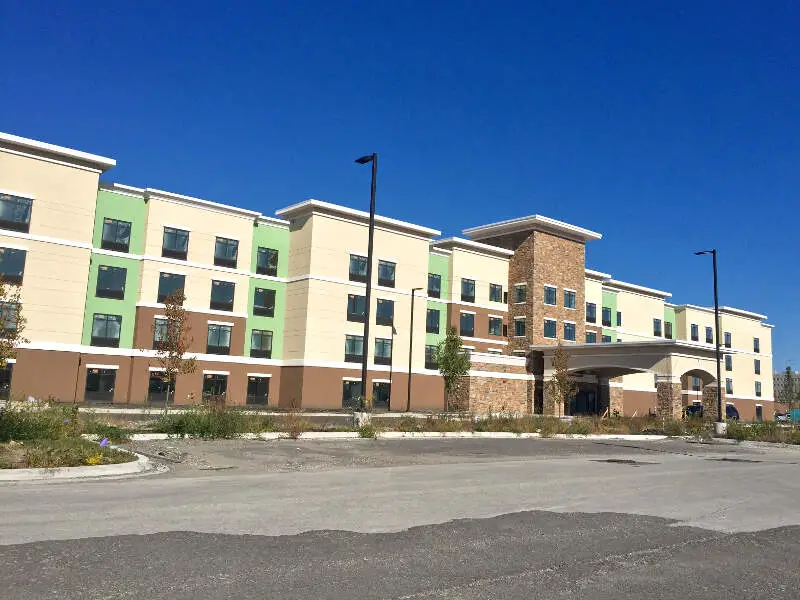
Munster, IN Photos


1 Reviews & Comments About Munster
/5

HomeSnacks User - 2018-07-16 17:14:29.557525
Thank you for recognizing Munster as one of the best places to live in Indiana. We agree and many more agree, also.
We are experiencing substantial growth, primarily as residents of the Chicago area flee the high taxes, high insurance, and corrupt government in Illinois.
Rankings for Munster in Indiana


Locations Around Munster
Map Of Munster, IN
Best Places Around Munster
Tinley Park, IL
Population 55,007
Flossmoor, IL
Population 9,666
Palos Heights, IL
Population 11,817
Orland Park, IL
Population 57,961
Orland Hills, IL
Population 6,758
Oak Forest, IL
Population 26,888
Frankfort Square, IL
Population 9,777
Mokena, IL
Population 19,906
Palos Hills, IL
Population 18,139
Worth, IL
Population 10,731
Munster Demographics And Statistics
Population over time in Munster
The current population in Munster is 23,733. The population has increased 2.1% from 2010.
| Year | Population | % Change |
|---|---|---|
| 2023 | 23,733 | 0.0% |
| 2022 | 23,731 | 0.1% |
| 2021 | 23,717 | 4.9% |
| 2020 | 22,604 | -0.4% |
| 2019 | 22,689 | -0.7% |
| 2018 | 22,840 | -0.7% |
| 2017 | 23,005 | -0.4% |
| 2016 | 23,103 | -0.6% |
| 2015 | 23,250 | -0.3% |
| 2014 | 23,325 | -0.5% |
| 2013 | 23,445 | -0.1% |
| 2012 | 23,460 | 0.2% |
| 2011 | 23,406 | 0.7% |
| 2010 | 23,254 | - |
Race / Ethnicity in Munster
Munster is:
70.9% White with 16,837 White residents.
6.8% African American with 1,603 African American residents.
0.4% American Indian with 95 American Indian residents.
6.4% Asian with 1,516 Asian residents.
0.0% Hawaiian with 0 Hawaiian residents.
0.1% Other with 12 Other residents.
1.3% Two Or More with 320 Two Or More residents.
14.1% Hispanic with 3,350 Hispanic residents.
| Race | Munster | IN | USA |
|---|---|---|---|
| White | 70.9% | 76.1% | 58.2% |
| African American | 6.8% | 9.1% | 12.0% |
| American Indian | 0.4% | 0.1% | 0.5% |
| Asian | 6.4% | 2.5% | 5.7% |
| Hawaiian | 0.0% | 0.0% | 0.2% |
| Other | 0.1% | 0.4% | 0.5% |
| Two Or More | 1.3% | 3.4% | 3.9% |
| Hispanic | 14.1% | 8.4% | 19.0% |
Gender in Munster
Munster is 51.6% female with 12,244 female residents.
Munster is 48.4% male with 11,488 male residents.
| Gender | Munster | IN | USA |
|---|---|---|---|
| Female | 51.6% | 50.4% | 50.5% |
| Male | 48.4% | 49.6% | 49.5% |
Highest level of educational attainment in Munster for adults over 25
0.0% of adults in Munster completed < 9th grade.
2.0% of adults in Munster completed 9-12th grade.
23.0% of adults in Munster completed high school / ged.
16.0% of adults in Munster completed some college.
10.0% of adults in Munster completed associate's degree.
31.0% of adults in Munster completed bachelor's degree.
13.0% of adults in Munster completed master's degree.
3.0% of adults in Munster completed professional degree.
2.0% of adults in Munster completed doctorate degree.
| Education | Munster | IN | USA |
|---|---|---|---|
| < 9th Grade | 0.0% | 3.0% | 5.0% |
| 9-12th Grade | 2.0% | 6.0% | 6.0% |
| High School / GED | 23.0% | 33.0% | 26.0% |
| Some College | 16.0% | 20.0% | 19.0% |
| Associate's Degree | 10.0% | 9.0% | 9.0% |
| Bachelor's Degree | 31.0% | 18.0% | 21.0% |
| Master's Degree | 13.0% | 8.0% | 10.0% |
| Professional Degree | 3.0% | 2.0% | 2.0% |
| Doctorate Degree | 2.0% | 1.0% | 2.0% |
Household Income For Munster, Indiana
4.9% of households in Munster earn Less than $10,000.
1.2% of households in Munster earn $10,000 to $14,999.
3.6% of households in Munster earn $15,000 to $24,999.
5.7% of households in Munster earn $25,000 to $34,999.
9.3% of households in Munster earn $35,000 to $49,999.
11.2% of households in Munster earn $50,000 to $74,999.
12.6% of households in Munster earn $75,000 to $99,999.
19.4% of households in Munster earn $100,000 to $149,999.
16.2% of households in Munster earn $150,000 to $199,999.
15.8% of households in Munster earn $200,000 or more.
| Income | Munster | IN | USA |
|---|---|---|---|
| Less than $10,000 | 4.9% | 4.9% | 4.9% |
| $10,000 to $14,999 | 1.2% | 3.5% | 3.6% |
| $15,000 to $24,999 | 3.6% | 7.1% | 6.6% |
| $25,000 to $34,999 | 5.7% | 7.8% | 6.8% |
| $35,000 to $49,999 | 9.3% | 12.2% | 10.4% |
| $50,000 to $74,999 | 11.2% | 17.9% | 15.7% |
| $75,000 to $99,999 | 12.6% | 13.9% | 12.7% |
| $100,000 to $149,999 | 19.4% | 17.2% | 17.4% |
| $150,000 to $199,999 | 16.2% | 7.9% | 9.3% |
| $200,000 or more | 15.8% | 7.6% | 12.6% |


