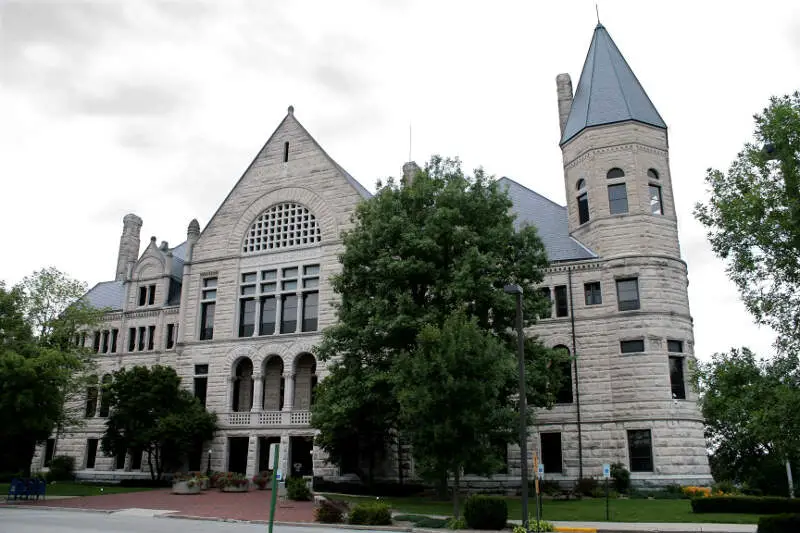
Richmond, IN
Demographics And Statistics
Living In Richmond, Indiana Summary
Life in Richmond research summary. HomeSnacks has been using Saturday Night Science to research the quality of life in Richmond over the past nine years using Census, FBI, Zillow, and other primary data sources. Based on the most recently available data, we found the following about life in Richmond:
The population in Richmond is 35,551.
The median home value in Richmond is $151,962.
The median income in Richmond is $46,395.
The cost of living in Richmond is 82 which is 0.8x lower than the national average.
The median rent in Richmond is $815.
The unemployment rate in Richmond is 7.2%.
The poverty rate in Richmond is 23.2%.
The average high in Richmond is 60.9° and the average low is 40.6°.
Table Of Contents
Richmond SnackAbility
Overall SnackAbility
Richmond, IN Cost Of Living
Cost of living in Richmond summary. We use data on the cost of living to determine how expensive it is to live in Richmond. Real estate prices drive most of the variance in cost of living around Indiana. Key points include:
The cost of living in Richmond is 82 with 100 being average.
The cost of living in Richmond is 0.8x lower than the national average.
The median home value in Richmond is $151,962.
The median income in Richmond is $46,395.
Richmond's Overall Cost Of Living
Lower Than The National Average
Cost Of Living In Richmond Comparison Table
| Living Expense | Richmond | Indiana | National Average | |
|---|---|---|---|---|
| Overall | 82 | 92 | 100 | |
| Services | 87 | 95 | 100 | |
| Groceries | 96 | 97 | 100 | |
| Health | 83 | 94 | 100 | |
| Housing | 54 | 73 | 100 | |
| Transportation | 94 | 94 | 100 | |
| Utilities | 98 | 107 | 100 | |
Richmond, IN Weather
The average high in Richmond is 60.9° and the average low is 40.6°.
There are 78.6 days of precipitation each year.
Expect an average of 41.6 inches of precipitation each year with 19.3 inches of snow.
| Stat | Richmond |
|---|---|
| Average Annual High | 60.9 |
| Average Annual Low | 40.6 |
| Annual Precipitation Days | 78.6 |
| Average Annual Precipitation | 41.6 |
| Average Annual Snowfall | 19.3 |
Average High
Days of Rain
Richmond, IN Photos


Richmond Articles

Rankings for Richmond in Indiana


Locations Around Richmond
Map Of Richmond, IN
Best Places Around Richmond
Wyoming, OH
Population 8,712
Montgomery, OH
Population 10,816
Mack, OH
Population 11,444
Mason, OH
Population 35,148
Monfort Heights, OH
Population 12,203
Springboro, OH
Population 19,577
Landen, OH
Population 8,041
Blue Ash, OH
Population 13,374
Bridgetown, OH
Population 13,830
Dent, OH
Population 12,097
Richmond Demographics And Statistics
Population over time in Richmond
The current population in Richmond is 35,551. The population has decreased -4.2% from 2010.
| Year | Population | % Change |
|---|---|---|
| 2023 | 35,551 | -0.3% |
| 2022 | 35,642 | -0.6% |
| 2021 | 35,854 | 1.1% |
| 2020 | 35,467 | -0.2% |
| 2019 | 35,539 | -0.3% |
| 2018 | 35,653 | -0.5% |
| 2017 | 35,819 | -0.7% |
| 2016 | 36,082 | -0.6% |
| 2015 | 36,291 | -0.6% |
| 2014 | 36,527 | -0.5% |
| 2013 | 36,727 | -0.3% |
| 2012 | 36,836 | -0.3% |
| 2011 | 36,939 | -0.5% |
| 2010 | 37,125 | - |
Race / Ethnicity in Richmond
Richmond is:
79.3% White with 28,201 White residents.
6.6% African American with 2,348 African American residents.
0.0% American Indian with 15 American Indian residents.
1.7% Asian with 611 Asian residents.
0.0% Hawaiian with 5 Hawaiian residents.
0.5% Other with 172 Other residents.
6.6% Two Or More with 2,352 Two Or More residents.
5.2% Hispanic with 1,847 Hispanic residents.
| Race | Richmond | IN | USA |
|---|---|---|---|
| White | 79.3% | 76.1% | 58.2% |
| African American | 6.6% | 9.1% | 12.0% |
| American Indian | 0.0% | 0.1% | 0.5% |
| Asian | 1.7% | 2.5% | 5.7% |
| Hawaiian | 0.0% | 0.0% | 0.2% |
| Other | 0.5% | 0.4% | 0.5% |
| Two Or More | 6.6% | 3.4% | 3.9% |
| Hispanic | 5.2% | 8.4% | 19.0% |
Gender in Richmond
Richmond is 52.0% female with 18,486 female residents.
Richmond is 48.0% male with 17,065 male residents.
| Gender | Richmond | IN | USA |
|---|---|---|---|
| Female | 52.0% | 50.4% | 50.5% |
| Male | 48.0% | 49.6% | 49.5% |
Highest level of educational attainment in Richmond for adults over 25
5.0% of adults in Richmond completed < 9th grade.
9.0% of adults in Richmond completed 9-12th grade.
34.0% of adults in Richmond completed high school / ged.
23.0% of adults in Richmond completed some college.
9.0% of adults in Richmond completed associate's degree.
12.0% of adults in Richmond completed bachelor's degree.
5.0% of adults in Richmond completed master's degree.
2.0% of adults in Richmond completed professional degree.
1.0% of adults in Richmond completed doctorate degree.
| Education | Richmond | IN | USA |
|---|---|---|---|
| < 9th Grade | 5.0% | 3.0% | 5.0% |
| 9-12th Grade | 9.0% | 6.0% | 6.0% |
| High School / GED | 34.0% | 33.0% | 26.0% |
| Some College | 23.0% | 20.0% | 19.0% |
| Associate's Degree | 9.0% | 9.0% | 9.0% |
| Bachelor's Degree | 12.0% | 18.0% | 21.0% |
| Master's Degree | 5.0% | 8.0% | 10.0% |
| Professional Degree | 2.0% | 2.0% | 2.0% |
| Doctorate Degree | 1.0% | 1.0% | 2.0% |
Household Income For Richmond, Indiana
8.8% of households in Richmond earn Less than $10,000.
7.0% of households in Richmond earn $10,000 to $14,999.
12.2% of households in Richmond earn $15,000 to $24,999.
11.9% of households in Richmond earn $25,000 to $34,999.
13.2% of households in Richmond earn $35,000 to $49,999.
15.9% of households in Richmond earn $50,000 to $74,999.
13.6% of households in Richmond earn $75,000 to $99,999.
11.6% of households in Richmond earn $100,000 to $149,999.
2.8% of households in Richmond earn $150,000 to $199,999.
3.0% of households in Richmond earn $200,000 or more.
| Income | Richmond | IN | USA |
|---|---|---|---|
| Less than $10,000 | 8.8% | 4.9% | 4.9% |
| $10,000 to $14,999 | 7.0% | 3.5% | 3.6% |
| $15,000 to $24,999 | 12.2% | 7.1% | 6.6% |
| $25,000 to $34,999 | 11.9% | 7.8% | 6.8% |
| $35,000 to $49,999 | 13.2% | 12.2% | 10.4% |
| $50,000 to $74,999 | 15.9% | 17.9% | 15.7% |
| $75,000 to $99,999 | 13.6% | 13.9% | 12.7% |
| $100,000 to $149,999 | 11.6% | 17.2% | 17.4% |
| $150,000 to $199,999 | 2.8% | 7.9% | 9.3% |
| $200,000 or more | 3.0% | 7.6% | 12.6% |


