We used Saturday Night Science to analyze Kentucky’s most recent Census data to determine the divorce rate for each city in Kentucky based on the percentage of currently divorced residents.
The city with the highest divorce rate in Kentucky is Glasgow, with 15.0% of people over 15 years of age being divorced, per the most recent census data. The city with the lowest divorce rate in Kentucky is Oak Grove.
Kentucky is 8.0% divorced overall. There are some 290,228 people living in Kentucky over fifteen years of age who are divorced. You can compare that to the 28,339,199 Americans who are currently divorced.
Isn’t the divorce rate in America close to 50%? Yes indeed. But we’re measuring something else; we are looking at counts and percentages of people over 15 years old who are currently divorced. That 50% statistic is for the percentage of people who have ever been divorced.
So now that we have you biting your nails, rethinking your worldview, and pulling out your hair, let’s look at the places in Kentucky with the highest rates of divorcees.
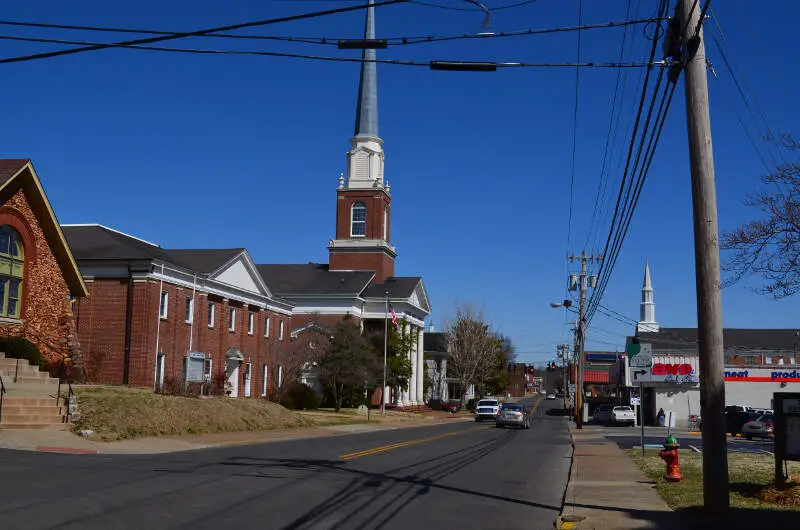
15.0% divorced · #2 highest divorce rate in Kentucky
 Located in
Barren County, Kentucky
Located in
Barren County, Kentucky
Glasgow is a home rule-class city in Barren County, Kentucky, in the United States. It is the seat of its county. The population was 14,028 at the 2010 U.S. census. The city is well known for its annual Scottish Highland Games. In 2007, Barren County was named the number one rural place to live by The Progressive Farmer magazine. Glasgow is the principal city of the Glasgow micropolitan area, which comprises Barren and Metcalfe counties.
Data | Crime | Cost of living | Movers
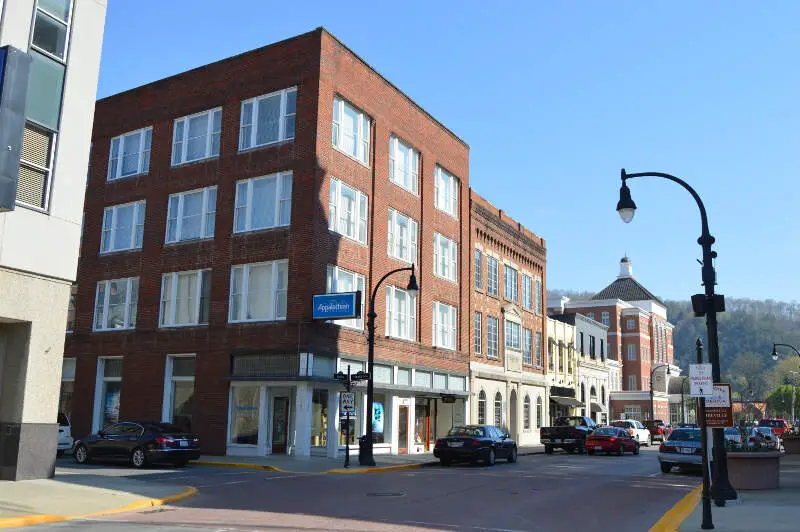
15.0% divorced · #2 highest divorce rate in Kentucky
 Located in
Pike County, Kentucky
Located in
Pike County, Kentucky
Pikeville is a city in and the county seat of Pike County, Kentucky, United States. During the 2010 U.S. Census, the population within Pikeville’s city limits was 6,903. In Kentucky’s current city classification system, Pikeville is a home rule-class city, a category that includes all of the state’s more than 400 cities except for the two largest, Louisville and Lexington.
Data | Crime | Cost of living | Movers
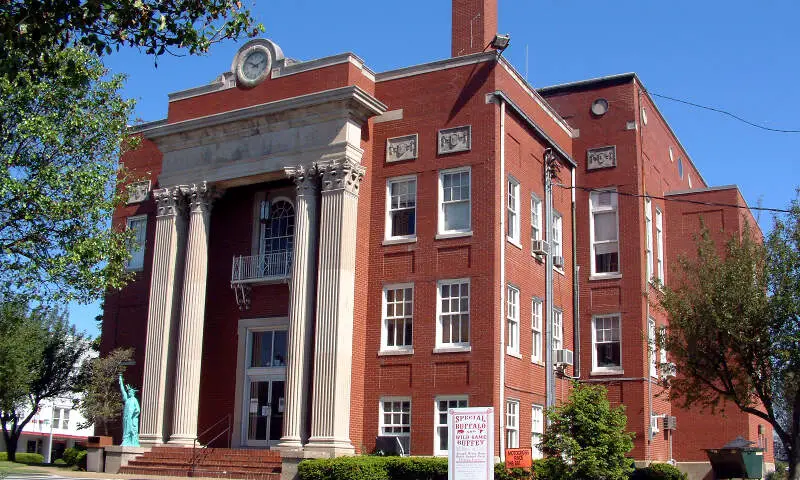
15.0% divorced · #2 highest divorce rate in Kentucky
 Located in
Grayson County, Kentucky
Located in
Grayson County, Kentucky
Leitchfield is the county seat of Grayson County, Kentucky, United States. Leitchfield is a home rule-class city with a population of 6,699 as of the 2010 census.
Data | Crime | Cost of living | Movers
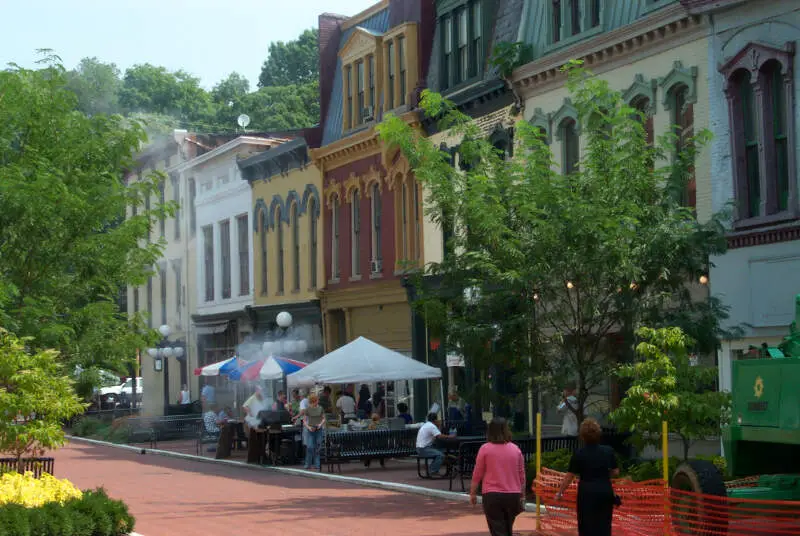
14.0% divorced · #4 highest divorce rate in Kentucky
 Located in
Franklin County, Kentucky
Located in
Franklin County, Kentucky
Frankfort is the capital city of the Commonwealth of Kentucky and the seat of Franklin County. It is a home rule-class city in Kentucky; the population was 25,527 at the 2010 census. Located along the Kentucky River, Frankfort is the principal city of the Frankfort, Kentucky Micropolitan Statistical Area, which includes all of Franklin and Anderson counties.
Data | Crime | Cost of living | Movers
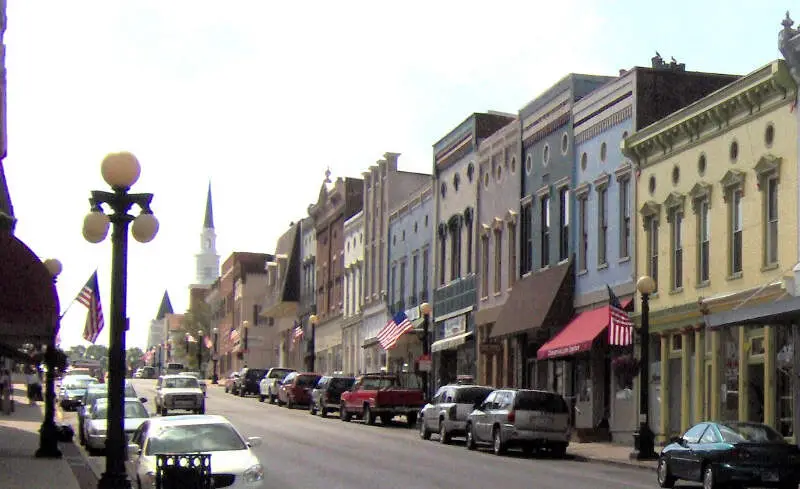
13.0% divorced · #6 highest divorce rate in Kentucky
 Located in
Mercer County, Kentucky
Located in
Mercer County, Kentucky
Harrodsburg is a home rule-class city in Mercer County, Kentucky, in the United States. It is the seat of its county. The population was 8,340 at the 2010 census.
Data | Crime | Cost of living | Movers
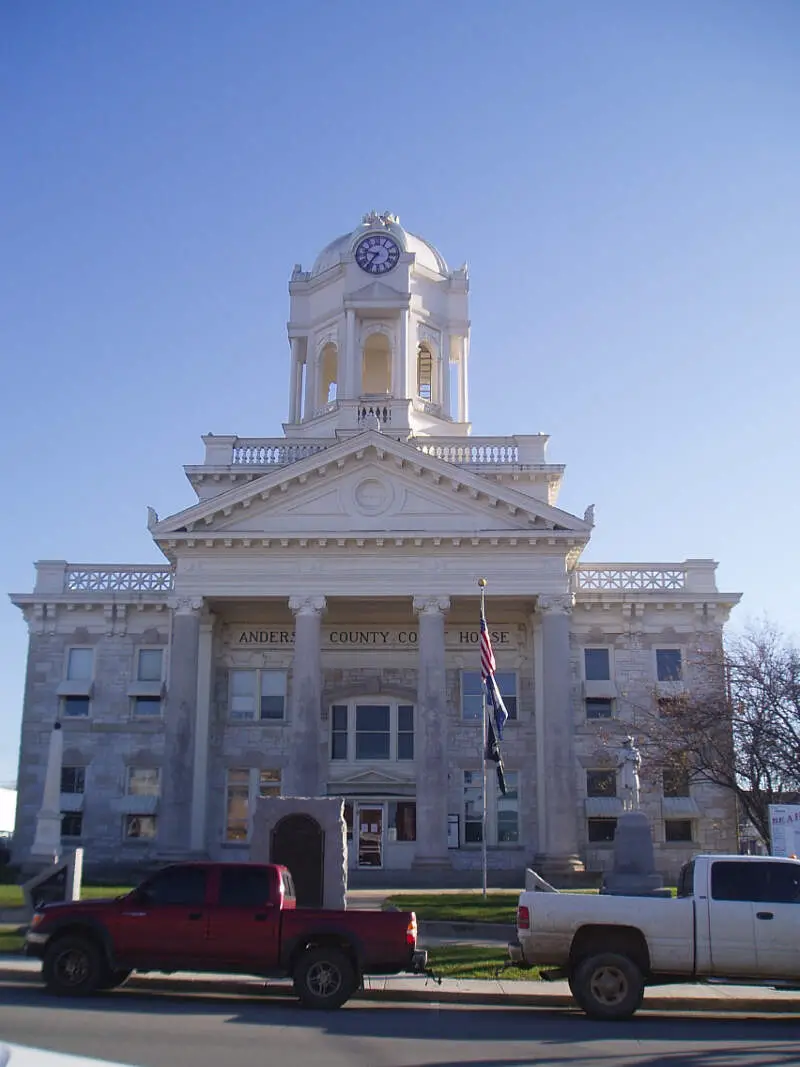
13.0% divorced · #6 highest divorce rate in Kentucky
 Located in
Anderson County, Kentucky
Located in
Anderson County, Kentucky
Lawrenceburg is a home rule-class city in Anderson County, Kentucky, United States. The population was 10,505 at the 2010 census. It is the seat of its county. Lawrenceburg is part of the Frankfort, Kentucky, micropolitan statistical area.
Data | Crime | Cost of living | Movers
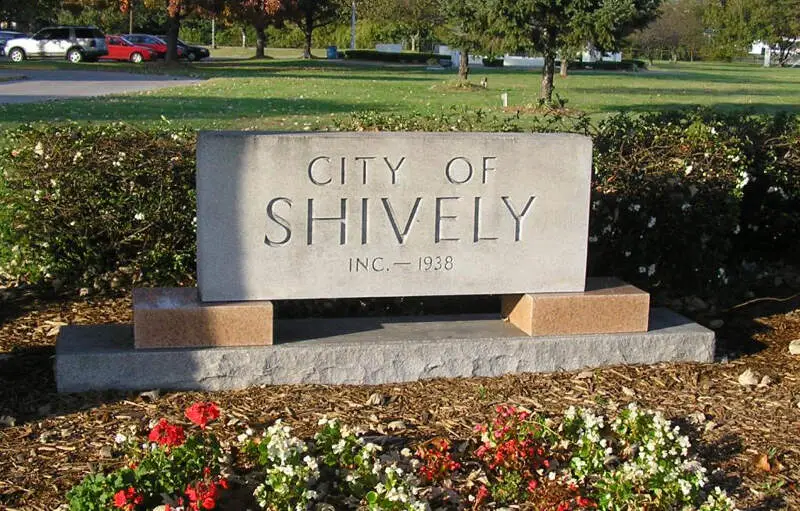
13.0% divorced · #6 highest divorce rate in Kentucky
 Located in
Jefferson County, Kentucky
Located in
Jefferson County, Kentucky
Shively is a home rule-class city in Jefferson County, Kentucky, United States and a suburb of Louisville within the Louisville Metro government. As of the 2010 Census, the city’s population was 15,264, reflecting an increase of 107 from 15,157 in 2000.
Data | Crime | Cost of living | Movers
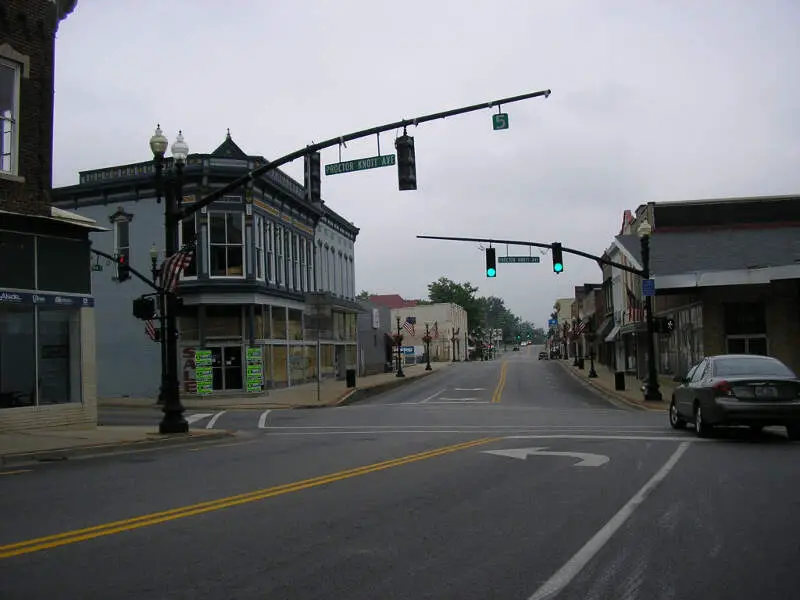
13.0% divorced · #6 highest divorce rate in Kentucky
 Located in
Marion County, Kentucky
Located in
Marion County, Kentucky
Lebanon is a home rule-class city in Marion County, Kentucky, in the United States. The population was 6,331 at the 2010 census. It is the seat of its county. Lebanon is located in central Kentucky, southeast of Louisville. A national cemetery is located nearby.
Data | Crime | Cost of living | Movers
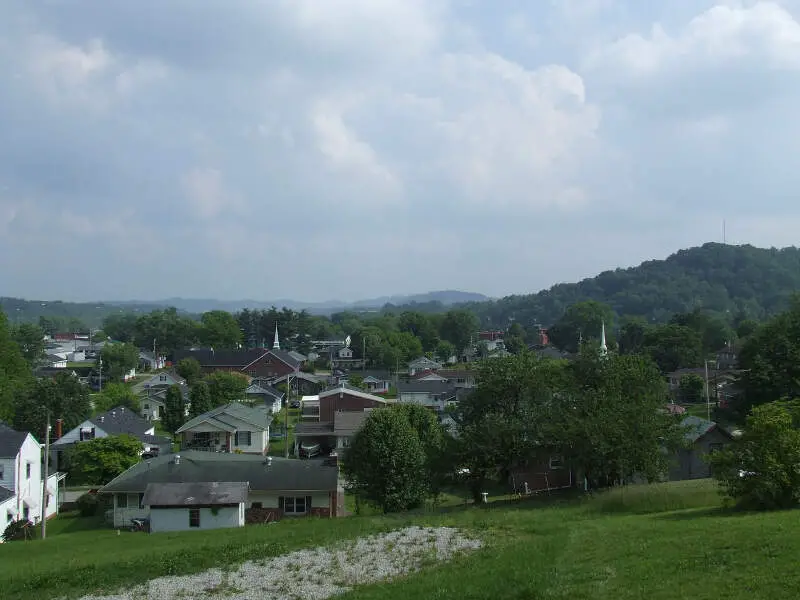
12.0% divorced · #12 highest divorce rate in Kentucky
 Located in
Whitley County, Kentucky
Located in
Whitley County, Kentucky
Corbin is a home rule-class city in Whitley and Knox counties in the southeastern portion of the U.S. state of Kentucky. The urbanized area around Corbin extends into Laurel County; this area is not incorporated into the city limits due to a state law prohibiting cities from being in more than two counties. However, this area is served by some of the city’s public services. As of the 2010 census, the city population was 7,304, with 21,132 living in the “urban cluster” that includes Corbin and North Corbin.
Data | Crime | Cost of living | Movers
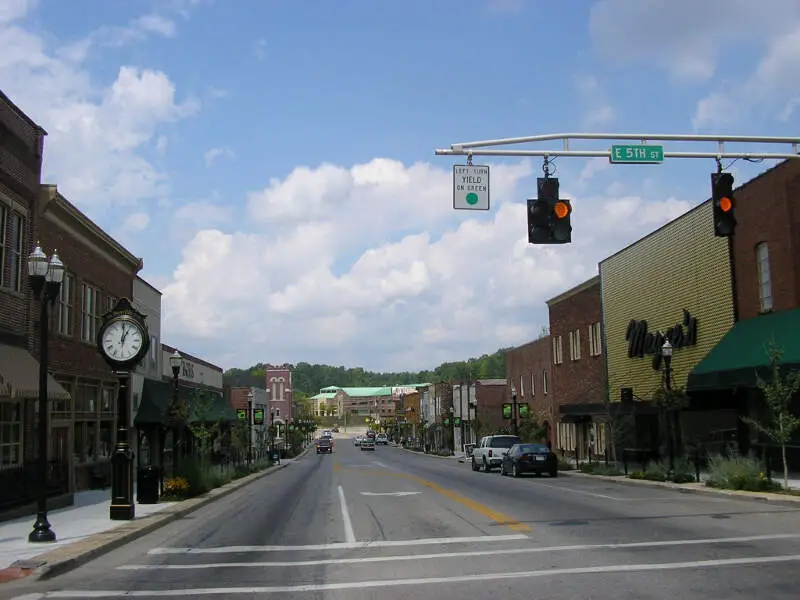
12.0% divorced · #12 highest divorce rate in Kentucky
 Located in
Laurel County, Kentucky
Located in
Laurel County, Kentucky
London is a home rule-class city in Laurel County, Kentucky, in the United States. It is the seat of its county. The population was 7,993 at the time of the 2010 U.S. census. London, Kentucky, is the second-largest city named London in the United States and the fourth-largest in the world. It is part of the London, Kentucky micropolitan area. Of the seventeen micropolitan areas in Kentucky, London is the largest; the London micropolitan area’s 2010 Census population was 126,369. London is also home to the annual World Chicken Festival that celebrates the life of Colonel Sanders and features the world’s largest skillet.
Data | Crime | Cost of living | Movers
The receipts
Compare the top ten
Pick a metric. The bars rescale. The red line is Kentucky’s statewide median.
Kentucky statewide median: $63,726
On the map
Where Kentucky’s highest divorce rates are
Saturday Night Science
How We Determined The Places In Kentucky That Get Un-Hitched The Most
We used Saturday Night Science to look at the U.S. Census Bureau on divorce rates. Because who likes tracking misery more than the U.S. government?
Specifically, we looked at the 2020-2024 American Community Survey table S1201 — Marital Status. Pretty straightforward on that front — we just had to extract the following column of data:
Today, the analysis focuses on the 80 places in Kentucky with a population of over 5,000.
- Population 15 Years and Over -> Divorced
We ranked each place by the percentage of divorcees over 15 years of age from highest to lowest. We crowned the divorce capital of Kentucky the place with the highest incidence of divorcees, Glasgow.
And if you’re trying to avoid divorce, check out Oak Grove, the city with the lowest divorce rate in Kentucky. We updated this article for 2026 and this list is our eleventh time ranking the cities in Kentucky with the highest divorce rates.
The full plate
Cities With The Highest Divorce Rates In Kentucky
Click any column to sort. Search by city name.
| Rank | City | Population | Divorcees | Divorce Rate |
|---|---|---|---|---|
| 2 | Glasgow | 15,197 | 1,824 | 15.0% |
| 2 | Pikeville | 7,490 | 899 | 15.0% |
| 2 | Leitchfield | 6,819 | 818 | 15.0% |
| 4 | Frankfort | 28,503 | 3,192 | 14.0% |
| 6 | Harrodsburg | 9,313 | 969 | 13.0% |
| 6 | Lawrenceburg | 11,943 | 1,242 | 13.0% |
| 6 | Shively | 15,638 | 1,626 | 13.0% |
| 6 | Lebanon | 6,430 | 669 | 13.0% |
| 12 | Corbin | 8,246 | 792 | 12.0% |
| 12 | London | 7,561 | 726 | 12.0% |
| 12 | Madisonville | 19,515 | 1,873 | 12.0% |
| 12 | Winchester | 19,213 | 1,844 | 12.0% |
| 12 | Somerset | 12,216 | 1,173 | 12.0% |
| 12 | Hillview | 8,797 | 845 | 12.0% |
| 12 | Owensboro | 60,302 | 5,789 | 12.0% |
| 12 | Cynthiana | 6,458 | 620 | 12.0% |
| 22 | Russellville | 7,316 | 644 | 11.0% |
| 22 | Middlesborough | 9,123 | 803 | 11.0% |
| 22 | Hopkinsville | 30,906 | 2,720 | 11.0% |
| 22 | Hazard | 5,008 | 441 | 11.0% |
| 22 | Danville | 17,327 | 1,525 | 11.0% |
| 22 | Mount Sterling | 7,551 | 664 | 11.0% |
| 22 | Shepherdsville | 14,533 | 1,279 | 11.0% |
| 22 | Berea | 15,786 | 1,389 | 11.0% |
| 22 | Versailles | 10,492 | 923 | 11.0% |
| 22 | Paris | 10,160 | 894 | 11.0% |
| 22 | Campbellsville | 11,622 | 1,023 | 11.0% |
| 30 | Walton | 5,730 | 458 | 10.0% |
| 30 | Mayfield | 9,868 | 789 | 10.0% |
| 30 | Ashland | 21,295 | 1,704 | 10.0% |
| 30 | Mount Washington | 18,480 | 1,478 | 10.0% |
| 30 | Bardstown | 13,804 | 1,104 | 10.0% |
| 30 | Henderson | 27,852 | 2,228 | 10.0% |
| 37 | Lyndon | 11,030 | 794 | 9.0% |
| 37 | Monticello | 5,753 | 414 | 9.0% |
| 37 | Nicholasville | 32,197 | 2,318 | 9.0% |
| 37 | Bellevue | 5,636 | 406 | 9.0% |
| 37 | Maysville | 8,737 | 629 | 9.0% |
| 37 | Florence | 32,803 | 2,362 | 9.0% |
| 37 | Erlanger | 19,875 | 1,431 | 9.0% |
| 37 | Fort Mitchell | 8,713 | 627 | 9.0% |
| 45 | Franklin | 10,360 | 663 | 8.0% |
| 45 | Louisville/Jefferson County metro government (balance) | 631,818 | 40,436 | 8.0% |
| 45 | Paducah | 26,845 | 1,718 | 8.0% |
| 45 | Georgetown | 39,117 | 2,503 | 8.0% |
| 45 | Richmond | 37,111 | 2,375 | 8.0% |
| 45 | Covington | 41,110 | 2,631 | 8.0% |
| 45 | Douglass Hills | 5,474 | 350 | 8.0% |
| 45 | Newport | 13,967 | 894 | 8.0% |
| 54 | Dayton | 5,743 | 322 | 7.0% |
| 54 | Central City | 5,707 | 320 | 7.0% |
| 54 | St. Matthews | 17,577 | 984 | 7.0% |
| 54 | Lexington-Fayette urban county | 323,725 | 18,129 | 7.0% |
| 54 | Princeton | 6,241 | 349 | 7.0% |
| 54 | Crestwood | 6,356 | 356 | 7.0% |
| 54 | La Grange | 10,311 | 577 | 7.0% |
| 54 | Flatwoods | 7,269 | 407 | 7.0% |
| 54 | Jeffersontown | 29,199 | 1,635 | 7.0% |
| 54 | Shelbyville | 17,668 | 989 | 7.0% |
| 61 | Murray | 18,080 | 868 | 6.0% |
| 61 | Bowling Green | 75,388 | 3,619 | 6.0% |
| 61 | Alexandria | 10,562 | 507 | 6.0% |
| 61 | Elizabethtown | 32,576 | 1,564 | 6.0% |
| 68 | Independence | 29,392 | 1,176 | 5.0% |
| 68 | Middletown | 9,763 | 391 | 5.0% |
| 68 | Radcliff | 22,864 | 915 | 5.0% |
| 68 | Vine Grove | 6,830 | 273 | 5.0% |
| 68 | Cold Spring | 6,341 | 254 | 5.0% |
| 68 | Wilmore | 6,057 | 242 | 5.0% |
| 68 | Highland Heights | 6,444 | 258 | 5.0% |
| 68 | Elsmere | 9,205 | 368 | 5.0% |
| 68 | Taylor Mill | 6,937 | 277 | 5.0% |
| 68 | Fort Thomas | 17,169 | 687 | 5.0% |
| 74 | Williamsburg | 5,270 | 169 | 4.0% |
| 74 | Fort Wright | 5,887 | 188 | 4.0% |
| 76 | Edgewood | 8,447 | 203 | 3.0% |
| 76 | Morehead | 6,870 | 165 | 3.0% |
| 78 | Villa Hills | 7,480 | 120 | 2.0% |
| 79 | Union | 7,642 | 61 | 1.0% |
| 79 | Oak Grove | 7,962 | 64 | 1.0% |
Source: U.S. Census ACS 2020-2024. 80 cities with more than 5,000 residents.
Summary
Getting Some Closure In Kentucky After Untying The Knot
We now have a sense of what places in the Bluegrass State don’t pay much attention to the whole “’til death do we part” phrase.
The cities with the highest divorce rate in Kentucky are Glasgow, Pikeville, Leitchfield, Frankfort, Harrodsburg, Lawrenceburg, Shively, Lebanon, Corbin, and London.
Try to keep in mind that the reason cities rank where they do in Kentucky could be because of the age, education, and income distribution, as all of those things impact the rate of divorce.