Fall River, MA
Demographics And Statistics
Living In Fall River, Massachusetts Summary
Life in Fall River research summary. HomeSnacks has been using Saturday Night Science to research the quality of life in Fall River over the past nine years using Census, FBI, Zillow, and other primary data sources. Based on the most recently available data, we found the following about life in Fall River:
The population in Fall River is 93,764.
The median home value in Fall River is $438,196.
The median income in Fall River is $53,933.
The cost of living in Fall River is 113 which is 1.1x higher than the national average.
The median rent in Fall River is $1,086.
The unemployment rate in Fall River is 8.1%.
The poverty rate in Fall River is 20.9%.
The average high in Fall River is 59.9° and the average low is 43.4°.
Fall River SnackAbility
Overall SnackAbility
Fall River, MA Crime Report
Crime in Fall River summary. We use data from the FBI to determine the crime rates in Fall River. Key points include:
There were 2,040 total crimes in Fall River in the last reporting year.
The overall crime rate per 100,000 people in Fall River is 2,134.5 / 100k people.
The violent crime rate per 100,000 people in Fall River is 742.9 / 100k people.
The property crime rate per 100,000 people in Fall River is 1,391.6 / 100k people.
Overall, crime in Fall River is 0.72% above the national average.
Total Crimes
Above National Average
Crime In Fall River Comparison Table
| Statistic | Count Raw |
Fall River / 100k People |
Massachusetts / 100k People |
National / 100k People |
|---|---|---|---|---|
| Total Crimes Per 100K | 2,040 | 2,134.5 | 1,426.8 | 2,119.2 |
| Violent Crime | 710 | 742.9 | 314.7 | 359.0 |
| Murder | 3 | 3.1 | 1.8 | 5.0 |
| Robbery | 96 | 100.4 | 36.0 | 61.0 |
| Aggravated Assault | 553 | 578.6 | 249.3 | 256.0 |
| Property Crime | 1,330 | 1,391.6 | 1,112.1 | 1,760.0 |
| Burglary | 221 | 231.2 | 130.3 | 229.0 |
| Larceny | 952 | 996.1 | 876.3 | 1,272.0 |
| Car Theft | 157 | 164.3 | 105.5 | 259.0 |
Fall River, MA Cost Of Living
Cost of living in Fall River summary. We use data on the cost of living to determine how expensive it is to live in Fall River. Real estate prices drive most of the variance in cost of living around Massachusetts. Key points include:
The cost of living in Fall River is 113 with 100 being average.
The cost of living in Fall River is 1.1x higher than the national average.
The median home value in Fall River is $438,196.
The median income in Fall River is $53,933.
Fall River's Overall Cost Of Living
Higher Than The National Average
Cost Of Living In Fall River Comparison Table
| Living Expense | Fall River | Massachusetts | National Average | |
|---|---|---|---|---|
| Overall | 113 | 134 | 100 | |
| Services | 113 | 121 | 100 | |
| Groceries | 104 | 106 | 100 | |
| Health | 109 | 112 | 100 | |
| Housing | 122 | 164 | 100 | |
| Transportation | 92 | 120 | 100 | |
| Utilities | 113 | 136 | 100 | |
Fall River, MA Weather
The average high in Fall River is 59.9° and the average low is 43.4°.
There are 81.8 days of precipitation each year.
Expect an average of 48.7 inches of precipitation each year with 33.9 inches of snow.
| Stat | Fall River |
|---|---|
| Average Annual High | 59.9 |
| Average Annual Low | 43.4 |
| Annual Precipitation Days | 81.8 |
| Average Annual Precipitation | 48.7 |
| Average Annual Snowfall | 33.9 |
Average High
Days of Rain
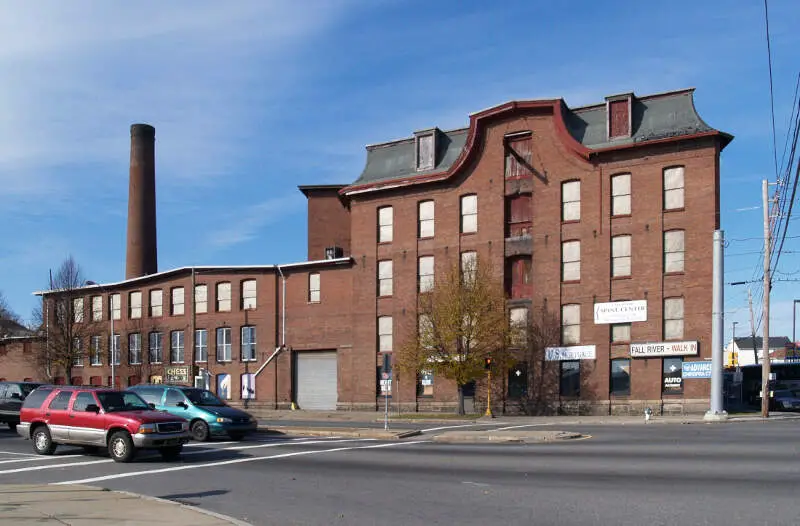
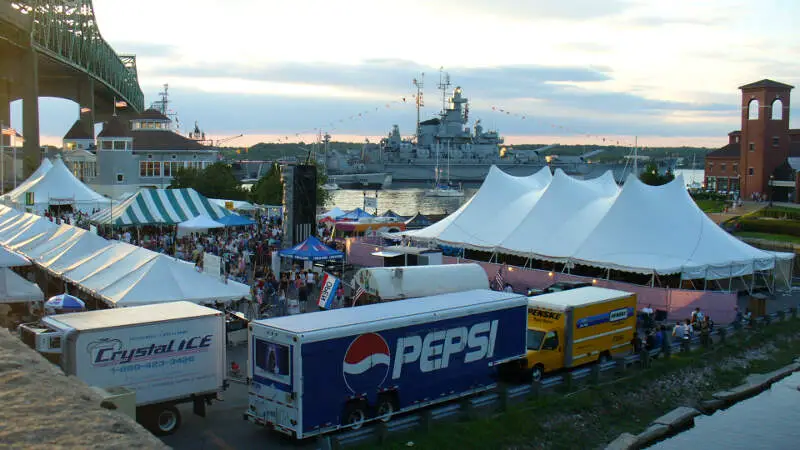
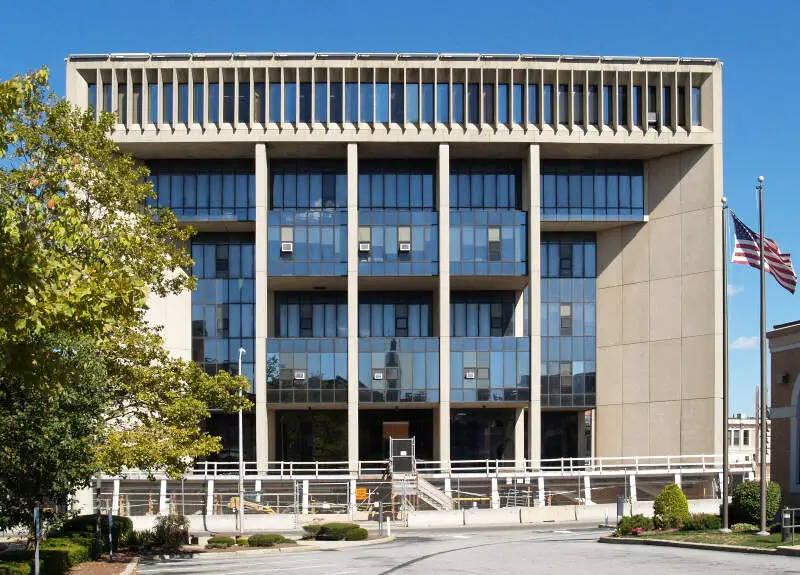
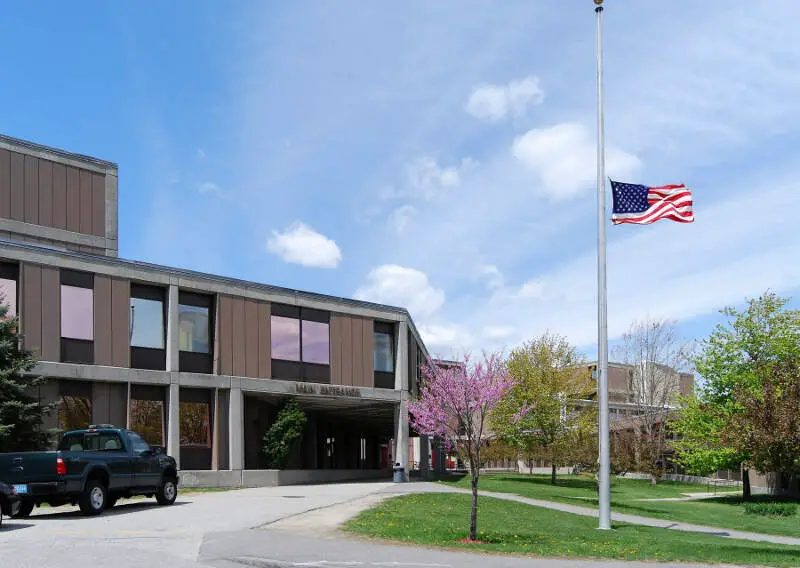
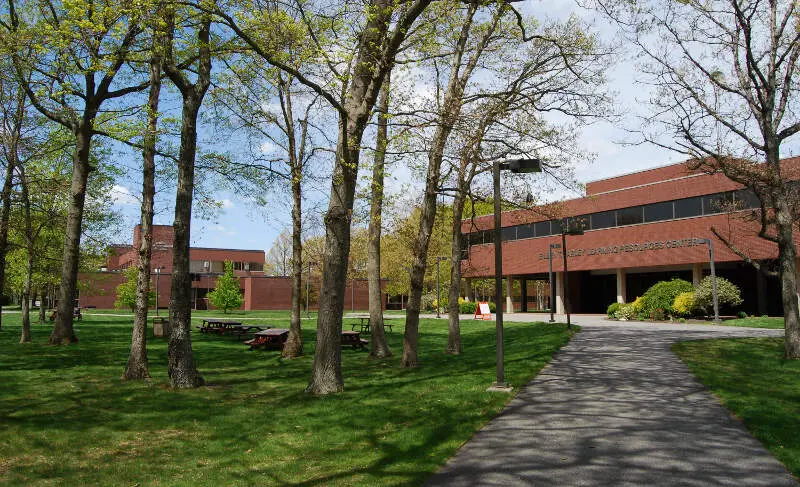
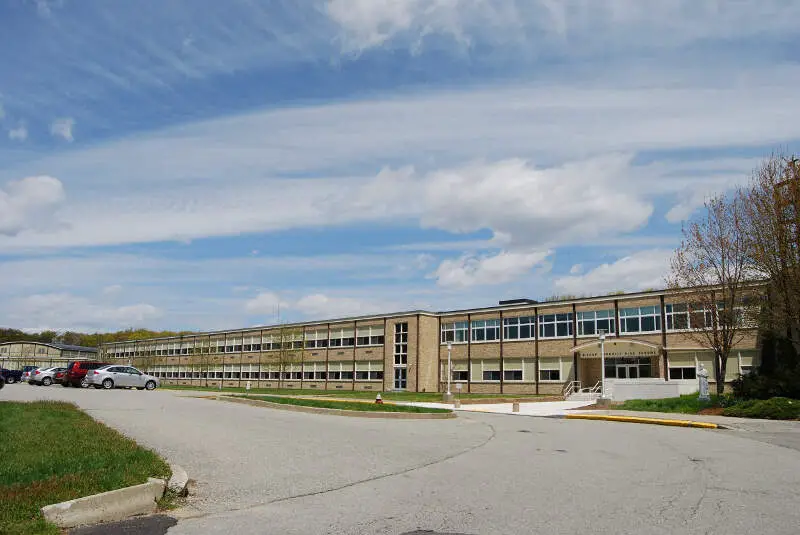
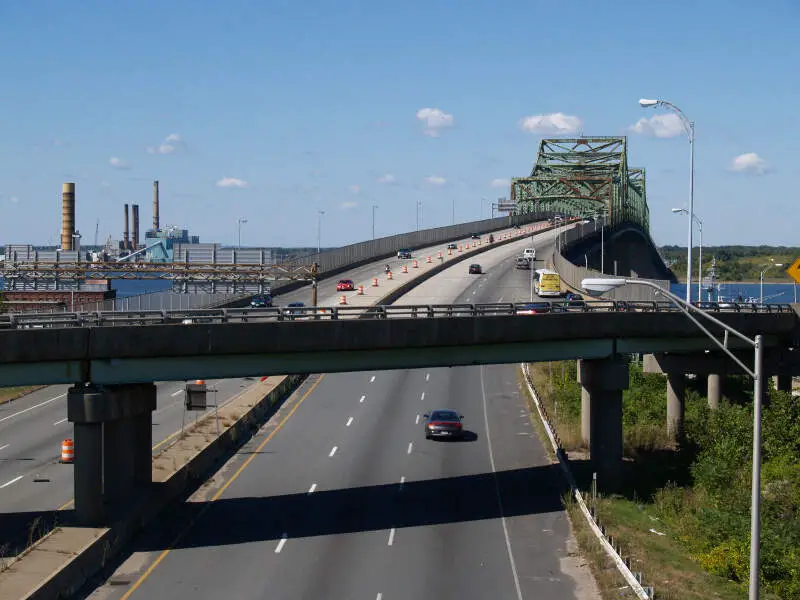
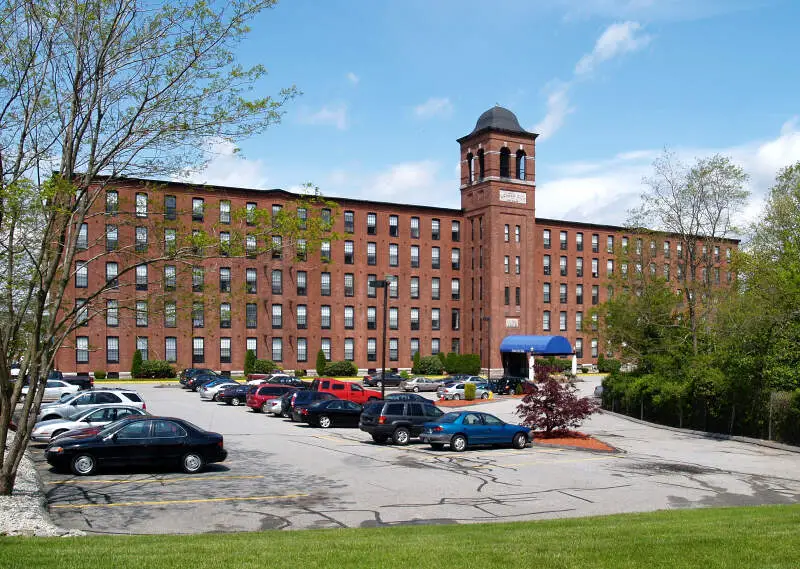
Fall River, MA Photos
2 Reviews & Comments About Fall River
/5

K Mack - None
Crime is not that bad on fall river as I live in the corky row section but the whole city's become a toilet since I was a kid being born and brought up here.
The whole state blows cuz it's full of libtards and the city has never been able to save any money except for the politicians who have and will continue to get rich by crooking the city.
As for me I work in the city and when I retire 3+ yrs from now I'm moving to a state that allows it citizens to be free like say Texas, Florida, north or south Carolina, Georgia, Arizona, New Hampshirempshire, Maine etc etc etc. Btw, there aren't too many places that don't have drug problems nowadays, unfortunately !
scorpio 21489 - None
I live in Fall River, and I am surprised it didn't make the list. We were once a thriving textile Mill city, until NAFTA came along in the 90s. They all moved to China. Now, all the section 8s from Taunton, Boston, and many other places, have taken over. The landlords got greedy and raised the rents for a bigger chunk from the state, and as a result it is hard to afford an apartment if your just a worker. Some people will not rent to you if you get your income from a job! The crime has risen. Gangs are taking over. This is definitely not the city I grew up in anymore!
Rankings for Fall River in Massachusetts


Locations Around Fall River
Map Of Fall River, MA
Best Places Around Fall River
Somerset, MA
Population 18,246
Central Falls, RI
Population 22,481
Bliss Corner, MA
Population 5,666
Pawtucket, RI
Population 75,280
Providence, RI
Population 190,214
Tiverton, RI
Population 8,151
Attleboro, MA
Population 46,499
Fall River Demographics And Statistics
Population over time in Fall River
The current population in Fall River is 93,764. The population has increased 4.8% from 2010.
| Year | Population | % Change |
|---|---|---|
| 2023 | 93,764 | 0.1% |
| 2022 | 93,638 | 0.3% |
| 2021 | 93,339 | 4.2% |
| 2020 | 89,618 | 0.3% |
| 2019 | 89,388 | 0.1% |
| 2018 | 89,339 | 0.1% |
| 2017 | 89,258 | 0.4% |
| 2016 | 88,902 | 0.2% |
| 2015 | 88,727 | -0.0% |
| 2014 | 88,756 | -0.1% |
| 2013 | 88,811 | -0.3% |
| 2012 | 89,049 | -0.2% |
| 2011 | 89,220 | -0.3% |
| 2010 | 89,482 | - |
Race / Ethnicity in Fall River
Fall River is:
69.5% White with 65,120 White residents.
5.5% African American with 5,128 African American residents.
0.1% American Indian with 104 American Indian residents.
2.7% Asian with 2,512 Asian residents.
0.0% Hawaiian with 0 Hawaiian residents.
1.4% Other with 1,338 Other residents.
7.7% Two Or More with 7,206 Two Or More residents.
13.2% Hispanic with 12,356 Hispanic residents.
| Race | Fall River | MA | USA |
|---|---|---|---|
| White | 69.5% | 67.8% | 58.2% |
| African American | 5.5% | 6.5% | 12.0% |
| American Indian | 0.1% | 0.1% | 0.5% |
| Asian | 2.7% | 7.0% | 5.7% |
| Hawaiian | 0.0% | 0.0% | 0.2% |
| Other | 1.4% | 1.1% | 0.5% |
| Two Or More | 7.7% | 4.5% | 3.9% |
| Hispanic | 13.2% | 12.9% | 19.0% |
Gender in Fall River
Fall River is 51.8% female with 48,609 female residents.
Fall River is 48.2% male with 45,155 male residents.
| Gender | Fall River | MA | USA |
|---|---|---|---|
| Female | 51.8% | 51.1% | 50.5% |
| Male | 48.2% | 48.9% | 49.5% |
Highest level of educational attainment in Fall River for adults over 25
11.0% of adults in Fall River completed < 9th grade.
11.0% of adults in Fall River completed 9-12th grade.
34.0% of adults in Fall River completed high school / ged.
18.0% of adults in Fall River completed some college.
8.0% of adults in Fall River completed associate's degree.
11.0% of adults in Fall River completed bachelor's degree.
5.0% of adults in Fall River completed master's degree.
1.0% of adults in Fall River completed professional degree.
1.0% of adults in Fall River completed doctorate degree.
| Education | Fall River | MA | USA |
|---|---|---|---|
| < 9th Grade | 11.0% | 5.0% | 5.0% |
| 9-12th Grade | 11.0% | 4.0% | 6.0% |
| High School / GED | 34.0% | 23.0% | 26.0% |
| Some College | 18.0% | 14.0% | 19.0% |
| Associate's Degree | 8.0% | 8.0% | 9.0% |
| Bachelor's Degree | 11.0% | 25.0% | 21.0% |
| Master's Degree | 5.0% | 15.0% | 10.0% |
| Professional Degree | 1.0% | 3.0% | 2.0% |
| Doctorate Degree | 1.0% | 3.0% | 2.0% |
Household Income For Fall River, Massachusetts
7.9% of households in Fall River earn Less than $10,000.
7.9% of households in Fall River earn $10,000 to $14,999.
9.8% of households in Fall River earn $15,000 to $24,999.
9.3% of households in Fall River earn $25,000 to $34,999.
12.2% of households in Fall River earn $35,000 to $49,999.
16.2% of households in Fall River earn $50,000 to $74,999.
11.1% of households in Fall River earn $75,000 to $99,999.
14.0% of households in Fall River earn $100,000 to $149,999.
6.9% of households in Fall River earn $150,000 to $199,999.
4.7% of households in Fall River earn $200,000 or more.
| Income | Fall River | MA | USA |
|---|---|---|---|
| Less than $10,000 | 7.9% | 4.3% | 4.9% |
| $10,000 to $14,999 | 7.9% | 3.5% | 3.6% |
| $15,000 to $24,999 | 9.8% | 5.6% | 6.6% |
| $25,000 to $34,999 | 9.3% | 5.1% | 6.8% |
| $35,000 to $49,999 | 12.2% | 7.7% | 10.4% |
| $50,000 to $74,999 | 16.2% | 12.2% | 15.7% |
| $75,000 to $99,999 | 11.1% | 11.0% | 12.7% |
| $100,000 to $149,999 | 14.0% | 17.7% | 17.4% |
| $150,000 to $199,999 | 6.9% | 11.8% | 9.3% |
| $200,000 or more | 4.7% | 21.1% | 12.6% |


