New Bedford, MA
Demographics And Statistics
Living In New Bedford, Massachusetts Summary
Life in New Bedford research summary. HomeSnacks has been using Saturday Night Science to research the quality of life in New Bedford over the past nine years using Census, FBI, Zillow, and other primary data sources. Based on the most recently available data, we found the following about life in New Bedford:
The population in New Bedford is 100,731.
The median home value in New Bedford is $427,773.
The median income in New Bedford is $56,025.
The cost of living in New Bedford is 109 which is 1.1x higher than the national average.
The median rent in New Bedford is $1,085.
The unemployment rate in New Bedford is 7.6%.
The poverty rate in New Bedford is 19.9%.
The average high in New Bedford is 59.0° and the average low is 42.6°.
New Bedford SnackAbility
Overall SnackAbility
New Bedford, MA Crime Report
Crime in New Bedford summary. We use data from the FBI to determine the crime rates in New Bedford. Key points include:
There were 1,755 total crimes in New Bedford in the last reporting year.
The overall crime rate per 100,000 people in New Bedford is 1,712.3 / 100k people.
The violent crime rate per 100,000 people in New Bedford is 353.2 / 100k people.
The property crime rate per 100,000 people in New Bedford is 1,359.1 / 100k people.
Overall, crime in New Bedford is -19.20% below the national average.
Total Crimes
Below National Average
Crime In New Bedford Comparison Table
| Statistic | Count Raw |
New Bedford / 100k People |
Massachusetts / 100k People |
National / 100k People |
|---|---|---|---|---|
| Total Crimes Per 100K | 1,755 | 1,712.3 | 1,426.8 | 2,119.2 |
| Violent Crime | 362 | 353.2 | 314.7 | 359.0 |
| Murder | 7 | 6.8 | 1.8 | 5.0 |
| Robbery | 80 | 78.1 | 36.0 | 61.0 |
| Aggravated Assault | 230 | 224.4 | 249.3 | 256.0 |
| Property Crime | 1,393 | 1,359.1 | 1,112.1 | 1,760.0 |
| Burglary | 189 | 184.4 | 130.3 | 229.0 |
| Larceny | 954 | 930.8 | 876.3 | 1,272.0 |
| Car Theft | 250 | 243.9 | 105.5 | 259.0 |
New Bedford, MA Cost Of Living
Cost of living in New Bedford summary. We use data on the cost of living to determine how expensive it is to live in New Bedford. Real estate prices drive most of the variance in cost of living around Massachusetts. Key points include:
The cost of living in New Bedford is 109 with 100 being average.
The cost of living in New Bedford is 1.1x higher than the national average.
The median home value in New Bedford is $427,773.
The median income in New Bedford is $56,025.
New Bedford's Overall Cost Of Living
Higher Than The National Average
Cost Of Living In New Bedford Comparison Table
| Living Expense | New Bedford | Massachusetts | National Average | |
|---|---|---|---|---|
| Overall | 109 | 134 | 100 | |
| Services | 116 | 121 | 100 | |
| Groceries | 104 | 106 | 100 | |
| Health | 107 | 112 | 100 | |
| Housing | 117 | 164 | 100 | |
| Transportation | 92 | 120 | 100 | |
| Utilities | 110 | 136 | 100 | |
New Bedford, MA Weather
The average high in New Bedford is 59.0° and the average low is 42.6°.
There are 82.5 days of precipitation each year.
Expect an average of 51.2 inches of precipitation each year with 33.3 inches of snow.
| Stat | New Bedford |
|---|---|
| Average Annual High | 59.0 |
| Average Annual Low | 42.6 |
| Annual Precipitation Days | 82.5 |
| Average Annual Precipitation | 51.2 |
| Average Annual Snowfall | 33.3 |
Average High
Days of Rain
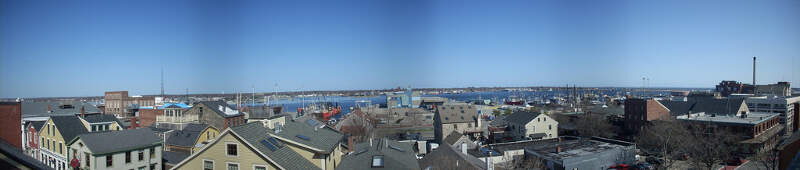
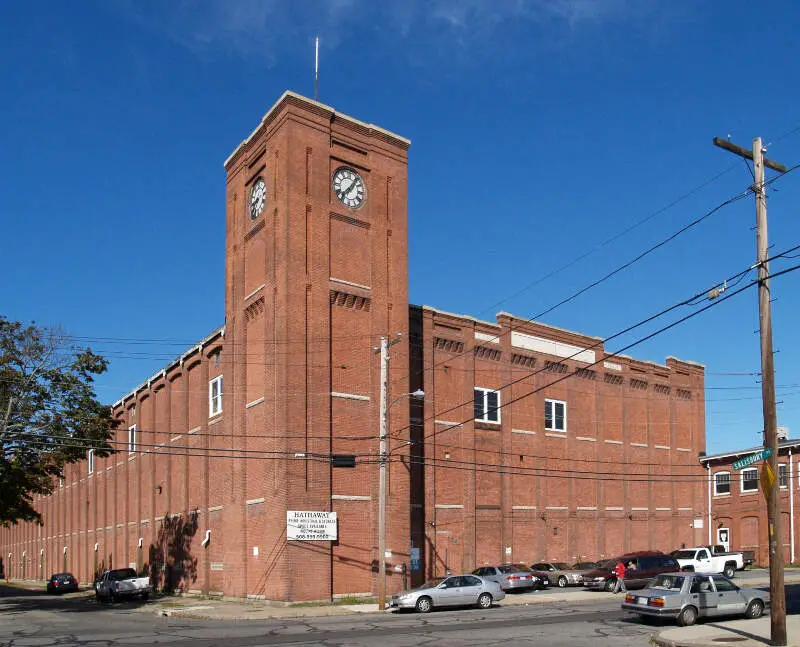
New Bedford, MA Photos


1 Reviews & Comments About New Bedford
/5

HomeSnacks User - None
I would rather live in New Bedford or Fall River any day.
Oh and by the way New Bedford has 8% unemployment, yeah I know 92% employment s***s.
Rankings for New Bedford in Massachusetts


Locations Around New Bedford
Map Of New Bedford, MA
Best Places Around New Bedford
Somerset, MA
Population 18,246
Bliss Corner, MA
Population 5,666
Tiverton, RI
Population 8,151
Middleborough Center, MA
Population 8,064
Taunton, MA
Population 59,719
Fall River, MA
Population 93,764
New Bedford Demographics And Statistics
Population over time in New Bedford
The current population in New Bedford is 100,731. The population has increased 6.1% from 2010.
| Year | Population | % Change |
|---|---|---|
| 2023 | 100,731 | 0.1% |
| 2022 | 100,620 | 0.3% |
| 2021 | 100,309 | 5.2% |
| 2020 | 95,355 | 0.1% |
| 2019 | 95,239 | 0.1% |
| 2018 | 95,117 | -0.0% |
| 2017 | 95,125 | 0.1% |
| 2016 | 94,988 | 0.1% |
| 2015 | 94,909 | 0.0% |
| 2014 | 94,873 | -0.1% |
| 2013 | 94,927 | -0.0% |
| 2012 | 94,952 | -0.1% |
| 2011 | 95,006 | 0.1% |
| 2010 | 94,945 | - |
Race / Ethnicity in New Bedford
New Bedford is:
55.6% White with 55,994 White residents.
5.3% African American with 5,296 African American residents.
0.2% American Indian with 181 American Indian residents.
1.5% Asian with 1,551 Asian residents.
0.0% Hawaiian with 10 Hawaiian residents.
4.2% Other with 4,200 Other residents.
8.7% Two Or More with 8,782 Two Or More residents.
24.5% Hispanic with 24,717 Hispanic residents.
| Race | New Bedford | MA | USA |
|---|---|---|---|
| White | 55.6% | 67.8% | 58.2% |
| African American | 5.3% | 6.5% | 12.0% |
| American Indian | 0.2% | 0.1% | 0.5% |
| Asian | 1.5% | 7.0% | 5.7% |
| Hawaiian | 0.0% | 0.0% | 0.2% |
| Other | 4.2% | 1.1% | 0.5% |
| Two Or More | 8.7% | 4.5% | 3.9% |
| Hispanic | 24.5% | 12.9% | 19.0% |
Gender in New Bedford
New Bedford is 49.6% female with 49,983 female residents.
New Bedford is 50.4% male with 50,748 male residents.
| Gender | New Bedford | MA | USA |
|---|---|---|---|
| Female | 49.6% | 51.1% | 50.5% |
| Male | 50.4% | 48.9% | 49.5% |
Highest level of educational attainment in New Bedford for adults over 25
13.0% of adults in New Bedford completed < 9th grade.
10.0% of adults in New Bedford completed 9-12th grade.
34.0% of adults in New Bedford completed high school / ged.
16.0% of adults in New Bedford completed some college.
9.0% of adults in New Bedford completed associate's degree.
12.0% of adults in New Bedford completed bachelor's degree.
4.0% of adults in New Bedford completed master's degree.
1.0% of adults in New Bedford completed professional degree.
1.0% of adults in New Bedford completed doctorate degree.
| Education | New Bedford | MA | USA |
|---|---|---|---|
| < 9th Grade | 13.0% | 5.0% | 5.0% |
| 9-12th Grade | 10.0% | 4.0% | 6.0% |
| High School / GED | 34.0% | 23.0% | 26.0% |
| Some College | 16.0% | 14.0% | 19.0% |
| Associate's Degree | 9.0% | 8.0% | 9.0% |
| Bachelor's Degree | 12.0% | 25.0% | 21.0% |
| Master's Degree | 4.0% | 15.0% | 10.0% |
| Professional Degree | 1.0% | 3.0% | 2.0% |
| Doctorate Degree | 1.0% | 3.0% | 2.0% |
Household Income For New Bedford, Massachusetts
7.2% of households in New Bedford earn Less than $10,000.
6.1% of households in New Bedford earn $10,000 to $14,999.
11.1% of households in New Bedford earn $15,000 to $24,999.
8.9% of households in New Bedford earn $25,000 to $34,999.
12.0% of households in New Bedford earn $35,000 to $49,999.
17.6% of households in New Bedford earn $50,000 to $74,999.
12.2% of households in New Bedford earn $75,000 to $99,999.
15.0% of households in New Bedford earn $100,000 to $149,999.
5.4% of households in New Bedford earn $150,000 to $199,999.
4.5% of households in New Bedford earn $200,000 or more.
| Income | New Bedford | MA | USA |
|---|---|---|---|
| Less than $10,000 | 7.2% | 4.3% | 4.9% |
| $10,000 to $14,999 | 6.1% | 3.5% | 3.6% |
| $15,000 to $24,999 | 11.1% | 5.6% | 6.6% |
| $25,000 to $34,999 | 8.9% | 5.1% | 6.8% |
| $35,000 to $49,999 | 12.0% | 7.7% | 10.4% |
| $50,000 to $74,999 | 17.6% | 12.2% | 15.7% |
| $75,000 to $99,999 | 12.2% | 11.0% | 12.7% |
| $100,000 to $149,999 | 15.0% | 17.7% | 17.4% |
| $150,000 to $199,999 | 5.4% | 11.8% | 9.3% |
| $200,000 or more | 4.5% | 21.1% | 12.6% |


