Belfast, ME
Demographics And Statistics
Living In Belfast, Maine Summary
Life in Belfast research summary. HomeSnacks has been using Saturday Night Science to research the quality of life in Belfast over the past nine years using Census, FBI, Zillow, and other primary data sources. Based on the most recently available data, we found the following about life in Belfast:
The population in Belfast is 6,985.
The median home value in Belfast is $386,506.
The median income in Belfast is $61,322.
The cost of living in Belfast is 105 which is 1.1x higher than the national average.
The median rent in Belfast is $986.
The unemployment rate in Belfast is 3.8%.
The poverty rate in Belfast is 18.2%.
The average high in Belfast is 54.7° and the average low is 35.0°.
Belfast SnackAbility
Overall SnackAbility
Belfast, ME Crime Report
Crime in Belfast summary. We use data from the FBI to determine the crime rates in Belfast. Key points include:
There were 45 total crimes in Belfast in the last reporting year.
The overall crime rate per 100,000 people in Belfast is 632.8 / 100k people.
The violent crime rate per 100,000 people in Belfast is 0.0 / 100k people.
The property crime rate per 100,000 people in Belfast is 632.8 / 100k people.
Overall, crime in Belfast is -70.14% below the national average.
Total Crimes
Below National Average
Crime In Belfast Comparison Table
| Statistic | Count Raw |
Belfast / 100k People |
Maine / 100k People |
National / 100k People |
|---|---|---|---|---|
| Total Crimes Per 100K | 45 | 632.8 | 1,242.2 | 2,119.2 |
| Violent Crime | 0 | 0.0 | 100.1 | 359.0 |
| Murder | 0 | 0.0 | 2.3 | 5.0 |
| Robbery | 0 | 0.0 | 11.0 | 61.0 |
| Aggravated Assault | 0 | 0.0 | 55.0 | 256.0 |
| Property Crime | 45 | 632.8 | 1,142.1 | 1,760.0 |
| Burglary | 2 | 28.1 | 100.1 | 229.0 |
| Larceny | 43 | 604.7 | 961.0 | 1,272.0 |
| Car Theft | 0 | 0.0 | 81.1 | 259.0 |
Belfast, ME Cost Of Living
Cost of living in Belfast summary. We use data on the cost of living to determine how expensive it is to live in Belfast. Real estate prices drive most of the variance in cost of living around Maine. Key points include:
The cost of living in Belfast is 105 with 100 being average.
The cost of living in Belfast is 1.1x higher than the national average.
The median home value in Belfast is $386,506.
The median income in Belfast is $61,322.
Belfast's Overall Cost Of Living
Higher Than The National Average
Cost Of Living In Belfast Comparison Table
| Living Expense | Belfast | Maine | National Average | |
|---|---|---|---|---|
| Overall | 105 | 101 | 100 | |
| Services | 108 | 110 | 100 | |
| Groceries | 100 | 103 | 100 | |
| Health | 103 | 104 | 100 | |
| Housing | 97 | 90 | 100 | |
| Transportation | 111 | 108 | 100 | |
| Utilities | 109 | 105 | 100 | |
Belfast, ME Weather
The average high in Belfast is 54.7° and the average low is 35.0°.
There are 76.6 days of precipitation each year.
Expect an average of 48.0 inches of precipitation each year with 63.4 inches of snow.
| Stat | Belfast |
|---|---|
| Average Annual High | 54.7 |
| Average Annual Low | 35.0 |
| Annual Precipitation Days | 76.6 |
| Average Annual Precipitation | 48.0 |
| Average Annual Snowfall | 63.4 |
Average High
Days of Rain
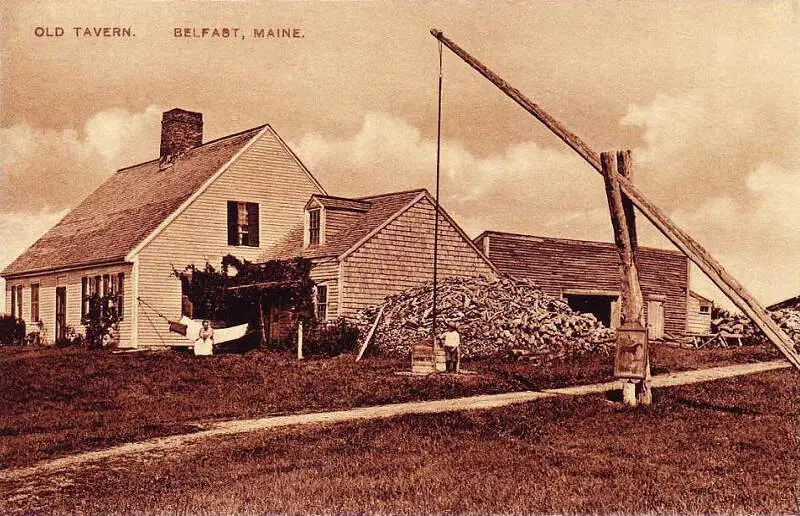
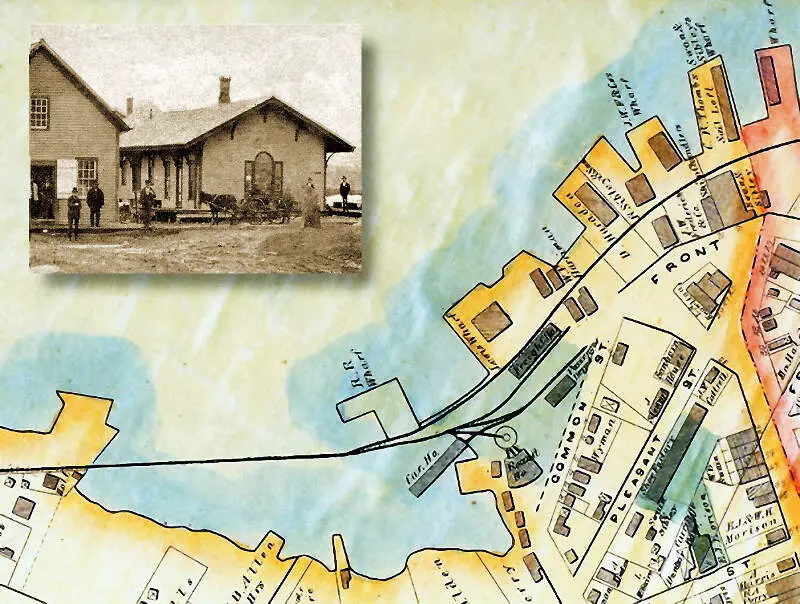
Belfast, ME Photos


Rankings for Belfast in Maine


Locations Around Belfast
Map Of Belfast, ME
Best Places Around Belfast
Orono, ME
Population 10,699
Brewer, ME
Population 9,654
Ellsworth, ME
Population 8,550
Gardiner, ME
Population 6,047
Rockland, ME
Population 6,991
Bangor, ME
Population 31,663
Waterville, ME
Population 16,704
Augusta, ME
Population 18,999
Skowhegan, ME
Population 6,638
Belfast Demographics And Statistics
Population over time in Belfast
The current population in Belfast is 6,985. The population has increased 4.4% from 2010.
| Year | Population | % Change |
|---|---|---|
| 2023 | 6,985 | 0.5% |
| 2022 | 6,953 | 0.9% |
| 2021 | 6,890 | 2.7% |
| 2020 | 6,710 | 0.3% |
| 2019 | 6,688 | -0.1% |
| 2018 | 6,696 | 0.2% |
| 2017 | 6,680 | 0.6% |
| 2016 | 6,641 | -0.4% |
| 2015 | 6,668 | 0.1% |
| 2014 | 6,664 | -0.1% |
| 2013 | 6,672 | 0.1% |
| 2012 | 6,664 | -0.2% |
| 2011 | 6,676 | -0.2% |
| 2010 | 6,691 | - |
Race / Ethnicity in Belfast
Belfast is:
87.5% White with 6,112 White residents.
1.2% African American with 86 African American residents.
0.0% American Indian with 0 American Indian residents.
0.5% Asian with 32 Asian residents.
0.0% Hawaiian with 0 Hawaiian residents.
2.1% Other with 146 Other residents.
7.4% Two Or More with 514 Two Or More residents.
1.4% Hispanic with 95 Hispanic residents.
| Race | Belfast | ME | USA |
|---|---|---|---|
| White | 87.5% | 90.6% | 58.2% |
| African American | 1.2% | 1.6% | 12.0% |
| American Indian | 0.0% | 0.4% | 0.5% |
| Asian | 0.5% | 1.1% | 5.7% |
| Hawaiian | 0.0% | 0.0% | 0.2% |
| Other | 2.1% | 0.3% | 0.5% |
| Two Or More | 7.4% | 3.8% | 3.9% |
| Hispanic | 1.4% | 2.1% | 19.0% |
Gender in Belfast
Belfast is 55.3% female with 3,862 female residents.
Belfast is 44.7% male with 3,123 male residents.
| Gender | Belfast | ME | USA |
|---|---|---|---|
| Female | 55.3% | 50.8% | 50.5% |
| Male | 44.7% | 49.2% | 49.5% |
Highest level of educational attainment in Belfast for adults over 25
1.0% of adults in Belfast completed < 9th grade.
5.0% of adults in Belfast completed 9-12th grade.
24.0% of adults in Belfast completed high school / ged.
16.0% of adults in Belfast completed some college.
6.0% of adults in Belfast completed associate's degree.
23.0% of adults in Belfast completed bachelor's degree.
19.0% of adults in Belfast completed master's degree.
4.0% of adults in Belfast completed professional degree.
2.0% of adults in Belfast completed doctorate degree.
| Education | Belfast | ME | USA |
|---|---|---|---|
| < 9th Grade | 1.0% | 2.0% | 5.0% |
| 9-12th Grade | 5.0% | 4.0% | 6.0% |
| High School / GED | 24.0% | 31.0% | 26.0% |
| Some College | 16.0% | 18.0% | 19.0% |
| Associate's Degree | 6.0% | 10.0% | 9.0% |
| Bachelor's Degree | 23.0% | 22.0% | 21.0% |
| Master's Degree | 19.0% | 9.0% | 10.0% |
| Professional Degree | 4.0% | 2.0% | 2.0% |
| Doctorate Degree | 2.0% | 2.0% | 2.0% |
Household Income For Belfast, Maine
4.6% of households in Belfast earn Less than $10,000.
5.4% of households in Belfast earn $10,000 to $14,999.
9.7% of households in Belfast earn $15,000 to $24,999.
7.9% of households in Belfast earn $25,000 to $34,999.
12.6% of households in Belfast earn $35,000 to $49,999.
23.0% of households in Belfast earn $50,000 to $74,999.
9.8% of households in Belfast earn $75,000 to $99,999.
10.2% of households in Belfast earn $100,000 to $149,999.
6.0% of households in Belfast earn $150,000 to $199,999.
10.7% of households in Belfast earn $200,000 or more.
| Income | Belfast | ME | USA |
|---|---|---|---|
| Less than $10,000 | 4.6% | 4.1% | 4.9% |
| $10,000 to $14,999 | 5.4% | 3.9% | 3.6% |
| $15,000 to $24,999 | 9.7% | 7.5% | 6.6% |
| $25,000 to $34,999 | 7.9% | 7.7% | 6.8% |
| $35,000 to $49,999 | 12.6% | 11.6% | 10.4% |
| $50,000 to $74,999 | 23.0% | 17.1% | 15.7% |
| $75,000 to $99,999 | 9.8% | 13.1% | 12.7% |
| $100,000 to $149,999 | 10.2% | 18.2% | 17.4% |
| $150,000 to $199,999 | 6.0% | 8.3% | 9.3% |
| $200,000 or more | 10.7% | 8.4% | 12.6% |


