Most Asian cities in California research summary. We analyzed California’s most recent Census data to determine the most Asian cities in California based on the percentage of Asian residents.
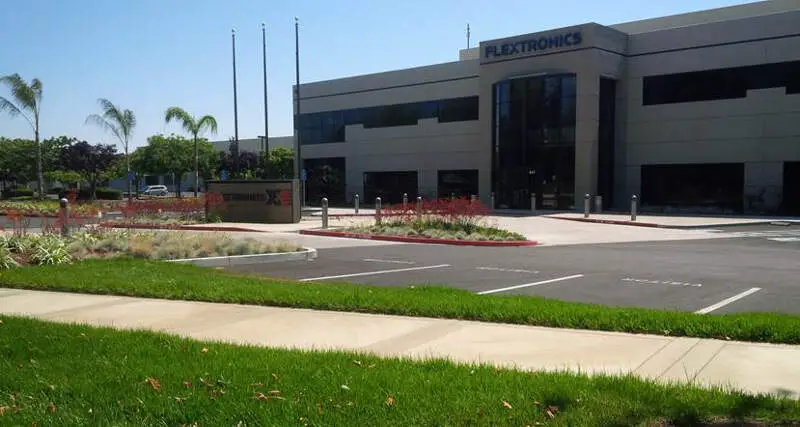
71.5% Asian · #1 most Asian in California
Milpitas is a city in Santa Clara County, California. It is located with San Jose to its south and Fremont to its north, at the eastern end of State Route 237 and generally between Interstates 680 and 880 which run roughly north/south through the city. With Alameda County bordering directly on the north, Milpitas sits in the extreme northeast section of the South Bay, bordering the East Bay and Fremont. Milpitas is also located within the Silicon Valley. The corporate headquarters of Maxtor, LSI Corporation, Adaptec, Intersil, FireEye, Viavi and Lumentum, KLA-Tencor, SanDisk, and View, Inc. sit within the industrial zones of Milpitas. Flex and Cisco also have offices in Milpitas. The population was 66,790 at the 2010 census.
Data | Crime | Cost of living | Movers
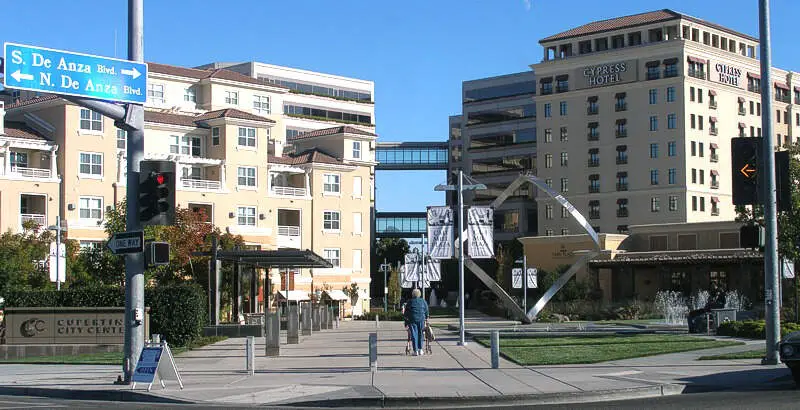
70.8% Asian · #2 most Asian in California
Cupertino is a U.S. city in Santa Clara County, California, directly west of San Jose on the western edge of the Santa Clara Valley with portions extending into the foothills of the Santa Cruz Mountains. The population was 58,302 as of the 2010 census. Forbes ranked it as one of the most educated small towns, with local public schools ranking highly in the country. It is known as the home of the Apple Inc. corporate headquarters.
Data | Crime | Cost of living | Movers
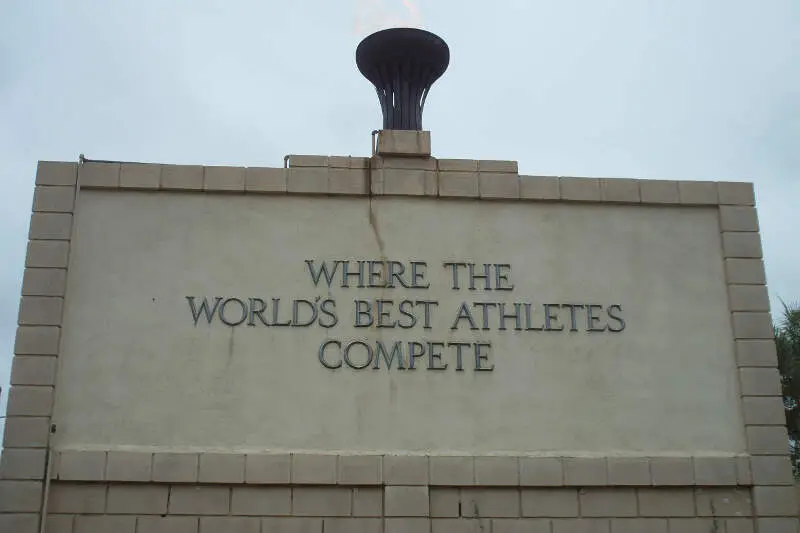
68.7% Asian · #3 most Asian in California
Walnut is a suburban city in the eastern part of Los Angeles County in California. Money’s Best Places to Live ranked Walnut #70 in 2009 and #57 in 2011, the highest ranking for a Californian city both years.
Data | Crime | Cost of living | Movers
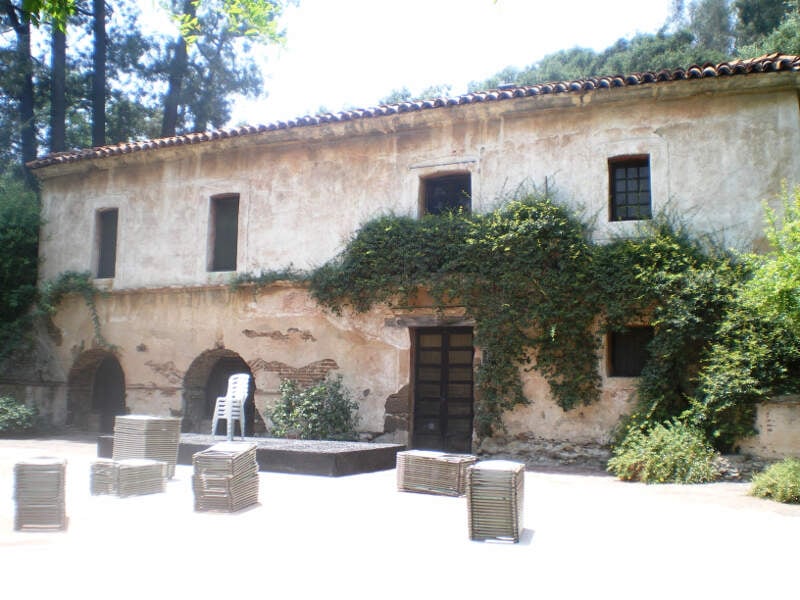
68.1% Asian · #4 most Asian in California
San Marino is a city in Los Angeles County, California, United States. Incorporated on April 12, 1913, the city was designed by its founders to be uniquely residential, with expansive properties surrounded by beautiful gardens, wide streets, and well maintained parkways. The city is located in the San Rafael Hills. The population was 13,147 at the 2010 census.
Data | Crime | Cost of living | Movers
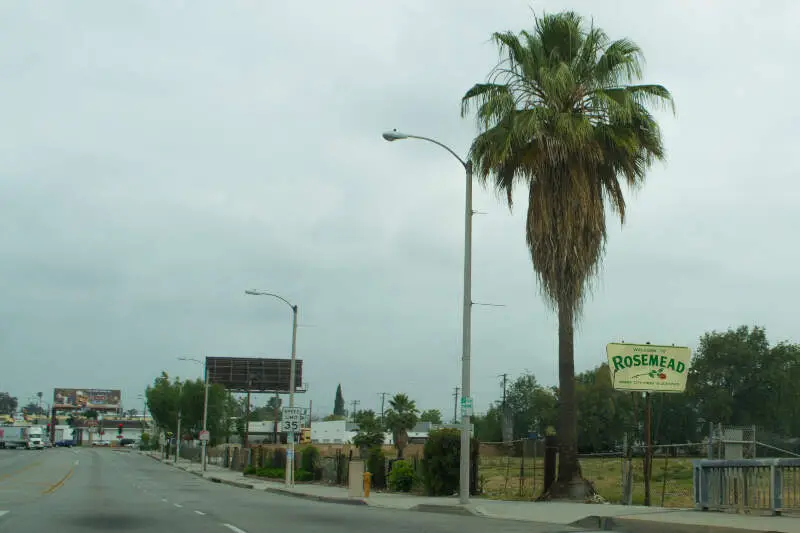
65.8% Asian · #5 most Asian in California
Rosemead is a city in Los Angeles County, California, United States. As of the 2010 census, it had a population of 53,764. Rosemead is part of a cluster of cities, along with Arcadia, Temple City, Monterey Park, San Marino, and San Gabriel, in the west San Gabriel Valley with a growing Asian population.
Data | Crime | Cost of living | Movers
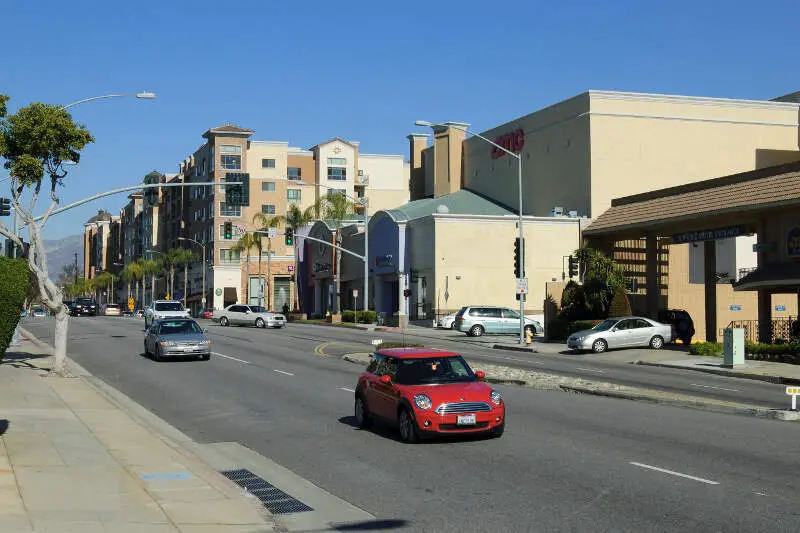
64.4% Asian · #6 most Asian in California
Monterey Park is a hillside suburban city in Los Angeles County, California, 7 miles east of Downtown Los Angeles. The city’s motto is “Pride in the past, Faith in the future”. Monterey Park is part of a cluster of cities with a growing Asian American population, making up 66.9% of its resident population at 2010; 47.7% of its residents are of Chinese descent, the largest concentration of Chinese Americans of any municipality in the United States. According to the 2010 Census, the city had a total population of 60,269. Monterey Park has recognized as “America’s Best Places to Live 2017” ranked at #3 by Money magazine and three local news TV stations.
Data | Crime | Cost of living | Movers
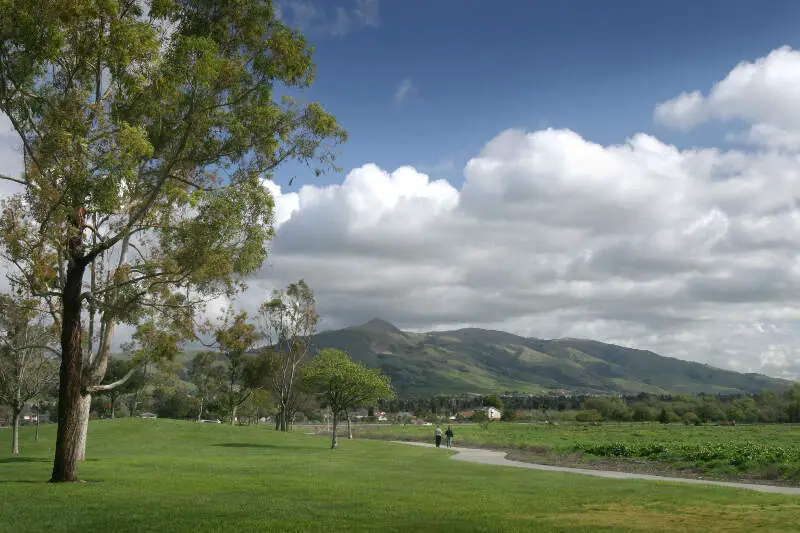
63.7% Asian · #7 most Asian in California
Fremont is a city in Alameda County, California, United States. It was incorporated on January 23, 1956, from the merger of five smaller communities: Centerville, Niles, Irvington, Mission San Jose, and Warm Springs. The city is named after John C. Frmont, an American explorer and the first Republican presidential candidate in 1856.
Data | Crime | Cost of living | Movers
63.3% Asian · #8 most Asian in California
Temple City is a city in Los Angeles County, California. Temple City is part of a cluster of cities, along with Arcadia, Rosemead, Monterey Park, San Marino, and San Gabriel, in the west San Gabriel Valley with a rapidly growing Asian population. Temple City also has a Cuban and Puerto Rican community, among other Latino nationalities. Approximately one third of the city’s population is white. The population was 35,558 at the 2010 census.
Data | Crime | Cost of living | Movers
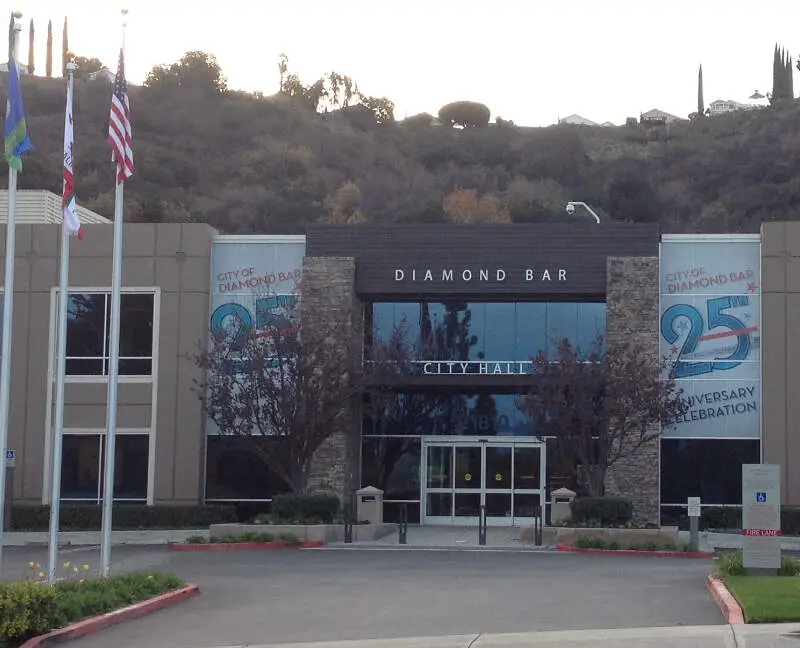
62.4% Asian · #9 most Asian in California
Diamond Bar is a city located in eastern Los Angeles County, California, United States. The 2014 population estimate was 56,784, up from 56,287 at the 2000 census. It is named after the “diamond over a bar” branding iron registered in 1918 by ranch owner Frederick E. Lewis. The city features a public Los Angeles County golf course. It is also home to the Diamond Bar Country Estates, a private guarded community.
Data | Crime | Cost of living | Movers
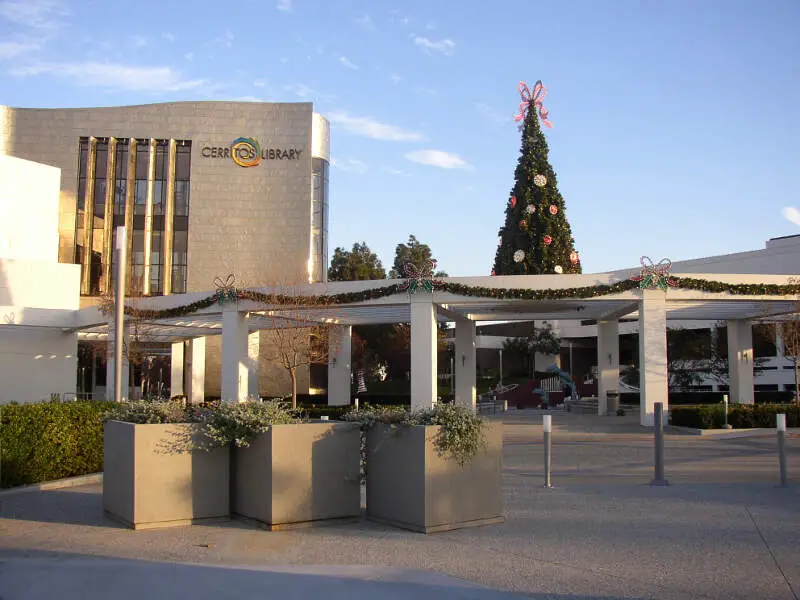
61.7% Asian · #10 most Asian in California
Cerritos, formerly named Dairy Valley because of the preponderance of dairy farms in the area, is a suburban city in Los Angeles County, California, United States, and is one of several cities that constitute the Gateway Cities of southeast Los Angeles County. It was incorporated on April 24, 1956. As of the 2010 census, the population was 49,041. It is part of the Los Angeles-Long Beach-Anaheim, California Metropolitan Statistical Area designated by the Office of Management and Budget.
Data | Crime | Cost of living | Movers
The receipts
Compare the top ten
Pick a metric. The bars rescale. The red line is California’s statewide median.
On the map
Where California’s Asian communities live
Saturday Night Science
Methodology: How We Determined The Cities In California With The Largest Asian Population For 2026
We used Saturday Night Science to compare Census data on race across every place in California.
The Census’s most recently available data comes from the 2020-2024 American Community Survey.
Specifically, we looked at table B03002: Hispanic OR LATINO ORIGIN BY RACE. Here are the category names as defined by the Census:
- Hispanic or Latino
- White alone*
- Black or African American alone*
- American Indian and Alaska Native alone*
- Asian alone*
- Native Hawaiian and Other Pacific Islander alone*
- Some other race alone*
- Two or more races*
Our particular column of interest here was the number of people who identified as Asian alone.
We limited our analysis to cities with a population greater than 5,000 people. That left us with 421 cities.
We then calculated the percentage of residents that are Asian. The percentages ranked from 71.5% to 0.0%.
Finally, we ranked each city based on the percentage of Asian population, with a higher percentage being more Asian. Milpitas took the distinction of being the most Asian, while Huron was the least Asian city.
We updated this article for 2026. This report reflects our eleventh time ranking the cities in California with the largest Asian population.
The full plate
Cities In California By Asian Population
Click any column to sort. Search by city name.
| Rank | City | Population | Asian Population | % Asian |
|---|---|---|---|---|
| 1 | Milpitas | 78,578 | 56,160 | 71.5% |
| 2 | Cupertino | 58,566 | 41,483 | 70.8% |
| 3 | Walnut | 27,611 | 18,982 | 68.7% |
| 4 | San Marino | 12,216 | 8,318 | 68.1% |
| 5 | Rosemead | 50,013 | 32,885 | 65.8% |
| 6 | Monterey Park | 59,132 | 38,083 | 64.4% |
| 7 | Fremont | 228,295 | 145,362 | 63.7% |
| 8 | Temple City | 35,430 | 22,440 | 63.3% |
| 9 | Diamond Bar | 53,355 | 33,316 | 62.4% |
| 10 | Cerritos | 47,867 | 29,516 | 61.7% |
| 11 | San Gabriel | 38,392 | 22,862 | 59.5% |
| 12 | Saratoga | 30,319 | 18,035 | 59.5% |
| 13 | Daly City | 101,964 | 60,378 | 59.2% |
| 14 | Arcadia | 55,170 | 32,387 | 58.7% |
| 15 | Union City | 67,464 | 38,405 | 56.9% |
| 16 | Dublin | 70,803 | 38,963 | 55.0% |
| 17 | Foster City | 32,792 | 17,816 | 54.3% |
| 18 | La Palma | 15,272 | 8,258 | 54.1% |
| 19 | Westminster | 89,860 | 47,118 | 52.4% |
| 20 | Alhambra | 81,022 | 41,073 | 50.7% |
| 21 | Santa Clara | 130,256 | 65,424 | 50.2% |
| 22 | San Ramon | 85,993 | 42,573 | 49.5% |
| 23 | Sunnyvale | 154,236 | 76,137 | 49.4% |
| 24 | Millbrae | 22,689 | 10,914 | 48.1% |
| 25 | Newark | 46,903 | 21,703 | 46.3% |
| 26 | Irvine | 311,690 | 139,049 | 44.6% |
| 27 | Hercules | 26,302 | 11,593 | 44.1% |
| 28 | Pleasanton | 76,960 | 33,663 | 43.7% |
| 29 | Artesia | 15,889 | 6,859 | 43.2% |
| 30 | Garden Grove | 170,964 | 73,009 | 42.7% |
| 31 | South San Francisco | 64,305 | 26,867 | 41.8% |
| 32 | Los Altos Hills | 8,377 | 3,427 | 40.9% |
| 33 | Chino Hills | 77,927 | 31,710 | 40.7% |
| 34 | San Jose | 990,138 | 388,267 | 39.2% |
| 35 | Los Altos | 30,698 | 11,940 | 38.9% |
| 36 | Cypress | 49,498 | 18,867 | 38.1% |
| 37 | Palo Alto | 67,237 | 25,620 | 38.1% |
| 38 | Torrance | 142,130 | 52,585 | 37.0% |
| 39 | Fountain Valley | 56,258 | 20,654 | 36.7% |
| 40 | Mountain View | 83,732 | 30,382 | 36.3% |
| 41 | San Leandro | 87,826 | 31,421 | 35.8% |
| 42 | South Pasadena | 26,068 | 9,116 | 35.0% |
| 43 | San Francisco | 830,235 | 290,030 | 34.9% |
| 44 | Lathrop | 35,052 | 11,764 | 33.6% |
| 45 | Hillsborough | 11,099 | 3,680 | 33.2% |
| 46 | American Canyon | 21,691 | 7,131 | 32.9% |
| 47 | Buena Park | 82,871 | 26,635 | 32.1% |
| 48 | Rancho Palos Verdes | 40,864 | 12,975 | 31.8% |
| 49 | San Bruno | 42,307 | 13,281 | 31.4% |
| 50 | Emeryville | 13,081 | 4,105 | 31.4% |
| 51 | Albany | 19,414 | 6,049 | 31.2% |
| 52 | Elk Grove | 179,155 | 55,538 | 31.0% |
| 53 | West Covina | 107,037 | 32,890 | 30.7% |
| 54 | Belmont | 27,337 | 8,375 | 30.6% |
| 55 | Hayward | 158,801 | 47,633 | 30.0% |
| 56 | Burlingame | 30,525 | 8,912 | 29.2% |
| 57 | Alameda | 77,238 | 22,108 | 28.6% |
| 58 | El Cerrito | 25,994 | 7,368 | 28.3% |
| 59 | Loma Linda | 25,122 | 7,097 | 28.3% |
| 60 | San Mateo | 103,105 | 28,820 | 28.0% |
| 61 | Brea | 47,469 | 13,142 | 27.7% |
| 62 | El Monte | 106,109 | 29,024 | 27.4% |
| 63 | Pinole | 18,761 | 5,111 | 27.2% |
| 64 | Carson | 92,871 | 24,926 | 26.8% |
| 65 | Stanton | 39,402 | 10,516 | 26.7% |
| 66 | Yorba Linda | 67,170 | 17,858 | 26.6% |
| 67 | Tustin | 78,981 | 20,669 | 26.2% |
| 68 | Campbell | 42,781 | 11,033 | 25.8% |
| 69 | Gardena | 59,422 | 15,206 | 25.6% |
| 70 | Fullerton | 140,968 | 34,646 | 24.6% |
| 71 | Rolling Hills Estates | 8,131 | 1,996 | 24.5% |
| 72 | Palos Verdes Estates | 12,925 | 3,167 | 24.5% |
| 73 | Davis | 66,978 | 16,223 | 24.2% |
| 74 | San Carlos | 29,614 | 6,938 | 23.4% |
| 75 | Tracy | 96,966 | 22,460 | 23.2% |
| 76 | Laguna Woods | 17,289 | 3,949 | 22.8% |
| 77 | Vallejo | 124,268 | 28,197 | 22.7% |
| 78 | Signal Hill | 11,468 | 2,588 | 22.6% |
| 79 | Moraga | 16,769 | 3,709 | 22.1% |
| 80 | Baldwin Park | 70,138 | 15,340 | 21.9% |
| 81 | Pacifica | 37,261 | 8,102 | 21.7% |
| 82 | Livingston | 14,606 | 3,169 | 21.7% |
| 83 | La Mirada | 47,180 | 10,008 | 21.2% |
| 84 | Danville | 43,401 | 9,186 | 21.2% |
| 85 | Stockton | 322,326 | 66,946 | 20.8% |
| 86 | Live Oak | 9,347 | 1,936 | 20.7% |
| 87 | Los Gatos | 32,786 | 6,738 | 20.6% |
| 88 | South El Monte | 19,287 | 3,953 | 20.5% |
| 89 | Berkeley | 120,257 | 24,473 | 20.4% |
| 90 | Yuba City | 69,471 | 14,047 | 20.2% |
| 91 | La Habra Heights | 5,478 | 1,103 | 20.1% |
| 92 | Sacramento | 528,706 | 106,143 | 20.1% |
| 93 | Piedmont | 10,945 | 2,191 | 20.0% |
| 94 | Folsom | 83,916 | 16,696 | 19.9% |
| 95 | Culver City | 39,931 | 7,910 | 19.8% |
| 96 | Villa Park | 5,748 | 1,131 | 19.7% |
| 97 | Lake Forest | 86,281 | 16,970 | 19.7% |
| 98 | Pittsburg | 76,257 | 14,835 | 19.5% |
| 99 | Menlo Park | 32,727 | 6,133 | 18.7% |
| 100 | Suisun City | 29,286 | 5,448 | 18.6% |
Source: U.S. Census ACS 2020-2024. 421 cities with more than 5,000 residents.
Summary
Summary: Asian Populations Across California
If you’re looking for a breakdown of Asian populations across California according to the most recent data, this is an accurate list.
The most Asian cities in California are Milpitas, Cupertino, Walnut, San Marino, Rosemead, Monterey Park, Fremont, Temple City, Diamond Bar, and Cerritos.