Most Asian cities in Idaho research summary. We analyzed Idaho’s most recent Census data to determine the most Asian cities in Idaho based on the percentage of Asian residents.

3.7% Asian · #1 most Asian in Idaho
Boise ) is the capital and most populous city of the U.S. state of Idaho, as well as the county seat of Ada County. Located on the Boise River in southwestern Idaho, the population of Boise at the 2010 Census was 205,671, the 99th largest in the United States. Its estimated population in 2016 was 223,154.
Data | Crime | Cost of living | Movers
3.4% Asian · #2 most Asian in Idaho
Data | Crime | Cost of living | Movers
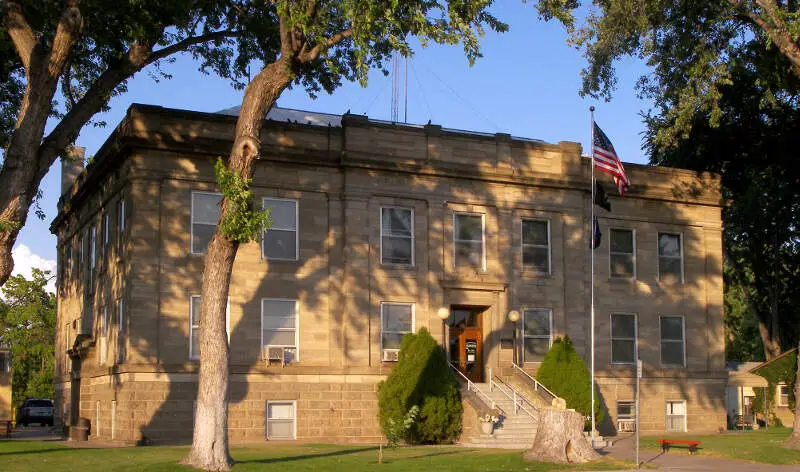
2.7% Asian · #3 most Asian in Idaho
Moscow is a city in northern Idaho along the state border with Washington, with a population of 23,800 at the 2010 census. The county seat and largest city of Latah County, Moscow is the home of the University of Idaho, the state’s land grant institution and primary research university, as well as the home of New Saint Andrews College, a Christian liberal arts college.
Data | Crime | Cost of living | Movers | Compare
2.4% Asian · #4 most Asian in Idaho
Meridian is a city located in Ada County in the US state of Idaho. As of the 2010 census, the population of Meridian was 75,092 making it the third largest city in Idaho after Boise and Nampa. A 2015 estimate placed the population at approximately 90,739. Meridian is the state’s fastest-growing city, with an 81.5 percent increase in population since 2000.
Data | Crime | Cost of living | Movers

2.0% Asian · #5 most Asian in Idaho
Pocatello ) is the county seat and largest city of Bannock County, with a small portion on the Fort Hall Indian Reservation in neighboring Power County, in the southeastern part of the U.S. state of Idaho. It is the principal city of the Pocatello metropolitan area, which encompasses all of Bannock county. As of the 2010 census the population of Pocatello was 54,255.
Data | Crime | Cost of living | Movers
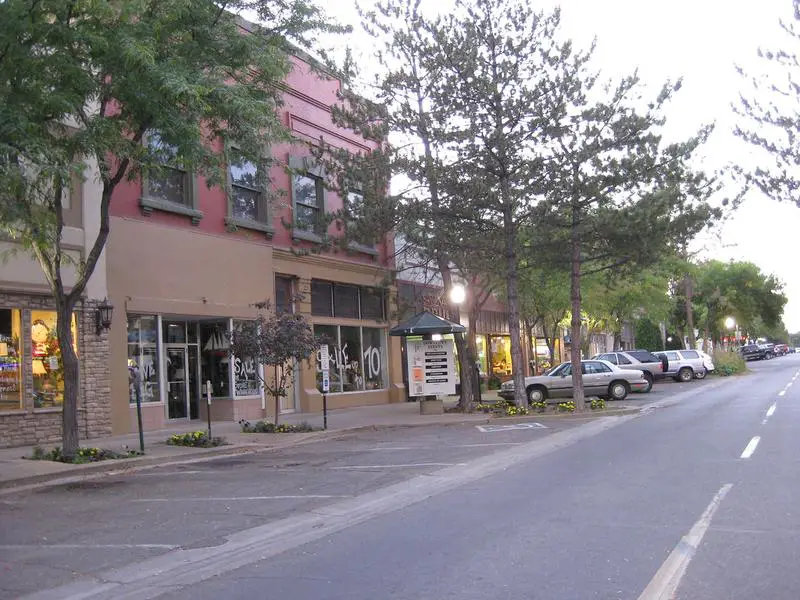
1.9% Asian · #6 most Asian in Idaho
Twin Falls is the county seat and largest city of Twin Falls County, Idaho, United States. The city had a population of 44,125 as of the 2010 census.
Data | Crime | Cost of living | Movers
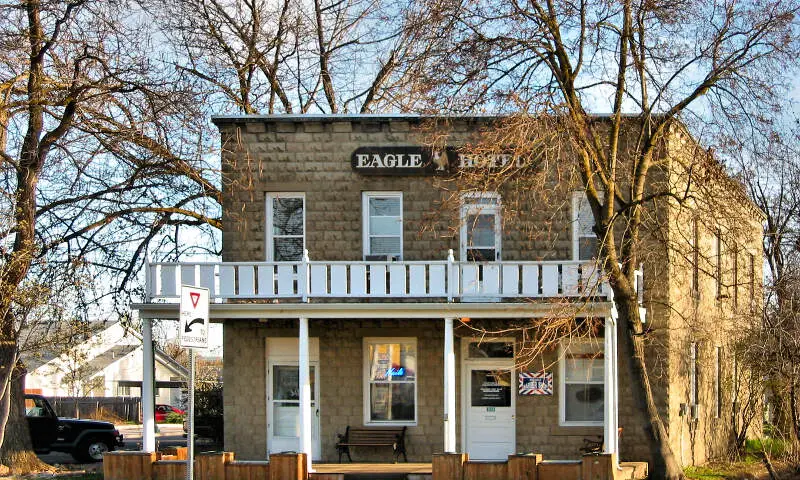
1.8% Asian · #7 most Asian in Idaho
Data | Crime | Cost of living | Movers
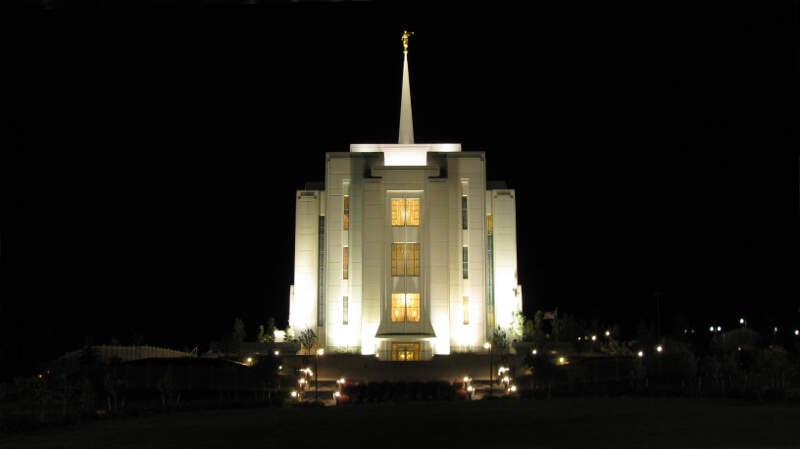
1.7% Asian · #8 most Asian in Idaho
Rexburg is a city in Madison County, Idaho, United States. The population was 25,484 at the 2010 census, up from 17,257 in 2000. The city is the county seat of Madison County and its largest city. Rexburg is the principal city of the Rexburg, ID Micropolitan Statistical Area, which includes Fremont and Madison Counties. The city is home to Brigham Young University-Idaho, a private institution operated by The Church of Jesus Christ of Latter-day Saints.
Data | Crime | Cost of living | Movers
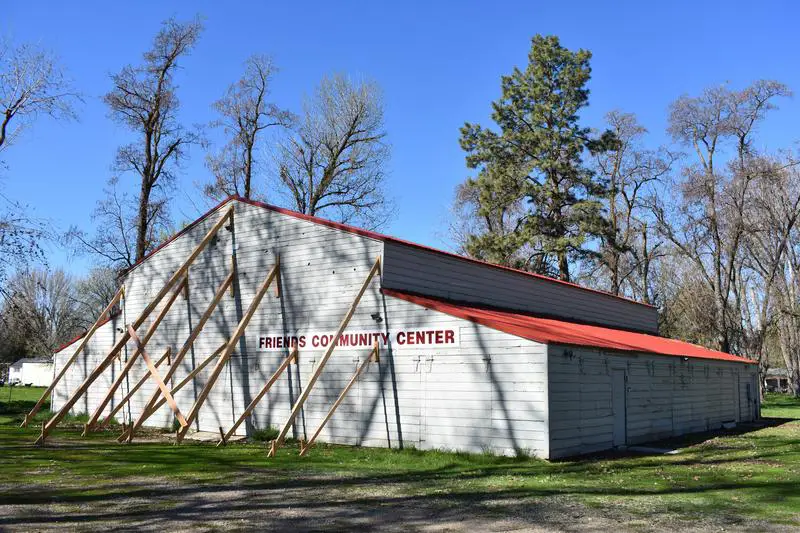
1.3% Asian · #9 most Asian in Idaho
Data | Crime | Cost of living | Movers
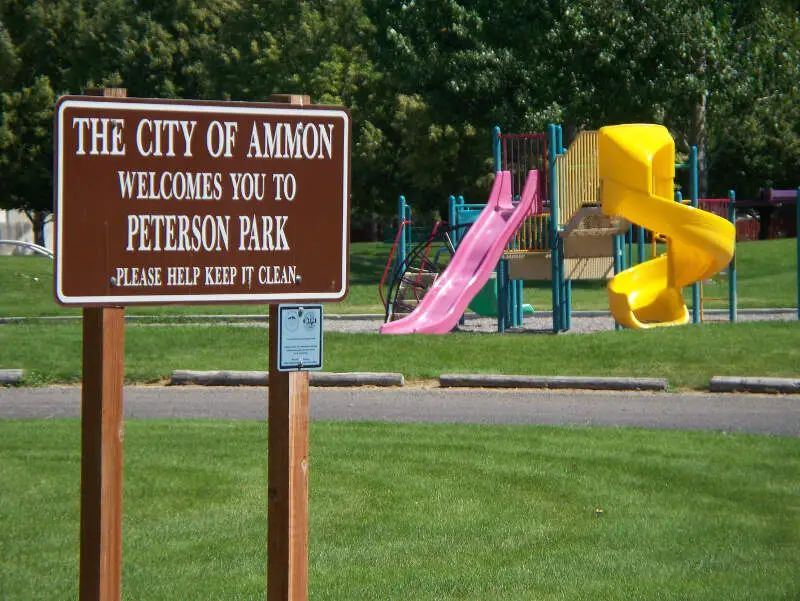
1.2% Asian · #10 most Asian in Idaho
Ammon is an edge city of Idaho Falls in Bonneville County, Idaho, United States. As of the 2010 US Census, the population of Ammon was 13,816.
Data | Crime | Cost of living | Movers
The receipts
Compare the top ten
Pick a metric. The bars rescale. The red line is Idaho’s statewide median.
On the map
Where Idaho’s Asian communities live
Saturday Night Science
Methodology: How We Determined The Cities In Idaho With The Largest Asian Population For 2026
We used Saturday Night Science to compare Census data on race across every place in Idaho.
The Census’s most recently available data comes from the 2020-2024 American Community Survey.
Specifically, we looked at table B03002: Hispanic OR LATINO ORIGIN BY RACE. Here are the category names as defined by the Census:
- Hispanic or Latino
- White alone*
- Black or African American alone*
- American Indian and Alaska Native alone*
- Asian alone*
- Native Hawaiian and Other Pacific Islander alone*
- Some other race alone*
- Two or more races*
Our particular column of interest here was the number of people who identified as Asian alone.
We limited our analysis to cities with a population greater than 5,000 people. That left us with 32 cities.
We then calculated the percentage of residents that are Asian. The percentages ranked from 3.7% to 0.0%.
Finally, we ranked each city based on the percentage of Asian population, with a higher percentage being more Asian. Boise City took the distinction of being the most Asian, while Payette was the least Asian city.
We updated this article for 2026. This report reflects our eleventh time ranking the cities in Idaho with the largest Asian population.
The full plate
Cities In Idaho By Asian Population
Click any column to sort. Search by city name.
| Rank | City | Population | Asian Population | % Asian |
|---|---|---|---|---|
| 1 | Boise City | 237,242 | 8,665 | 3.7% |
| 2 | Mountain Home | 16,493 | 566 | 3.4% |
| 3 | Moscow | 26,286 | 713 | 2.7% |
| 4 | Meridian | 130,138 | 3,072 | 2.4% |
| 5 | Pocatello | 57,635 | 1,139 | 2.0% |
| 6 | Twin Falls | 54,164 | 1,044 | 1.9% |
| 7 | Eagle | 32,855 | 603 | 1.8% |
| 8 | Rexburg | 40,543 | 697 | 1.7% |
| 9 | Star | 14,745 | 187 | 1.3% |
| 10 | Ammon | 19,064 | 232 | 1.2% |
| 11 | Emmett | 8,275 | 92 | 1.1% |
| 12 | Chubbuck | 16,126 | 176 | 1.1% |
| 13 | Kuna | 27,158 | 295 | 1.1% |
| 14 | Weiser | 5,935 | 63 | 1.1% |
| 15 | Sandpoint | 9,637 | 93 | 1.0% |
| 16 | Lewiston | 34,651 | 334 | 1.0% |
| 17 | Caldwell | 66,516 | 615 | 0.9% |
| 18 | Coeur d’Alene | 56,447 | 496 | 0.9% |
| 19 | Hayden | 16,338 | 132 | 0.8% |
| 20 | Garden City | 12,654 | 89 | 0.7% |
| 21 | Middleton | 10,649 | 71 | 0.7% |
| 22 | Nampa | 110,319 | 701 | 0.6% |
| 23 | Rathdrum | 10,874 | 61 | 0.6% |
| 24 | Post Falls | 43,391 | 241 | 0.6% |
| 25 | Idaho Falls | 67,725 | 372 | 0.5% |
| 26 | Rupert | 6,190 | 31 | 0.5% |
| 27 | Burley | 11,958 | 51 | 0.4% |
| 28 | Blackfoot | 12,782 | 19 | 0.1% |
| 29 | Jerome | 12,930 | 6 | 0.0% |
| 31 | Hailey | 9,665 | 0 | 0.0% |
| 31 | Preston | 5,928 | 0 | 0.0% |
| 31 | Payette | 8,536 | 0 | 0.0% |
Source: U.S. Census ACS 2020-2024. 32 cities with more than 5,000 residents.
Summary
Summary: Asian Populations Across Idaho
If you’re looking for a breakdown of Asian populations across Idaho according to the most recent data, this is an accurate list.
The most Asian cities in Idaho are Boise City, Mountain Home, Moscow, Meridian, Pocatello, Twin Falls, Eagle, Rexburg, Star, and Ammon. Not sold on Idaho? Take the two-minute Find Your Place quiz and see which state actually fits you.
Questions and answers
Most Asian Cities In Idaho FAQs
What is the most Asian city in Idaho?
Boise City is the most Asian city in Idaho for 2026, at 3.7% of residents. Mountain Home and Moscow are next.
What cities in Idaho have the largest Asian population?
The Idaho cities with the largest Asian population shares are Boise City, Mountain Home, Moscow, Meridian, Pocatello, Twin Falls, Eagle, Rexburg, Star, and Ammon. We ranked all 32 places with more than 5,000 residents.
What percent of Boise City is Asian?
Asian residents make up 3.7% of Boise City, the highest share of the 32 Idaho places we measured. The numbers come from the Census Bureau’s American Community Survey.
What is the least Asian city in Idaho?
Payette is the least Asian city in Idaho, at 0.0%. It sits at the opposite end of the same ranking.
Where does this data come from?
Every share is calculated from the Census Bureau’s American Community Survey (2020-2024), based on residents identifying as Asian alone. We rank each Idaho place with more than 5,000 residents.


