Most Asian cities in Kentucky research summary. We analyzed Kentucky’s most recent Census data to determine the most Asian cities in Kentucky based on the percentage of Asian residents.
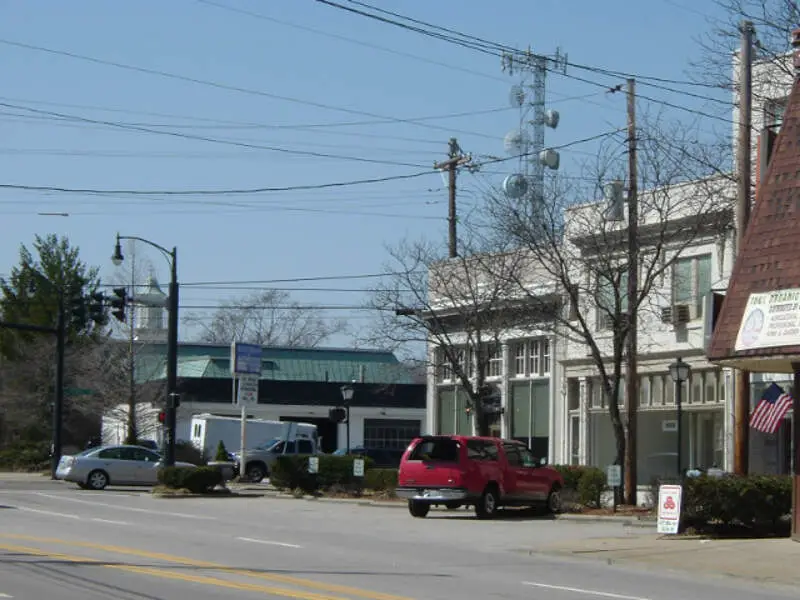
7.9% Asian · #1 most Asian in Kentucky
Middletown is an independent, home rule-class city in Jefferson County, Kentucky, United States, and a former neighborhood of Louisville. The population was 7,218 at the 2010 census.
Data | Crime | Cost of living | Movers
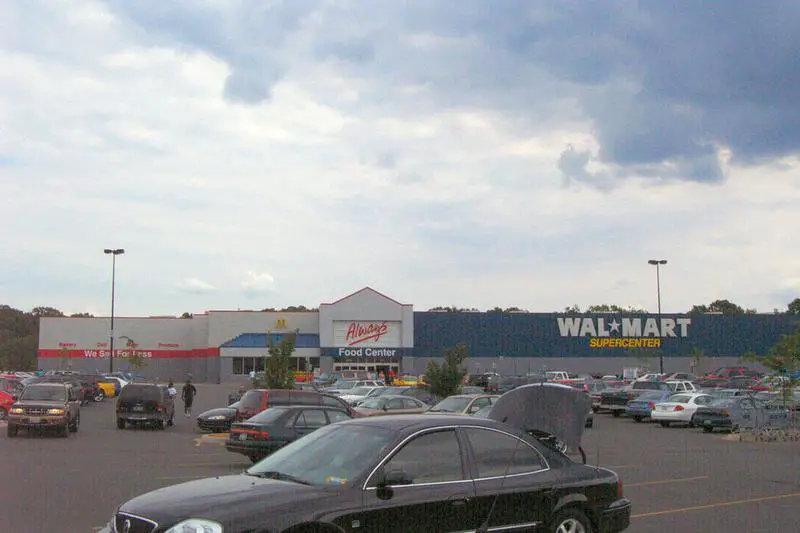
7.7% Asian · #2 most Asian in Kentucky
Bowling Green is a home rule-class city in and the county seat of Warren County, Kentucky, United States. As of 2016, its population of 65,234 made it the third most-populous city in the state after Louisville and Lexington; its metropolitan area had an estimated population of 165,732; and the combined statistical area it shares with Glasgow has an estimated population of 218,870.
Data | Crime | Cost of living | Movers
4.3% Asian · #3 most Asian in Kentucky
Lexington, consolidated with Fayette County and often denoted as Lexington-Fayette, is the second-largest city in Kentucky and the 60th-largest city in the United States. By land area, Lexington is the 28th largest city in the United States. Known as the “Horse Capital of the World,” it is the heart of the state’s Bluegrass region. With a mayor-alderman form of government, it is one of two cities in Kentucky designated by the state as first-class; the other is the state’s largest city of Louisville. In the 2016 U.S. Census Estimate, the city’s population was 318,449, anchoring a metropolitan area of 506,751 people and a combined statistical area of 723,849 people. Due to constant increases in population, Lexington suffers some of the worst traffic congestion in Kentucky, because two interstates bypass the city to the north and east, resulting in a lack of freeways going through the most populated areas of the city.
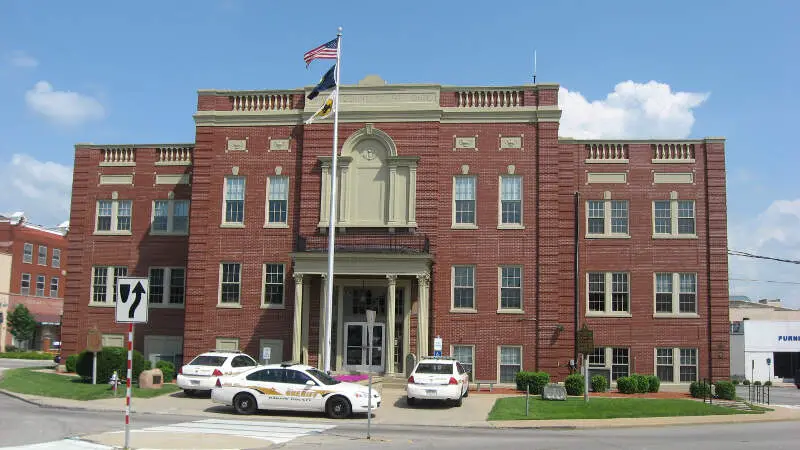
3.6% Asian · #4 most Asian in Kentucky
Murray is a home rule-class city in Calloway County, Kentucky, in the United States. It is the seat of Calloway County and the 20th-largest city in Kentucky. The city’s population was 17,741 during the 2010 U.S. census, and its micropolitan area’s population was 37,191.
Data | Crime | Cost of living | Movers
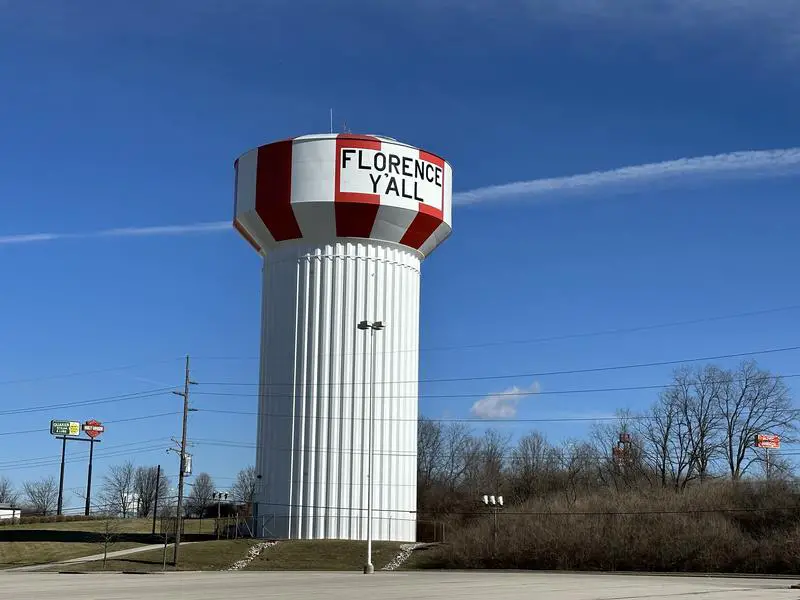
3.4% Asian · #5 most Asian in Kentucky
Florence is a home rule-class city in Boone County, Kentucky, United States. Florence is part of the Cincinnati/Northern Kentucky metropolitan area. The population was 29,951 at the 2010 census.
Data | Crime | Cost of living | Movers
3.3% Asian · #6 most Asian in Kentucky
Jeffersontown is a home rule-class city in Jefferson County, Kentucky, United States. The population was 26,595 at the 2010 U.S. census.
Data | Crime | Cost of living | Movers
3.3% Asian · #7 most Asian in Kentucky
Radcliff is a home rule-class city in Hardin County, Kentucky, in the United States. The population was 21,692 at the 2010 census, and in 2016 the estimated population was 22,490. It is included in the Elizabethtown-Fort Knox Metropolitan Area.
Data | Crime | Cost of living | Movers
3.1% Asian · #8 most Asian in Kentucky
Data | Crime | Cost of living | Movers
3.1% Asian · #9 most Asian in Kentucky
Elizabethtown is a home rule-class city and the county seat of Hardin County, Kentucky, United States. The population was 28,531 at the 2010 census, and was estimated at 29,906 by the U.S. Census Bureau in 2016, making it the 11th-largest city in the state. It is included in the Elizabethtown-Fort Knox, Kentucky Metropolitan Statistical Area, which is included in the Louisville/Jefferson County-Elizabethtown-Madison, Kentucky-Indiana Combined Statistical Area.
Data | Crime | Cost of living | Movers
2.9% Asian · #10 most Asian in Kentucky
Louisville LOO–vl or LUUV-l) is the largest city in the Commonwealth of Kentucky and the 29th-most populous city in the United States. It is one of two cities in Kentucky designated as first-class, the other being the state’s second-largest city of Lexington. Louisville is the historical seat and, since 2003, the nominal seat of Jefferson County.
The receipts
Compare the top ten
Pick a metric. The bars rescale. The red line is Kentucky’s statewide median.
On the map
Where Kentucky’s Asian communities live
Saturday Night Science
Methodology: How We Determined The Cities In Kentucky With The Largest Asian Population For 2026
We used Saturday Night Science to compare Census data on race across every place in Kentucky.
The Census’s most recently available data comes from the 2020-2024 American Community Survey.
Specifically, we looked at table B03002: Hispanic OR LATINO ORIGIN BY RACE. Here are the category names as defined by the Census:
- Hispanic or Latino
- White alone*
- Black or African American alone*
- American Indian and Alaska Native alone*
- Asian alone*
- Native Hawaiian and Other Pacific Islander alone*
- Some other race alone*
- Two or more races*
Our particular column of interest here was the number of people who identified as Asian alone.
We limited our analysis to cities with a population greater than 5,000 people. That left us with 75 cities.
We then calculated the percentage of residents that are Asian. The percentages ranked from 7.9% to 0.0%.
Finally, we ranked each city based on the percentage of Asian population, with a higher percentage being more Asian. Middletown took the distinction of being the most Asian, while Cynthiana was the least Asian city.
We updated this article for 2026. This report reflects our eleventh time ranking the cities in Kentucky with the largest Asian population.
The full plate
Cities In Kentucky By Asian Population
Click any column to sort. Search by city name.
| Rank | City | Population | Asian Population | % Asian |
|---|---|---|---|---|
| 1 | Middletown | 9,763 | 776 | 7.9% |
| 2 | Bowling Green | 75,388 | 5,802 | 7.7% |
| 3 | Lexington-Fayette urban county | 323,725 | 14,064 | 4.3% |
| 4 | Murray | 18,080 | 647 | 3.6% |
| 5 | Florence | 32,803 | 1,128 | 3.4% |
| 6 | Jeffersontown | 29,199 | 964 | 3.3% |
| 7 | Radcliff | 22,864 | 753 | 3.3% |
| 8 | Hillview | 8,797 | 273 | 3.1% |
| 9 | Elizabethtown | 32,576 | 1,004 | 3.1% |
| 10 | Louisville/Jefferson County metro government (balance) | 631,818 | 18,458 | 2.9% |
| 11 | Lyndon | 11,030 | 318 | 2.9% |
| 12 | Douglass Hills | 5,474 | 152 | 2.8% |
| 13 | Elsmere | 9,205 | 251 | 2.7% |
| 14 | Owensboro | 60,302 | 1,601 | 2.7% |
| 15 | Alexandria | 10,562 | 273 | 2.6% |
| 16 | Pikeville | 7,490 | 179 | 2.4% |
| 17 | Frankfort | 28,503 | 664 | 2.3% |
| 18 | St. Matthews | 17,577 | 405 | 2.3% |
| 19 | Nicholasville | 32,197 | 721 | 2.2% |
| 20 | Highland Heights | 6,444 | 139 | 2.2% |
| 21 | Morehead | 6,870 | 137 | 2.0% |
| 22 | Edgewood | 8,447 | 160 | 1.9% |
| 23 | Union | 7,642 | 139 | 1.8% |
| 24 | Oak Grove | 7,962 | 131 | 1.6% |
| 25 | Paducah | 26,845 | 385 | 1.4% |
| 26 | Richmond | 37,111 | 511 | 1.4% |
| 27 | Erlanger | 19,875 | 264 | 1.3% |
| 28 | Winchester | 19,213 | 253 | 1.3% |
| 29 | Mount Sterling | 7,551 | 93 | 1.2% |
| 30 | Villa Hills | 7,480 | 83 | 1.1% |
| 31 | Hopkinsville | 30,906 | 336 | 1.1% |
| 32 | Madisonville | 19,515 | 210 | 1.1% |
| 33 | Glasgow | 15,197 | 154 | 1.0% |
| 34 | Independence | 29,392 | 294 | 1.0% |
| 35 | La Grange | 10,311 | 99 | 1.0% |
| 36 | Covington | 41,110 | 393 | 1.0% |
| 37 | Campbellsville | 11,622 | 106 | 0.9% |
| 38 | Bellevue | 5,636 | 51 | 0.9% |
| 39 | London | 7,561 | 68 | 0.9% |
| 40 | Cold Spring | 6,341 | 54 | 0.9% |
| 41 | Georgetown | 39,117 | 333 | 0.9% |
| 42 | Shelbyville | 17,668 | 139 | 0.8% |
| 43 | Berea | 15,786 | 109 | 0.7% |
| 44 | Middlesborough | 9,123 | 61 | 0.7% |
| 45 | Fort Thomas | 17,169 | 109 | 0.6% |
| 46 | Henderson | 27,852 | 174 | 0.6% |
| 47 | Lebanon | 6,430 | 38 | 0.6% |
| 48 | Mount Washington | 18,480 | 107 | 0.6% |
| 49 | Mayfield | 9,868 | 57 | 0.6% |
| 50 | Versailles | 10,492 | 57 | 0.5% |
| 51 | Flatwoods | 7,269 | 35 | 0.5% |
| 52 | Danville | 17,327 | 75 | 0.4% |
| 53 | Dayton | 5,743 | 24 | 0.4% |
| 54 | Central City | 5,707 | 22 | 0.4% |
| 55 | Russellville | 7,316 | 28 | 0.4% |
| 56 | Williamsburg | 5,270 | 20 | 0.4% |
| 57 | Ashland | 21,295 | 78 | 0.4% |
| 58 | Newport | 13,967 | 48 | 0.3% |
| 59 | Bardstown | 13,804 | 38 | 0.3% |
| 60 | Somerset | 12,216 | 28 | 0.2% |
| 61 | Fort Wright | 5,887 | 13 | 0.2% |
| 62 | Franklin | 10,360 | 22 | 0.2% |
| 63 | Paris | 10,160 | 19 | 0.2% |
| 64 | Taylor Mill | 6,937 | 12 | 0.2% |
| 65 | Lawrenceburg | 11,943 | 16 | 0.1% |
| 66 | Maysville | 8,737 | 10 | 0.1% |
| 67 | Shepherdsville | 14,533 | 16 | 0.1% |
| 68 | Corbin | 8,246 | 9 | 0.1% |
| 69 | Harrodsburg | 9,313 | 10 | 0.1% |
| 70 | Monticello | 5,753 | 6 | 0.1% |
| 71 | Shively | 15,638 | 10 | 0.1% |
| 73 | Leitchfield | 6,819 | 0 | 0.0% |
| 73 | Princeton | 6,241 | 0 | 0.0% |
| 73 | Fort Mitchell | 8,713 | 0 | 0.0% |
| 73 | Cynthiana | 6,458 | 0 | 0.0% |
Source: U.S. Census ACS 2020-2024. 75 cities with more than 5,000 residents.
Summary
Summary: Asian Populations Across Kentucky
If you’re looking for a breakdown of Asian populations across Kentucky according to the most recent data, this is an accurate list.
The most Asian cities in Kentucky are Middletown, Bowling Green, Lexington-Fayette urban county, Murray, Florence, Jeffersontown, Radcliff, Hillview, Elizabethtown, and Louisville/Jefferson County metro government (balance).


