
Most Asian cities in Nebraska research summary. We analyzed Nebraska’s most recent Census data to determine the most Asian cities in Nebraska based on the percentage of Asian residents. Here are the results of our analysis:
-
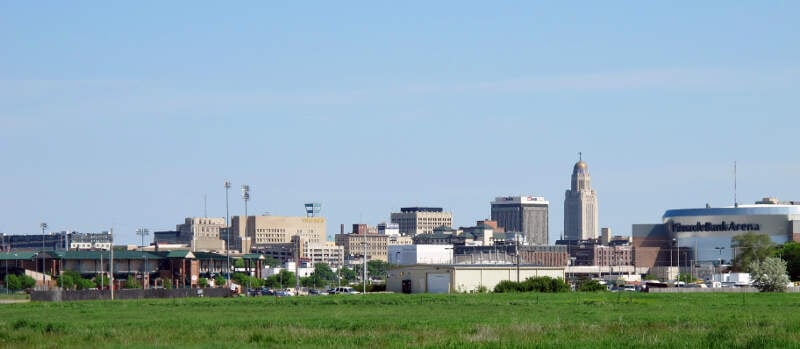
The most Asian city in Nebraska is Lincoln based on the most recent Census data.
-
Lincoln is 4.43% Asian.
-
The least Asian city in Nebraska is Holdrege.
-
Holdrege is 0.07% Asian.
-
Nebraska is 2.6% Asian.
-
Nebraska is the 29th most Asian state in the United States.
Table Of Contents: Top Ten | Methodology | Summary | Table
Here are the cities in Nebraska with the largest Asian population in 2026:
Which city in Nebraska had the largest Asian population? Lincoln took the number one overall spot for the largest Asian in Nebraska for 2026. 4.43% of Lincoln identify as Asian.
Read below to see how we crunched the numbers and how your town ranked.
To see where Nebraska ranked as a state on diversity, we have a ranking of the most diverse states in America.
And if you already knew these places were Asian, check out the best places to live in Nebraska or the most diverse places in Nebraska.
The 10 Most Asian Cities In Nebraska For 2026

/10
Population: 294,856
% Asian: 4.43%
# Of Asian Residents: 13,075
More on Lincoln: Data | Crime | Cost Of Living | Movers

/10
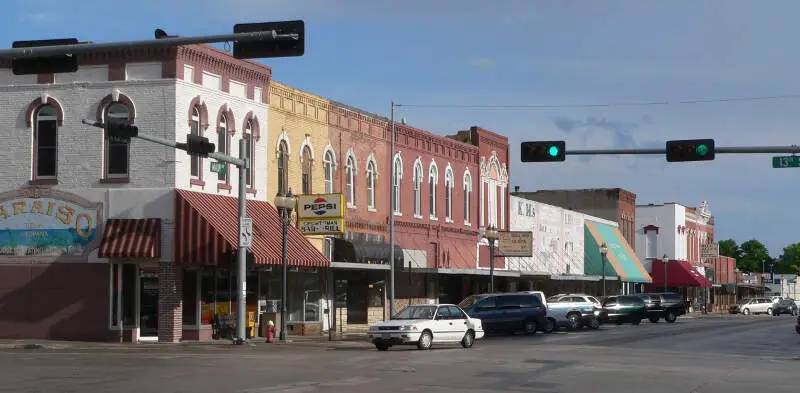
Population: 7,527
% Asian: 4.28%
# Of Asian Residents: 322
More on Crete: Data | Crime | Cost Of Living | Movers


/10
Population: 488,837
% Asian: 4.02%
# Of Asian Residents: 19,669
More on Omaha: Data | Crime | Cost Of Living | Movers
/10
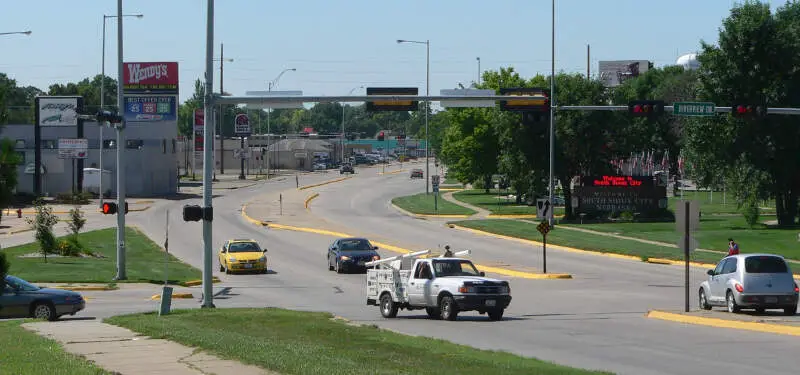
Population: 13,907
% Asian: 3.35%
# Of Asian Residents: 466
More on South Sioux City: Data | Crime | Cost Of Living | Movers

/10
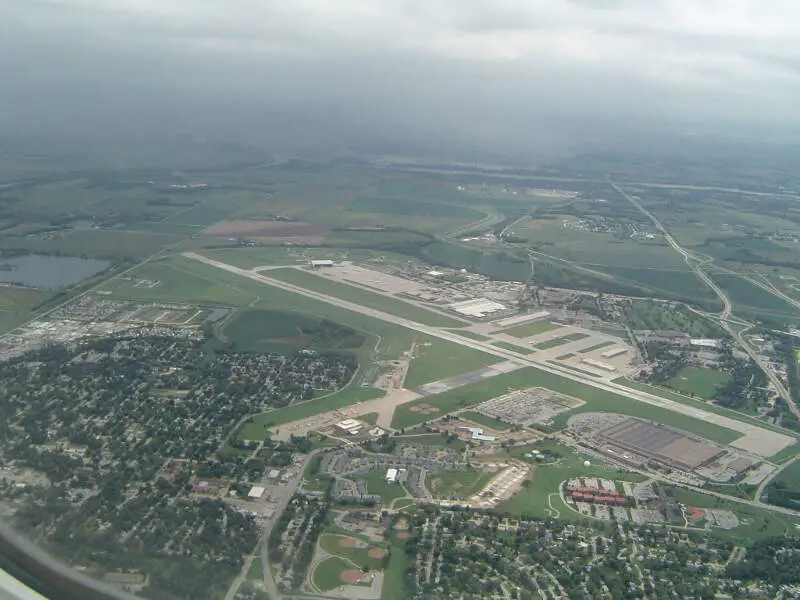
Population: 64,510
% Asian: 3.09%
# Of Asian Residents: 1,991
More on Bellevue: Data | Crime | Cost Of Living | Movers

/10
Population: 34,246
% Asian: 2.36%
# Of Asian Residents: 807
More on Kearney: Data | Crime | Cost Of Living | Movers

/10
Population: 6,419
% Asian: 1.95%
# Of Asian Residents: 125
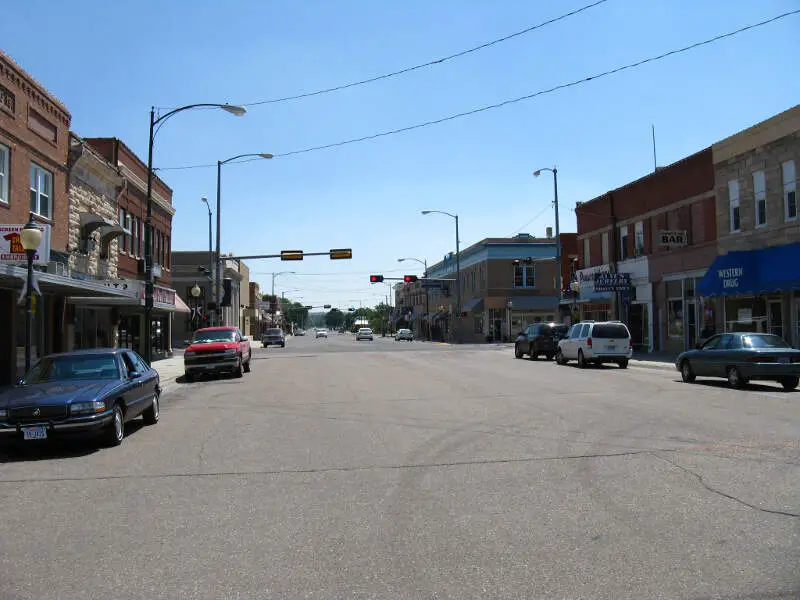
More on Sidney: Data | Crime | Cost Of Living | Movers

/10
Population: 5,160
% Asian: 1.72%
# Of Asian Residents: 89
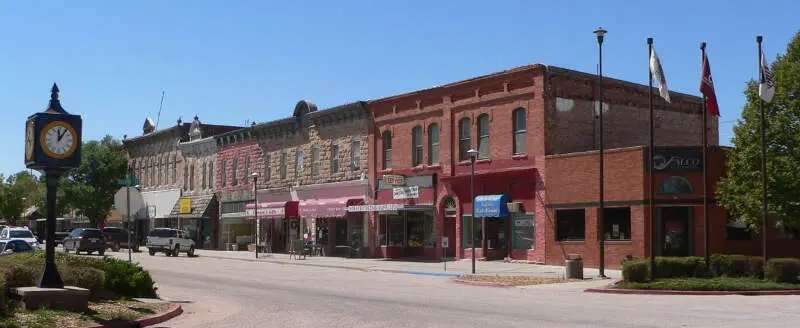
More on Chadron: Data | Crime | Cost Of Living | Movers

/10
Population: 16,563
% Asian: 1.67%
# Of Asian Residents: 277
More on La Vista: Data | Crime | Cost Of Living | Movers

/10
Population: 12,225
% Asian: 1.16%
# Of Asian Residents: 142
More on Beatrice: Data | Crime | Cost Of Living | Movers
Methodology: How We Determined The Cities In Nebraska With The Largest Asian Population For 2026
We used Saturday Night Science to compare Census data on race across every place in Nebraska.
The Census’s most recently available data comes from the 2020-2024 American Community Survey.
Specifically, we looked at table B03002: Hispanic OR LATINO ORIGIN BY RACE. Here are the category names as defined by the Census:
- Hispanic or Latino
- White alone*
- Black or African American alone*
- American Indian and Alaska Native alone*
- Asian alone*
- Native Hawaiian and Other Pacific Islander alone*
- Some other race alone*
- Two or more races*
Our particular column of interest here was the number of people who identified as Asian alone.
We limited our analysis to cities with a population greater than 5,000 people. That left us with 31 cities.
We then calculated the percentage of residents that are Asian. The percentages ranked from 4.4% to 0.1%.
Finally, we ranked each city based on the percentage of Asian population, with a higher score being more Asian than a lower score. Lincoln took the distinction of being the most Asian, while Holdrege was the least Asian city.
We updated this article for 2026. This report reflects our eleventh time ranking the cities in Nebraska with the largest Asian population.
Read on for more information on how the cities in Nebraska ranked by population of Asian residents or, for a more general take on diversity in America, head over to our ranking of the most diverse cities in America.
Summary: Asian Populations Across Nebraska
If you’re looking for a breakdown of Asian populations across Nebraska according to the most recent data, this is an accurate list.
The most Asian cities in Nebraska are Lincoln, Crete, Omaha, South Sioux City, Bellevue, Kearney, Sidney, Chadron, La Vista, and Beatrice.
If you’re curious enough, here are the least Asian places in Nebraska:
- Holdrege
- Columbus
- McCook
For more Nebraska reading, check out:
- Best Places To Retire In Nebraska
- Safest Places In Nebraska
- Best Places To Raise A Family In Nebraska
Table: Asian Population By City In Nebraska
| Rank | City | Population | Asian Population | % Asian |
|---|---|---|---|---|
| 1 | Lincoln | 294,856 | 13,075 | 4.43% |
| 2 | Crete | 7,527 | 322 | 4.28% |
| 3 | Omaha | 488,837 | 19,669 | 4.02% |
| 4 | South Sioux City | 13,907 | 466 | 3.35% |
| 5 | Bellevue | 64,510 | 1,991 | 3.09% |
| 6 | Kearney | 34,246 | 807 | 2.36% |
| 7 | Sidney | 6,419 | 125 | 1.95% |
| 8 | Chadron | 5,160 | 89 | 1.72% |
| 9 | La Vista | 16,563 | 277 | 1.67% |
| 10 | Beatrice | 12,225 | 142 | 1.16% |
| 11 | Lexington | 10,862 | 126 | 1.16% |
| 12 | Grand Island | 52,884 | 603 | 1.14% |
| 13 | Papillion | 25,244 | 285 | 1.13% |
| 14 | Hastings | 25,008 | 277 | 1.11% |
| 15 | Norfolk | 26,054 | 263 | 1.01% |
| 16 | Gering | 8,550 | 76 | 0.89% |
| 17 | York | 8,141 | 71 | 0.87% |
| 18 | North Platte | 22,831 | 173 | 0.76% |
| 19 | Seward | 7,678 | 57 | 0.74% |
| 20 | Scottsbluff | 14,376 | 74 | 0.51% |
| 21 | Plattsmouth | 6,731 | 30 | 0.45% |
| 22 | Alliance | 8,075 | 32 | 0.4% |
| 23 | Fremont | 27,567 | 104 | 0.38% |
| 24 | Wayne | 6,121 | 22 | 0.36% |
| 25 | Nebraska City | 7,369 | 26 | 0.35% |
| 26 | Schuyler | 6,578 | 21 | 0.32% |
| 27 | Ralston | 6,472 | 20 | 0.31% |
| 28 | Blair | 7,914 | 19 | 0.24% |
| 29 | Mccook | 7,314 | 15 | 0.21% |
| 30 | Columbus | 24,488 | 29 | 0.12% |
| 31 | Holdrege | 5,546 | 4 | 0.07% |