Racial diversity in Idaho is a mixed bag.
There are parts of Idaho where there’s a high level of diversity. But where will you find the most diverse places in Idaho?
To answer that question, we went to the US Census data. Using Saturday Night Science, we measured the Gini coefficient for all 36 cities in Idaho to rank them from most to least diverse.
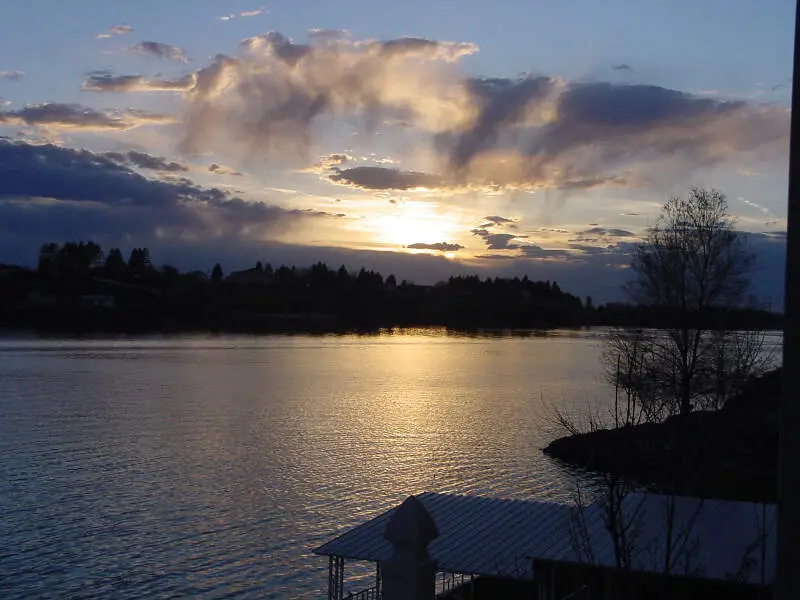
#1 most diverse in Idaho
Data | Crime | Cost of living | Movers
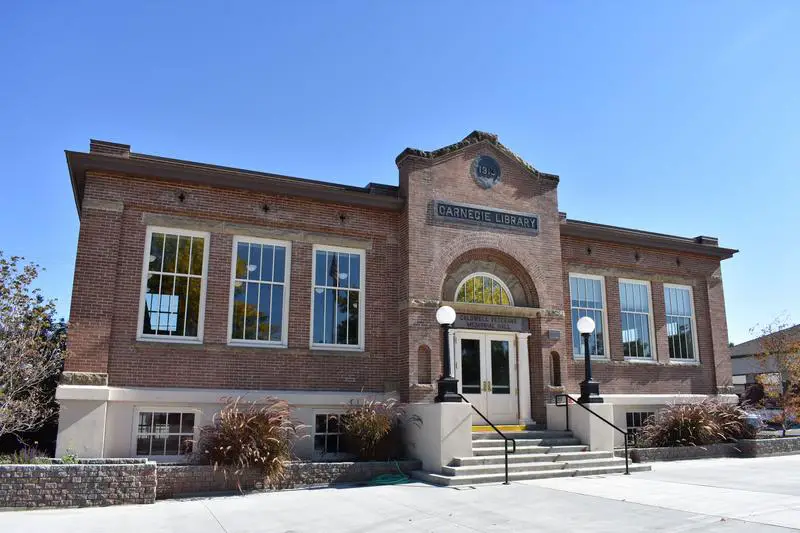
#2 most diverse in Idaho
Caldwell is a city in and the county seat of Canyon County, Idaho, United States. The population was 46,237 at the 2010 census.
Data | Crime | Cost of living | Movers
#3 most diverse in Idaho
Data | Crime | Cost of living | Movers
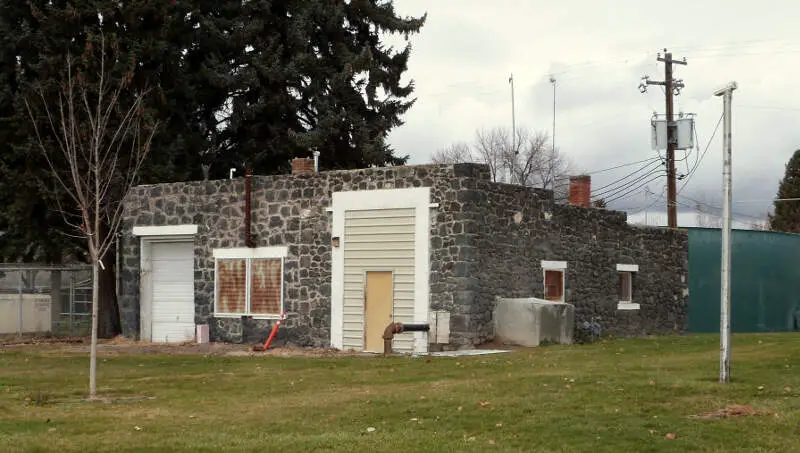
#4 most diverse in Idaho
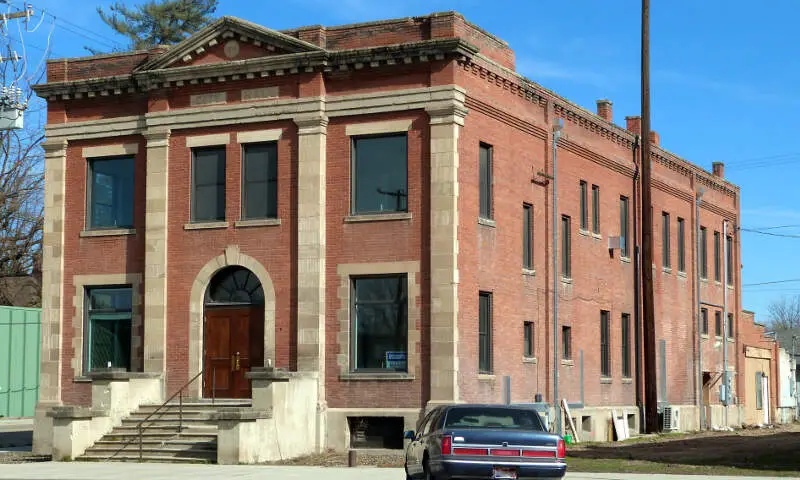
Rupert is the county seat and largest city of Minidoka County, Idaho, United States. It is part of the Burley Micropolitan Statistical Area. The population was 5,554 at the 2010 census.
Data | Crime | Cost of living | Movers
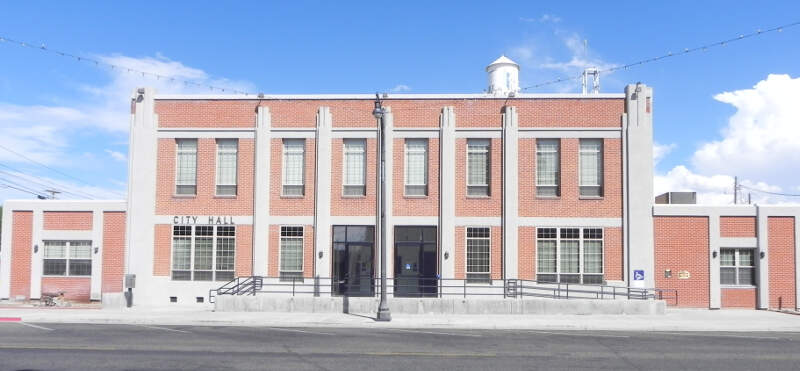
#5 most diverse in Idaho
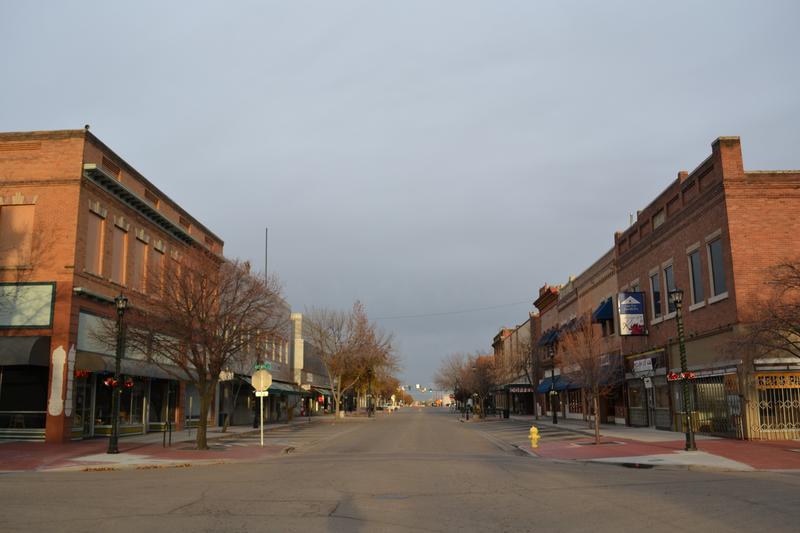
Payette is a city in and the county seat of Payette County, Idaho, United States. The population was 7,433 at the 2010 census. It is part of the Ontario, ORID Micropolitan Statistical Area.
Data | Crime | Cost of living | Movers
#6 most diverse in Idaho
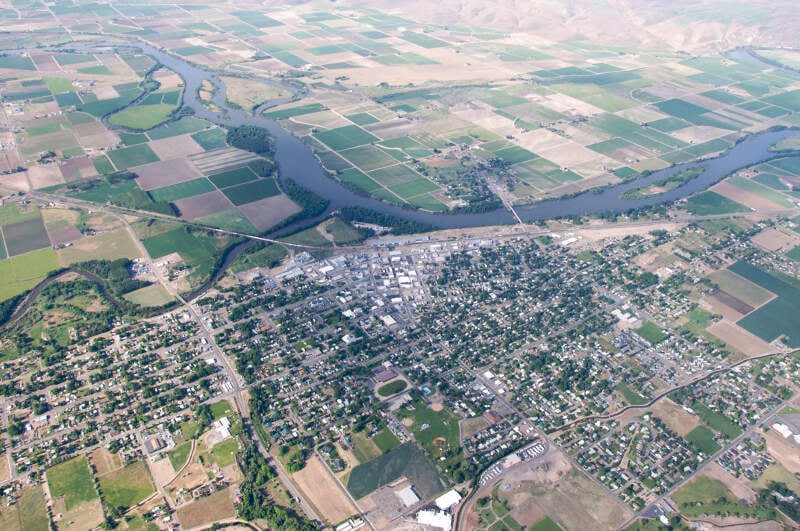
Weiser is a city in the rural western part of the U.S. state of Idaho and the county seat of Washington County. With its mild climate, the city supports farm, orchard, and livestock endeavors in the vicinity. The city sits at the confluence of the Weiser River with the great Snake River, which marks the border with Oregon. The population was 5,507 at the 2010 census.
Data | Crime | Cost of living | Movers
#7 most diverse in Idaho
Nampa ) is the largest city of Canyon County, Idaho. The population of Nampa was 81,557 at the 2010 census making it the second-most populous city in Idaho. Nampa is located about 20 miles west of Boise along Interstate 84, and six miles west of Meridian. Nampa is the second principal city of the Boise-Nampa metropolitan area. The name “Nampa” may have come from a Shoshoni word meaning either moccasin or footprint.
Data | Crime | Cost of living | Movers
#8 most diverse in Idaho
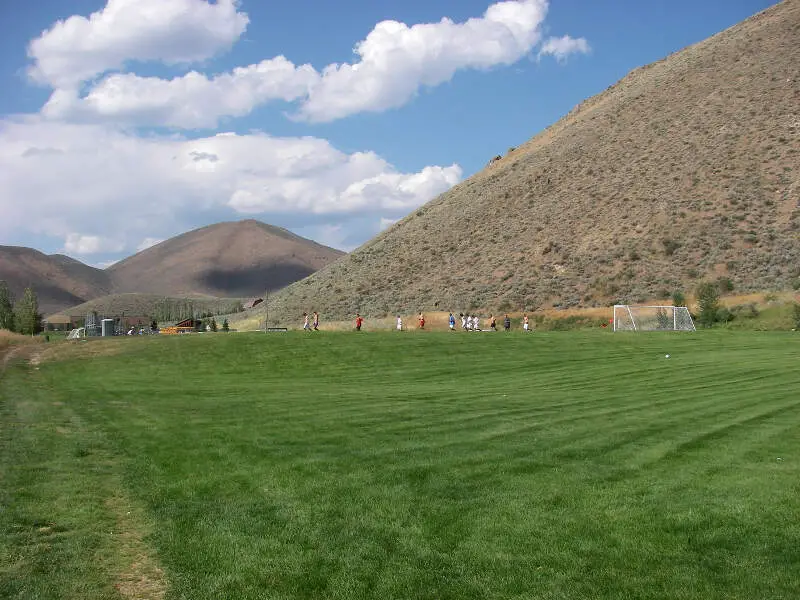
Hailey is a city in and the county seat of Blaine County, in the Wood River Valley of the central part of the U.S. state of Idaho.
The city is named after John Hailey, a two-time Congressional delegate from the Idaho Territory.
Data | Crime | Cost of living | Movers
#8 most diverse in Idaho
Fruitland is a city in Payette County, Idaho, United States. It lies along U.S. Route 95 in the Treasure Valley of southwest Idaho, about 50 miles west of Boise on the border with Oregon. It is part of the Ontario Micropolitan Area. Fruitland is named after the apple orchards that surround the community, and its slogan is “The Big Apple of Idaho.”
Data | Crime | Cost of living | Movers
#10 most diverse in Idaho
Data | Crime | Cost of living | Movers
The receipts
Compare the top ten
Pick a metric. The bars rescale. The red line is Idaho’s statewide median.
On the map
Where diversity lives in Idaho
Saturday Night Science
Methodology: How we determined the most diverse cities in Idaho for 2026
We still believe in the accuracy of data — especially from the Census — and Saturday Night Science. So that’s where we went to get the race breakdown across Idaho.
That leads us to the Census’s most recently available data, the 2020-2024 American Community Survey data from the US Census.
Specifically, we looked at table B03002: HISPANIC OR LATINO ORIGIN BY RACE. Here are the category names as defined by the Census:
- White alone*
- Black or African American alone*
- American Indian and Alaska Native alone*
- Asian alone*
- Native Hawaiian and Other Pacific Islander alone*
- Some other race alone*
- Two or more races*
- Hispanic or Latino
We limited our analysis to non-CDPs with a population greater than 5,000 people. That left us with 36 cities.
We then calculated the HHI for each city by finding the racial breakdown of a city in percent terms, squaring them, and then adding the squares together. This left us with scores ranging from 4,475 (Burley) to 8,313 (Preston).
Finally, we ranked each city based on the HHI, with a lower score being more diverse than a high score. Burley took the distinction of being the most diverse, while Preston was the least diverse city.
We updated this article for 2026. This report is our eleventh time ranking the most diverse places in Idaho.
The full plate
Race By City In Idaho For 2026
Click any column to sort. Search by city name.
| Rank | City | Population | HHI | % White | % Black | % Hispanic | % Asian |
|---|---|---|---|---|---|---|---|
| 1 | Burley | 11,958 | 4,475 | 57.1% | 0.6% | 34.5% | 0.4% |
| 2 | Caldwell | 66,516 | 4,504 | 56.0% | 0.3% | 36.8% | 0.9% |
| 3 | Jerome | 12,930 | 4,635 | 45.2% | 0.1% | 50.8% | 0.0% |
| 4 | Rupert | 6,190 | 4,854 | 46.0% | 0.0% | 52.3% | 0.5% |
| 5 | Payette | 8,536 | 5,041 | 65.8% | 0.2% | 26.1% | 0.0% |
| 6 | Weiser | 5,935 | 5,172 | 66.6% | 0.4% | 26.5% | 1.1% |
| 7 | Nampa | 110,319 | 5,198 | 67.3% | 1.2% | 25.4% | 0.6% |
| 8 | Hailey | 9,665 | 5,213 | 65.6% | 0.0% | 29.8% | 0.0% |
| 8 | Fruitland | 6,663 | 5,212 | 68.0% | 0.0% | 23.5% | 2.6% |
| 10 | Mountain Home | 16,493 | 5,214 | 69.8% | 2.7% | 17.4% | 3.4% |
| 11 | Kimberly | 5,111 | 5,343 | 65.1% | 0.0% | 33.2% | 0.2% |
| 12 | Twin Falls | 54,164 | 5,807 | 74.0% | 1.2% | 17.3% | 1.9% |
| 13 | Middleton | 10,649 | 6,045 | 75.9% | 0.4% | 15.4% | 0.7% |
| 13 | Blackfoot | 12,782 | 6,045 | 75.4% | 0.3% | 18.6% | 0.1% |
| 15 | Chubbuck | 16,126 | 6,107 | 76.6% | 0.4% | 14.9% | 1.1% |
| 16 | Shelley | 5,092 | 6,220 | 76.9% | 0.3% | 16.2% | 0.5% |
| 17 | Idaho Falls | 67,725 | 6,294 | 77.5% | 0.5% | 16.7% | 0.5% |
| 18 | Boise City | 237,242 | 6,456 | 79.5% | 1.6% | 9.6% | 3.7% |
| 19 | Emmett | 8,275 | 6,501 | 79.2% | 0.0% | 14.7% | 1.1% |
| 20 | Meridian | 130,138 | 6,634 | 80.6% | 1.2% | 10.5% | 2.4% |
| 21 | Pocatello | 57,635 | 6,685 | 81.0% | 1.1% | 9.6% | 2.0% |
| 22 | Star | 14,745 | 6,688 | 80.9% | 0.4% | 10.8% | 1.3% |
| 23 | Moscow | 26,286 | 6,726 | 81.4% | 1.4% | 6.8% | 2.7% |
| 24 | Rexburg | 40,543 | 6,732 | 81.2% | 1.2% | 11.2% | 1.7% |
| 25 | Garden City | 12,654 | 6,779 | 81.3% | 0.7% | 12.4% | 0.7% |
| 26 | Post Falls | 43,391 | 7,214 | 84.4% | 0.2% | 7.1% | 0.6% |
| 27 | Ammon | 19,064 | 7,239 | 84.3% | 0.1% | 11.6% | 1.2% |
| 28 | Eagle | 32,855 | 7,291 | 84.9% | 0.5% | 7.8% | 1.8% |
| 29 | Kuna | 27,158 | 7,328 | 85.0% | 0.4% | 9.4% | 1.1% |
| 30 | Coeur d’Alene | 56,447 | 7,348 | 85.3% | 0.5% | 5.0% | 0.9% |
| 31 | Hayden | 16,338 | 7,685 | 87.3% | 0.5% | 6.5% | 0.8% |
| 32 | Sandpoint | 9,637 | 7,793 | 88.0% | 0.2% | 5.7% | 1.0% |
| 33 | Lewiston | 34,651 | 7,874 | 88.5% | 0.2% | 4.2% | 1.0% |
| 34 | Rigby | 5,404 | 7,900 | 88.5% | 0.1% | 8.2% | 0.3% |
| 35 | Rathdrum | 10,874 | 7,977 | 89.0% | 0.0% | 3.7% | 0.6% |
| 36 | Preston | 5,928 | 8,313 | 91.0% | 0.0% | 4.9% | 0.0% |
Source: U.S. Census ACS 2020-2024. 36 cities with more than 5,000 residents.
Summary
Summary: Diversity Across Idaho
If you’re looking for a scientific breakdown of diversity across Idaho, this is an accurate list.
The most diverse cities in Idaho are Burley, Caldwell, Jerome, Rupert, Payette, Weiser, Nampa, Hailey, Fruitland, and Mountain Home.


