Racial diversity in Massachusetts is a mixed bag.
There are parts of Massachusetts where there’s a high level of diversity. But where will you find the most diverse places in Massachusetts?
To answer that question, we went to the US Census data. Using Saturday Night Science, we measured the Gini coefficient for all 48 cities in Massachusetts to rank them from most to least diverse.
Table Of Contents: Top Ten | Methodology | Summary | Table
Here are the 10 most diverse places in Massachusetts for 2026:
So what city is the most diverse in Massachusetts? According to the most Census data, Brockton took the number one over all spot for diversity in Massachusetts.
Read on below to see how we crunched the numbers and how your town ranked. To see where Massachusetts ranked as a state, we have a ranking of the most diverse states in Ameria.
For more Massachusetts reading:
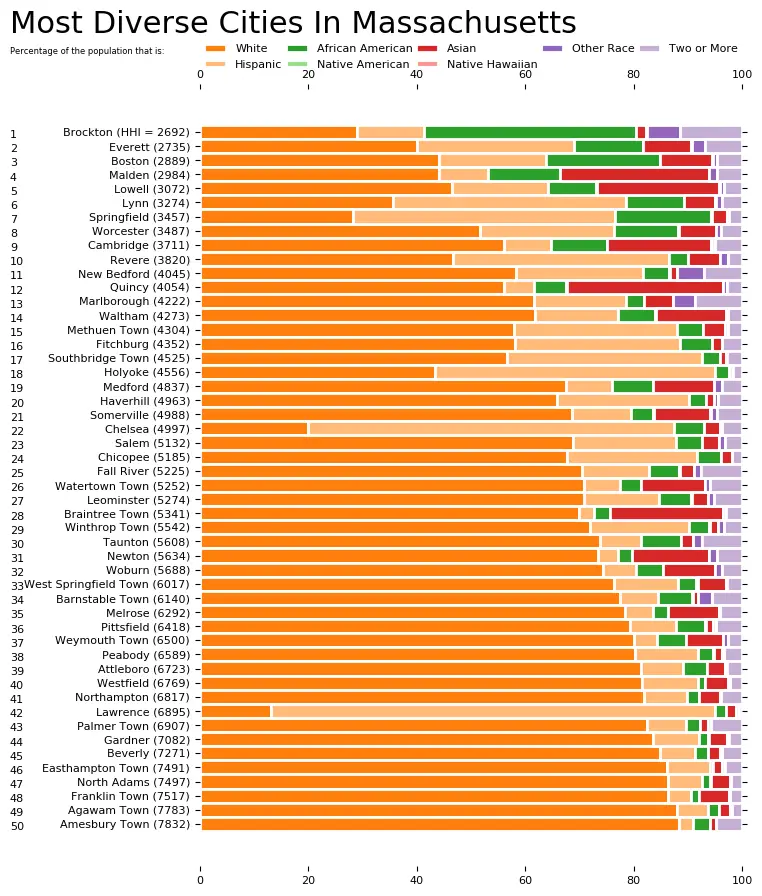
The 10 Most Diverse Places In Massachusetts For 2026

/10
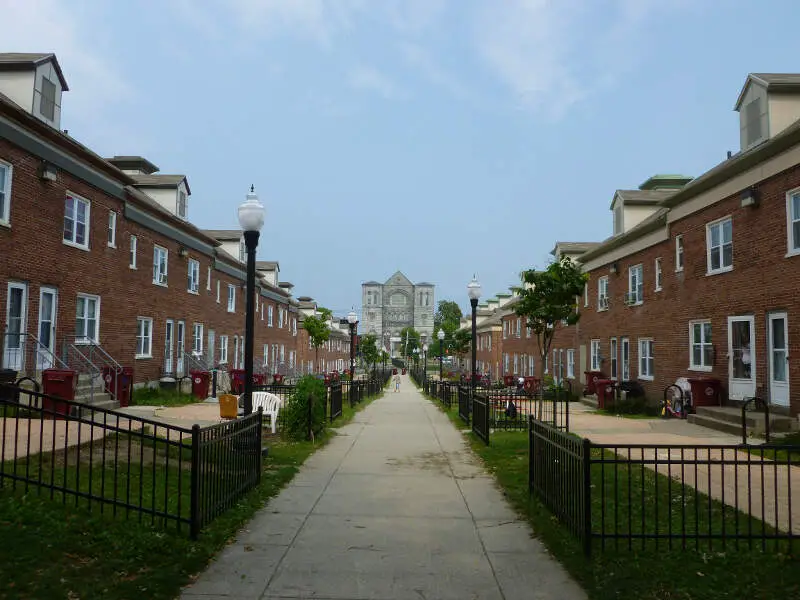
Population: 105,386
HHI: 2,356
% White: 26.8%
% African American: 33.5%
% Hispanic: 12.6%
% Asian: 2.4%
More on Brockton: Data | Crime | Cost Of Living | Movers

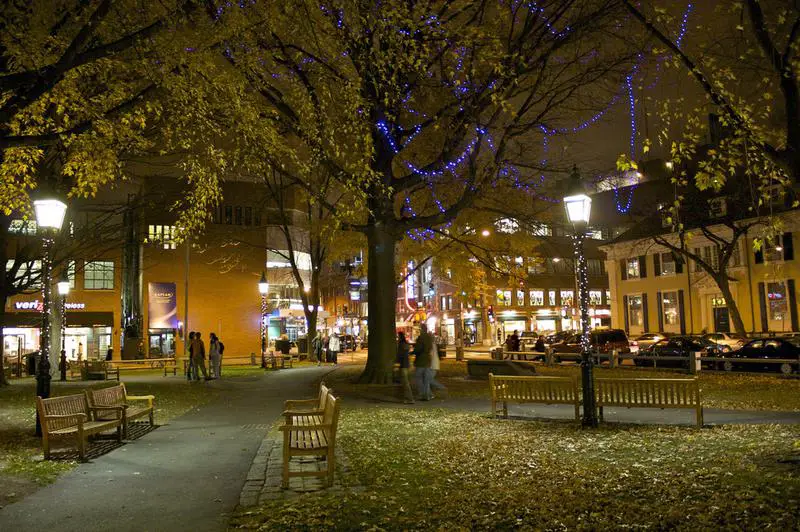
/10
Population: 50,045
HHI: 2,533
% White: 34.4%
% African American: 9.4%
% Hispanic: 32.5%
% Asian: 8.2%
More on Everett: Data | Crime | Cost Of Living | Movers

/10
Population: 65,906
HHI: 2,624
% White: 38.7%
% African American: 13.2%
% Hispanic: 9.5%
% Asian: 28.1%
More on Malden: Data | Crime | Cost Of Living | Movers

/10
Population: 118,368
HHI: 2,795
% White: 42.3%
% African American: 9.9%
% Hispanic: 20.0%
% Asian: 22.0%
More on Lowell: Data | Crime | Cost Of Living | Movers

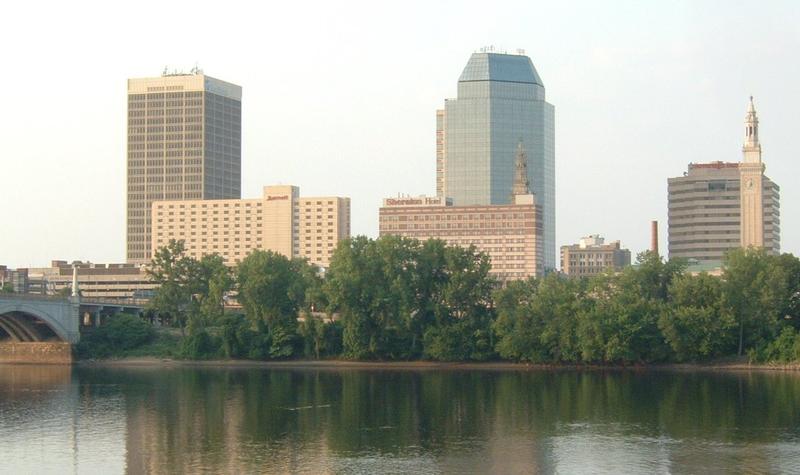
/10
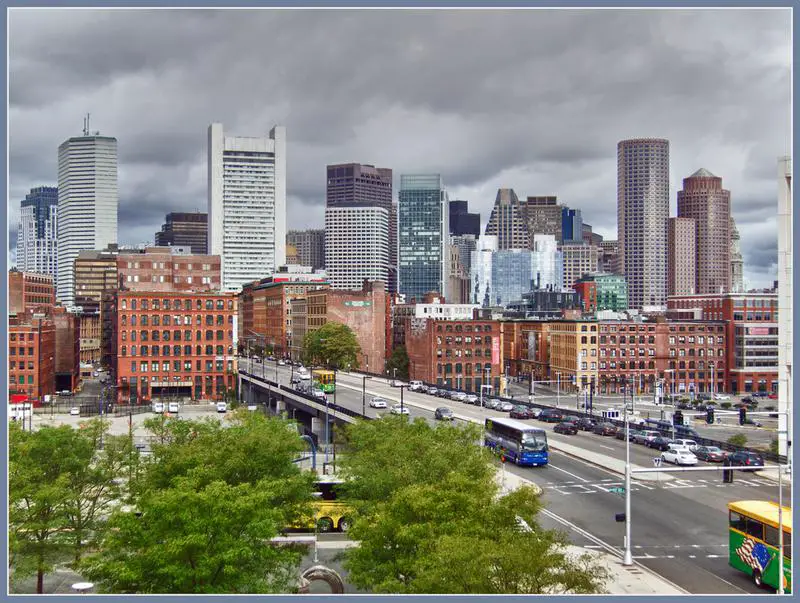
Population: 666,442
HHI: 2,826
% White: 44.1%
% African American: 19.3%
% Hispanic: 19.3%
% Asian: 10.3%
More on Boston: Data | Crime | Cost Of Living | Movers

/10
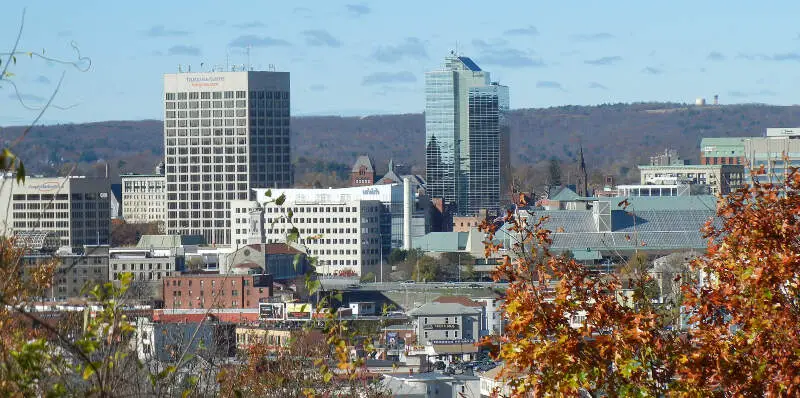
Population: 207,055
HHI: 3,232
% White: 48.6%
% African American: 12.1%
% Hispanic: 25.3%
% Asian: 7.2%
More on Worcester: Data | Crime | Cost Of Living | Movers

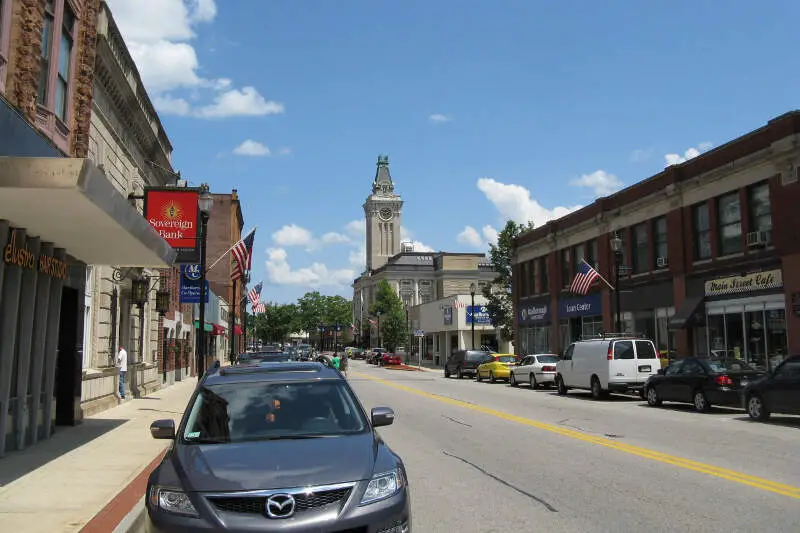
/10
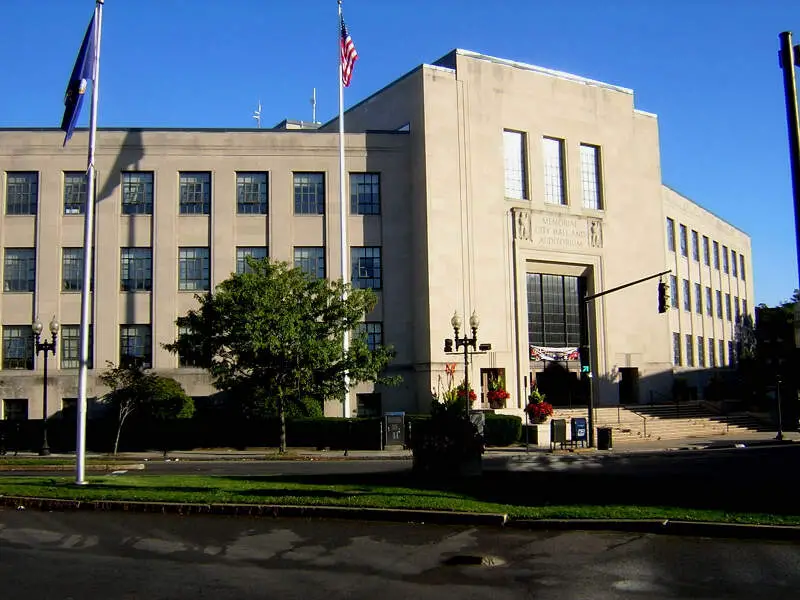
Population: 101,709
HHI: 3,330
% White: 32.7%
% African American: 10.0%
% Hispanic: 45.9%
% Asian: 6.2%
More on Lynn: Data | Crime | Cost Of Living | Movers

/10
Population: 154,749
HHI: 3,459
% White: 27.8%
% African American: 17.5%
% Hispanic: 48.6%
% Asian: 2.7%
More on Springfield: Data | Crime | Cost Of Living | Movers

/10
Population: 118,796
HHI: 3,519
% White: 53.8%
% African American: 10.3%
% Hispanic: 8.8%
% Asian: 20.2%
More on Cambridge: Data | Crime | Cost Of Living | Movers

/10
Population: 41,647
HHI: 3,528
% White: 54.1%
% African American: 3.7%
% Hispanic: 18.0%
% Asian: 5.3%
More on Marlborough: Data | Crime | Cost Of Living | Movers
Methodology: How we determined the most diverse cities in Massachusetts for 2026
We still believe in the accuracy of data — especially from the Census — and Saturday Night Science. So that’s where we went to get the race breakdown across Massachusetts.
That leads us to the Census’s most recently available data, the 2020-2024 American Community Survey data from the US Census.
Specifically, we looked at table B03002: HISPANIC OR LATINO ORIGIN BY RACE. Here are the category names as defined by the Census:
- White alone*
- Black or African American alone*
- American Indian and Alaska Native alone*
- Asian alone*
- Native Hawaiian and Other Pacific Islander alone*
- Some other race alone*
- Two or more races*
- Hispanic or Latino
We limited our analysis to non-CDPs with a population greater than 12,000 people. That left us with 48 cities.
We then calculated the HHI for each city by finding the racial breakdown of a city in percent terms, squaring them, and then adding the squares together. This left us with scores ranging from 2,356 (Brockton) to 8,314 (Newburyport).
Finally, we ranked each city based on the HHI, with a lower score being more diverse than a high score. Brockton took the distinction of being the most diverse, while Newburyport was the least diverse city.
We updated this article for 2026. This report is our eleventh time ranking the most diverse places in Massachusetts.
Summary: Diversity Across Massachusetts
If you’re looking for a scientific breakdown of diversity across Massachusetts, this is an accurate list.
The most diverse cities in Massachusetts are Brockton, Everett, Malden, Lowell, Boston, Worcester, Lynn, Springfield, Cambridge, and Marlborough.
If you’re curious enough, here are the least diverse places in Massachusetts:
- Newburyport
- Gloucester
- Agawam Town
For more Massachusetts reading, check out:
- Best Places To Live In Massachusetts
- Cheapest Places To Live In Massachusetts
- Most Dangerous Cities In Massachusetts
- Best Places To Raise A Family In Massachusetts
- Safest Places In Massachusetts
- Worst Places To Live In Massachusetts
Race By City In Massachusetts For 2026
| Rank | City | Population | HHI | % White | % Black | % Hispanic | % Asian |
|---|---|---|---|---|---|---|---|
| 1 | Brockton, MA | 105,386 | 2,356 | 26.8% | 33.5% | 12.6% | 2.4% |
| 2 | Everett, MA | 50,045 | 2,533 | 34.4% | 9.4% | 32.5% | 8.2% |
| 3 | Malden, MA | 65,906 | 2,624 | 38.7% | 13.2% | 9.5% | 28.1% |
| 4 | Lowell, MA | 118,368 | 2,795 | 42.3% | 9.9% | 20.0% | 22.0% |
| 5 | Boston, MA | 666,442 | 2,826 | 44.1% | 19.3% | 19.3% | 10.3% |
| 6 | Worcester, MA | 207,055 | 3,232 | 48.6% | 12.1% | 25.3% | 7.2% |
| 7 | Lynn, MA | 101,709 | 3,330 | 32.7% | 10.0% | 45.9% | 6.2% |
| 8 | Springfield, MA | 154,749 | 3,459 | 27.8% | 17.5% | 48.6% | 2.7% |
| 9 | Cambridge, MA | 118,796 | 3,519 | 53.8% | 10.3% | 8.8% | 20.2% |
| 10 | Marlborough, MA | 41,647 | 3,528 | 54.1% | 3.7% | 18.0% | 5.3% |
| 11 | New Bedford, MA | 100,998 | 3,733 | 54.1% | 4.4% | 25.8% | 1.3% |
| 12 | Revere, MA | 60,012 | 3,769 | 46.6% | 4.4% | 39.3% | 4.2% |
| 13 | Waltham, MA | 64,902 | 3,818 | 57.6% | 8.3% | 15.9% | 12.6% |
| 14 | Quincy, MA | 102,114 | 3,820 | 53.7% | 6.0% | 6.5% | 29.1% |
| 15 | Fitchburg, MA | 41,798 | 3,933 | 52.4% | 6.0% | 33.5% | 2.3% |
| 16 | Southbridge Town, MA | 17,928 | 4,331 | 52.6% | 2.9% | 39.3% | 2.3% |
| 17 | Holyoke, MA | 37,813 | 4,540 | 42.3% | 2.4% | 52.4% | 0.9% |
| 18 | Somerville, MA | 81,036 | 4,616 | 65.6% | 4.4% | 11.4% | 11.5% |
| 19 | Medford, MA | 59,354 | 4,666 | 66.0% | 6.3% | 8.7% | 13.0% |
| 20 | Chicopee, MA | 55,295 | 4,812 | 63.6% | 4.4% | 27.1% | 1.8% |
| 21 | Haverhill, MA | 67,698 | 4,813 | 63.9% | 2.7% | 26.5% | 1.4% |
| 22 | Fall River, MA | 94,082 | 4,873 | 67.6% | 5.6% | 13.5% | 2.7% |
| 23 | Salem, MA | 44,795 | 4,892 | 66.4% | 4.6% | 20.7% | 3.4% |
| 24 | Chelsea, MA | 39,908 | 4,922 | 17.7% | 7.1% | 67.3% | 2.1% |
| 25 | Leominster, MA | 43,909 | 4,959 | 68.0% | 4.9% | 16.0% | 3.1% |
| 26 | Braintree Town, MA | 38,899 | 4,985 | 66.8% | 3.4% | 3.2% | 22.2% |
| 27 | Newton, MA | 89,044 | 5,044 | 68.4% | 2.4% | 4.5% | 17.4% |
| 28 | Taunton, MA | 60,433 | 5,178 | 70.3% | 7.7% | 9.0% | 1.9% |
| 29 | Woburn, MA | 41,939 | 5,330 | 71.7% | 4.4% | 8.1% | 8.0% |
| 30 | West Springfield Town, MA | 28,772 | 5,361 | 71.4% | 3.8% | 13.7% | 7.3% |
| 31 | Peabody, MA | 54,695 | 5,524 | 72.5% | 4.3% | 14.6% | 2.5% |
| 32 | Winthrop Town, MA | 18,759 | 5,644 | 72.8% | 3.2% | 18.1% | 1.4% |
| 33 | Barnstable Town, MA | 49,568 | 5,901 | 75.8% | 5.7% | 4.8% | 1.1% |
| 34 | Pittsfield, MA | 43,457 | 5,994 | 76.3% | 5.2% | 10.0% | 1.3% |
| 35 | Melrose, MA | 29,650 | 6,083 | 76.9% | 1.6% | 5.2% | 11.0% |
| 36 | Attleboro, MA | 46,762 | 6,088 | 77.1% | 5.5% | 9.2% | 4.3% |
| 37 | Gardner, MA | 21,148 | 6,189 | 77.6% | 4.0% | 10.7% | 2.4% |
| 38 | Northampton, MA | 30,962 | 6,305 | 78.6% | 2.7% | 9.2% | 3.8% |
| 39 | Weymouth Town, MA | 58,505 | 6,336 | 78.9% | 4.0% | 4.4% | 7.9% |
| 40 | Franklin Town, MA | 33,154 | 6,841 | 82.2% | 2.1% | 5.3% | 6.0% |
| 41 | Westfield, MA | 40,378 | 7,041 | 83.3% | 0.7% | 9.4% | 3.1% |
| 42 | Lawrence, MA | 88,736 | 7,068 | 11.6% | 2.0% | 83.2% | 1.7% |
| 43 | Palmer Town, MA | 12,381 | 7,117 | 83.9% | 3.7% | 4.9% | 0.0% |
| 44 | Beverly, MA | 42,665 | 7,177 | 84.3% | 2.8% | 6.1% | 1.7% |
| 45 | North Adams, MA | 12,606 | 7,455 | 86.0% | 1.5% | 5.9% | 4.0% |
| 46 | Agawam Town, MA | 28,539 | 7,507 | 86.3% | 2.8% | 6.1% | 1.9% |
| 47 | Gloucester, MA | 30,075 | 7,821 | 88.2% | 1.3% | 5.3% | 1.7% |
| 48 | Newburyport, MA | 18,652 | 8,314 | 91.0% | 0.4% | 2.7% | 0.9% |


