Most Hispanic/Latino cities in New Mexico research summary. We used Saturday Night Science to analyze New Mexico’s most recent Census data to determine the most Hispanic/Latino cities based on the percentage of Hispanic/Latino residents.
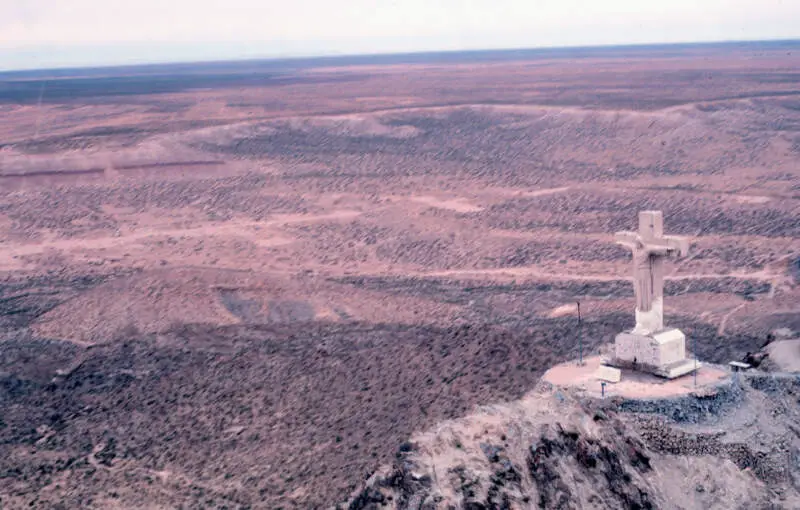
93.6% Hispanic · #1 most Hispanic in New Mexico
Sunland Park is a city in southern Doa Ana County, New Mexico, United States, on the borders of Texas and the Mexican state of Chihuahua, with Ciudad Jurez adjoining it on the south and El Paso, Texas on the east. The community of Santa Teresa adjoins it on the northwest. The population of Sunland Park was 14,106 at the 2010 census and was estimated at 15,400 by the United States Census Bureau in 2014. Though it lies adjacent to El Paso, being in Doa Ana County makes it a part of the Las Cruces metropolitan statistical area. Las Cruces is 42 miles to the north.
Data | Crime | Cost of living | Movers
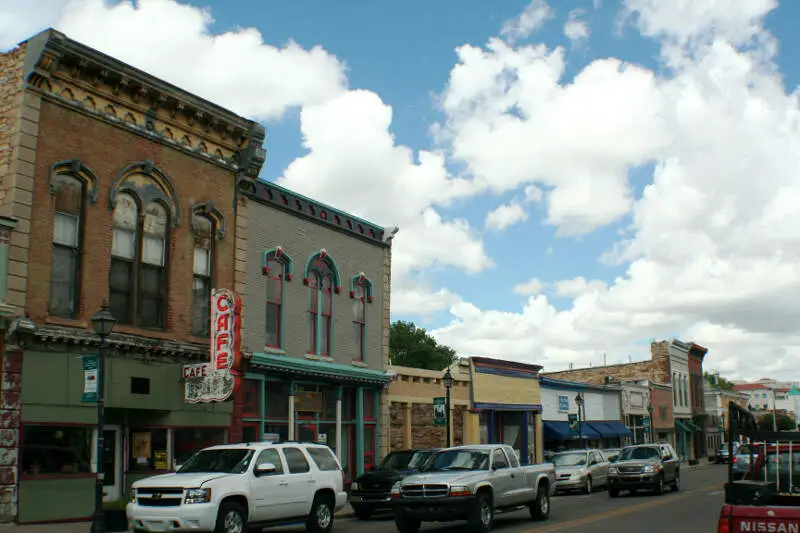
76.3% Hispanic · #2 most Hispanic in New Mexico
Las Vegas is a city in and the county seat of San Miguel County, New Mexico, United States. Once two separate municipalities both named Las Vegas, west Las Vegas and east Las Vegas, separated by the Gallinas River, retain distinct characters and separate, rival school districts. The population was 14,565 at the 2000 census. Las Vegas, NM is located 110 miles south of Raton, New Mexico, 65 miles east of Santa Fe, New Mexico, 122 miles northeast of Albuquerque, New Mexico, 257 miles south of Colorado Springs, Colorado, and 326 miles south of Denver, Colorado.
Data | Crime | Cost of living | Movers

71.9% Hispanic · #3 most Hispanic in New Mexico
Deming is a city in Luna County, New Mexico, United States, located 60 miles west of Las Cruces and thirty-three miles north of the Mexican border. The population was 14,855 according to the 2010 census. Deming is the county seat and principal community of Luna County.
Data | Crime | Cost of living | Movers
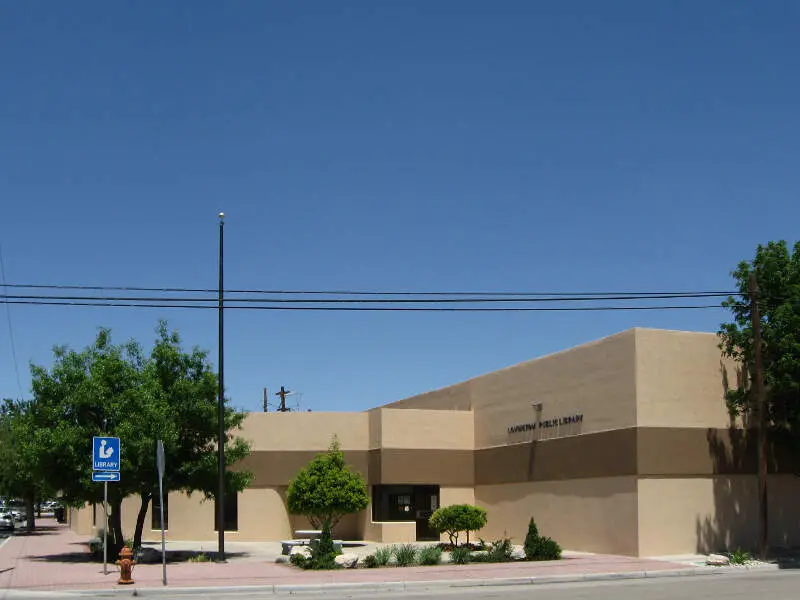
69.1% Hispanic · #4 most Hispanic in New Mexico
Data | Crime | Cost of living | Movers
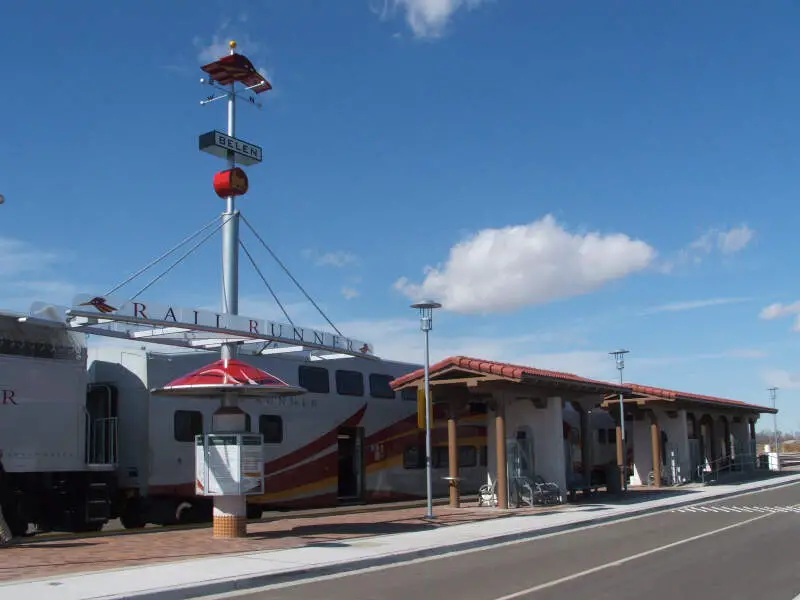
68.2% Hispanic · #5 most Hispanic in New Mexico
Belen is the second most populous city in Valencia County, New Mexico, United States, after its county seat Los Lunas. The population was 7,152 in 2015 census data.
Data | Crime | Cost of living | Movers
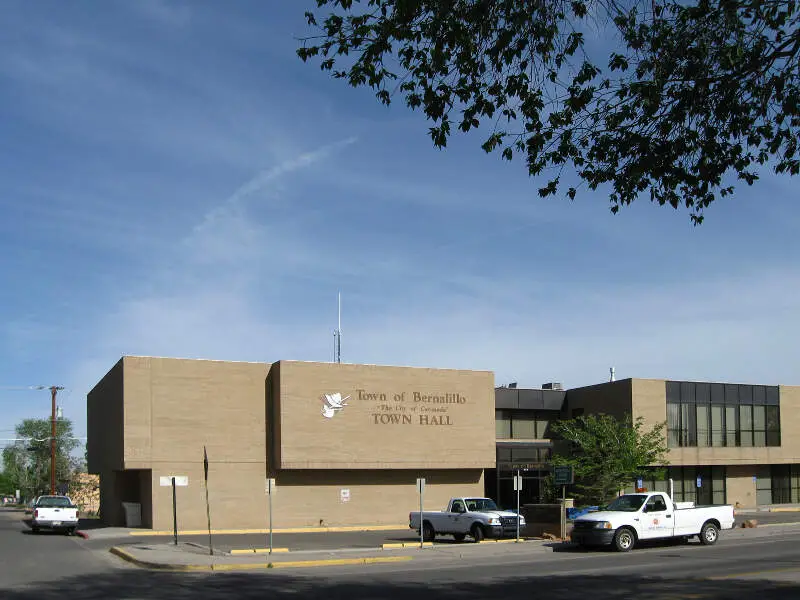
66.0% Hispanic · #6 most Hispanic in New Mexico
Bernalillo is a town in Sandoval County, New Mexico, in the United States. As of the 2010 census, the town population was 8,320. It is the county seat of Sandoval County.
Data | Crime | Cost of living | Movers
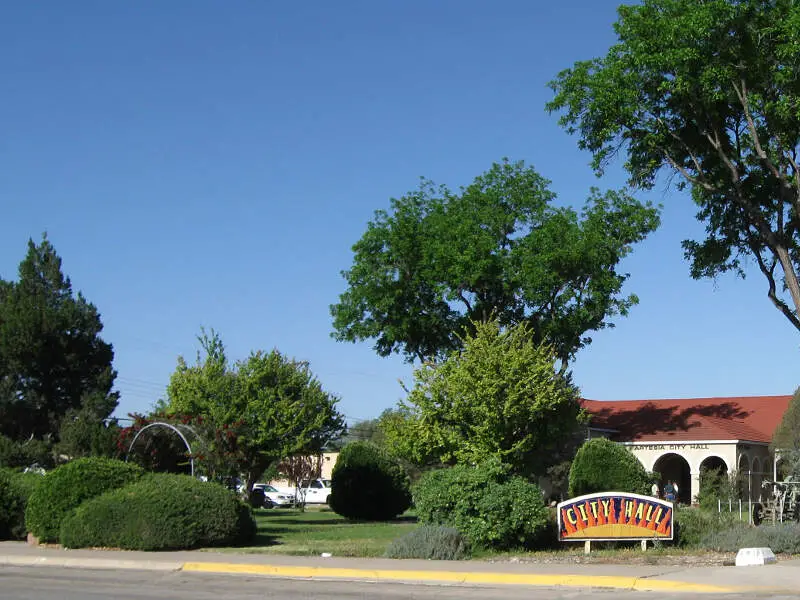
64.8% Hispanic · #7 most Hispanic in New Mexico
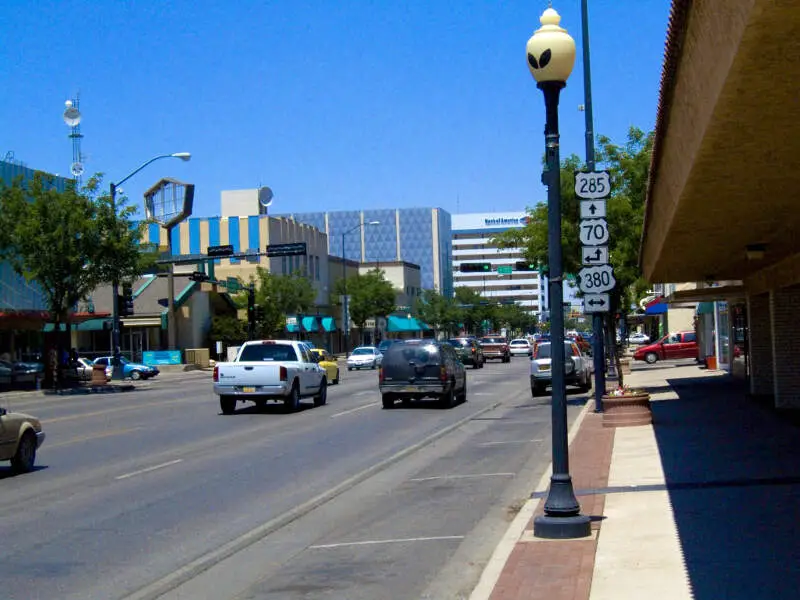
Artesia is a city in Eddy County, New Mexico, United States, centered at the intersection of U.S. Route 82 and U.S. Route 285; the two highways serve as the city’s Main Street and First Street, respectively. As of the 2010 census, the city population was 11,301.
Data | Crime | Cost of living | Movers
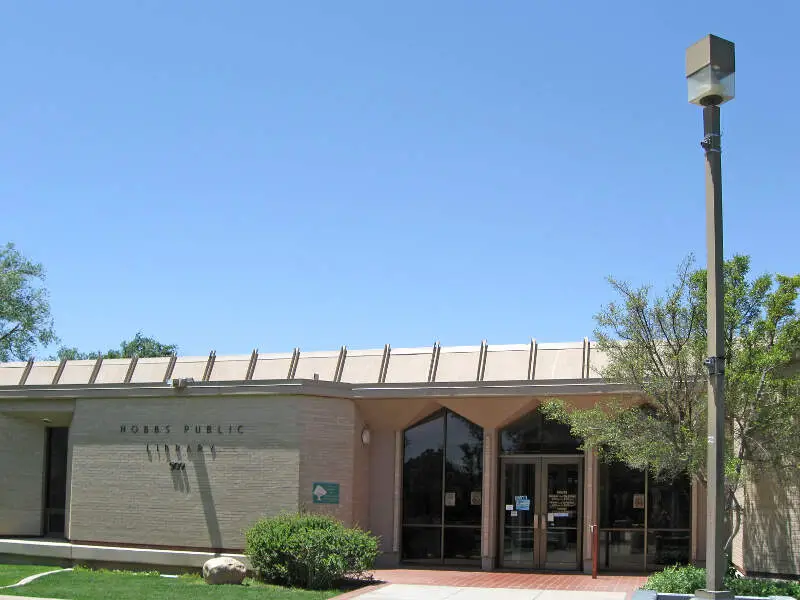
62.9% Hispanic · #8 most Hispanic in New Mexico
Hobbs is a city in Lea County, New Mexico, United States. The population was 34,122 at the 2010 Census, increasing from 28,657 at the 2000 census.
Data | Crime | Cost of living | Movers
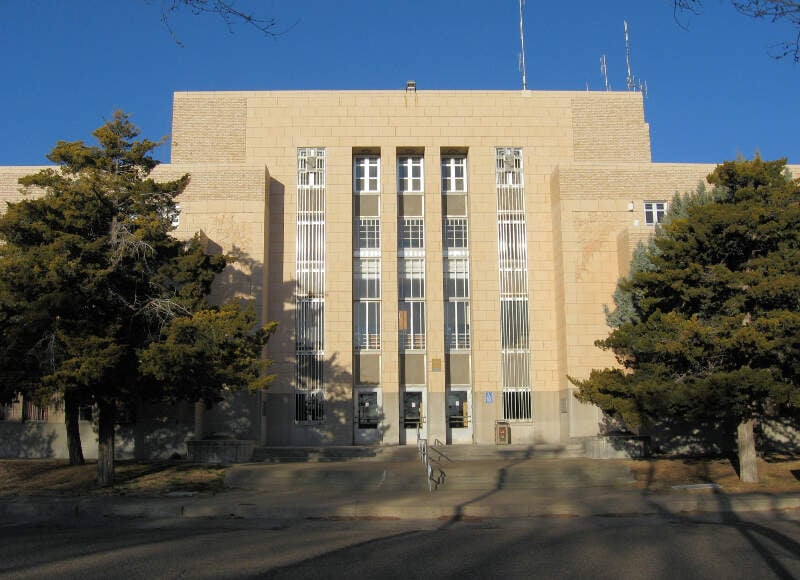
62.3% Hispanic · #9 most Hispanic in New Mexico
Tucumcari is a city in and the county seat of Quay County, New Mexico, United States. The population was 5,363 at the 2010 census. Tucumcari was founded in 1901, two years before Quay County was founded.
Data | Crime | Cost of living | Movers
60.7% Hispanic · #10 most Hispanic in New Mexico
Roswell is a city in New Mexico. It is the county seat of Chaves County in the southeastern quarter of the state of New Mexico, United States. As of the 2010 census it had a population of 48,411, making it the fifth-largest city in New Mexico. It is a center for irrigated farming, dairying, ranching, manufacturing, distribution, and petroleum production. It is also the home of New Mexico Military Institute, founded in 1891. Bitter Lake National Wildlife Refuge is located a few miles northeast of the city on the Pecos River. Bottomless Lakes State Park is located 12 miles east of Roswell on US 380.
Data | Crime | Cost of living | Movers
The receipts
Compare the top ten
Pick a metric. The bars rescale. The red line is New Mexico’s statewide median.
On the map
Where New Mexico’s Hispanic and Latino communities live
Saturday Night Science
Methodology: How We Determined The Cities In New Mexico With The Largest Hispanic Population For 2026
We used Saturday Night Science to compare data on race from the US Census for every city in New Mexico.
New Mexico’s most recently available data comes from the 2020-2024 American Community Survey.
Specifically, we looked at table B03002: Hispanic OR LATINO ORIGIN BY RACE. Here are the category names as defined by the Census:
- Hispanic or Latino
- White alone*
- Black or African American alone*
- American Indian and Alaska Native alone*
- Asian alone*
- Native Hawaiian and Other Pacific Islander alone*
- Some other race alone*
- Two or more races*
Our particular column of interest here was the number of people who identified as Hispanic or Latino.
We limited our analysis to places in New Mexico with a population greater than 5,000 people. That left us with 32 cities.
We then calculated the percentage of Hispanic or Latino residents in each New Mexico city. The percentages ranked from 93.6% to 18.6%.
Finally, we ranked each city based on the percentage of the Hispanic or Latino population, with a higher percentage being more Hispanic or Latino. Sunland Park was the most Hispanic or Latino, while Aztec was the least Hispanic or Latino city.
We updated this article for 2026. This article represents our eleventh time ranking the cities in New Mexico with the largest Hispanic/Latino population.
The full plate
Cities In New Mexico By Hispanic Population
Click any column to sort. Search by city name.
| Rank | City | Population | Hispanic Population | % Hispanic |
|---|---|---|---|---|
| 1 | Sunland Park | 17,463 | 16,341 | 93.6% |
| 2 | Las Vegas | 13,000 | 9,925 | 76.3% |
| 3 | Deming | 15,221 | 10,941 | 71.9% |
| 4 | Lovington | 11,498 | 7,942 | 69.1% |
| 5 | Belen | 7,450 | 5,082 | 68.2% |
| 6 | Bernalillo | 9,086 | 5,998 | 66.0% |
| 7 | Artesia | 12,576 | 8,155 | 64.8% |
| 8 | Hobbs | 40,252 | 25,317 | 62.9% |
| 9 | Tucumcari | 5,160 | 3,214 | 62.3% |
| 10 | Roswell | 47,638 | 28,934 | 60.7% |
| 11 | Grants | 8,951 | 5,429 | 60.7% |
| 12 | Las Cruces | 114,197 | 68,848 | 60.3% |
| 13 | Raton | 6,026 | 3,555 | 59.0% |
| 14 | Los Lunas | 18,618 | 10,930 | 58.7% |
| 15 | Carlsbad | 31,746 | 16,981 | 53.5% |
| 16 | Portales | 11,968 | 5,962 | 49.8% |
| 17 | Santa Fe | 89,019 | 44,098 | 49.5% |
| 18 | Clovis | 37,942 | 18,538 | 48.9% |
| 19 | Silver City | 9,536 | 4,652 | 48.8% |
| 20 | Socorro | 8,481 | 4,079 | 48.1% |
| 21 | Taos | 6,458 | 3,096 | 47.9% |
| 22 | Albuquerque | 562,218 | 268,412 | 47.7% |
| 23 | Los Ranchos de Albuquerque | 5,857 | 2,774 | 47.4% |
| 24 | Rio Rancho | 108,515 | 45,689 | 42.1% |
| 25 | Bloomfield | 7,395 | 2,648 | 35.8% |
| 26 | Truth or Consequences | 6,019 | 2,129 | 35.4% |
| 27 | Alamogordo | 31,307 | 10,139 | 32.4% |
| 28 | Corrales | 8,555 | 2,511 | 29.4% |
| 29 | Ruidoso | 7,699 | 2,248 | 29.2% |
| 30 | Farmington | 46,314 | 11,183 | 24.1% |
| 31 | Gallup | 21,023 | 4,993 | 23.8% |
| 32 | Aztec | 6,150 | 1,146 | 18.6% |
Source: U.S. Census ACS 2020-2024. 32 cities with more than 5,000 residents.
Summary
Summary: Hispanic or Latino Populations Across New Mexico
According to the most recent data, this is an accurate list if you’re looking for a breakdown of Latino populations for each place across New Mexico.
The most Hispanic/Latino cities in New Mexico are Sunland Park, Las Vegas, Deming, Lovington, Belen, Bernalillo, Artesia, Hobbs, Tucumcari, and Roswell.


