

In this article, we will explore some of the most liberal cities in Illinois, where progressive ideas and inclusive attitudes flourish.
If you’re looking to move to Illinois and want to know where the majority of Illinoisans lean left, you’ve come to the right place.
Specifically, we wanted to know which cities have the highest number of liberal voters in the Prairie State.
To do so, we analyzed how the people in each city in Illinois with a population greater than 5,000 voted during the last presidential election. The cities with the highest percentage of voters who voted Democrat were named the most liberal cities in the state.
Not sold on Illinois? Take the two-minute Find Your Place quiz and see which state actually fits you.
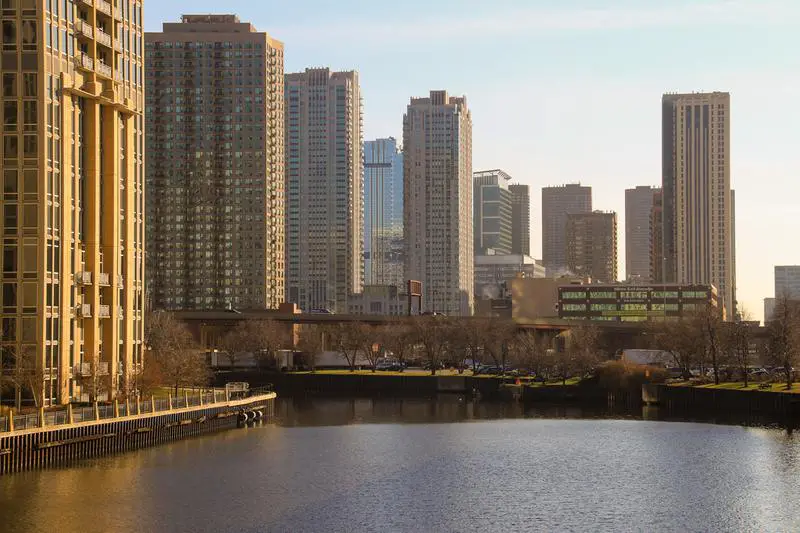
74.3% Democrat vote · #57 most liberal in Illinois
 Located in
DuPage County, Illinois
Located in
DuPage County, Illinois
Chicago or ), officially the City of Chicago, is the third-most populous city in the United States. With over 2.7million residents, it is also the most populous city in both the state of Illinois and the Midwestern United States. It is the county seat of Cook County. The Chicago metropolitan area, often referred to as Chicagoland, has nearly 10million people and is the third-largest in the United States. Chicago has often been called a global architecture capital and is considered one of the most important business centers in the world.
Data | Crime | Cost of living | Movers | Compare
74.3% Democrat vote · #57 most liberal in Illinois
 Located in
Cook County, Illinois
Located in
Cook County, Illinois
Data | Crime | Cost of living | Movers
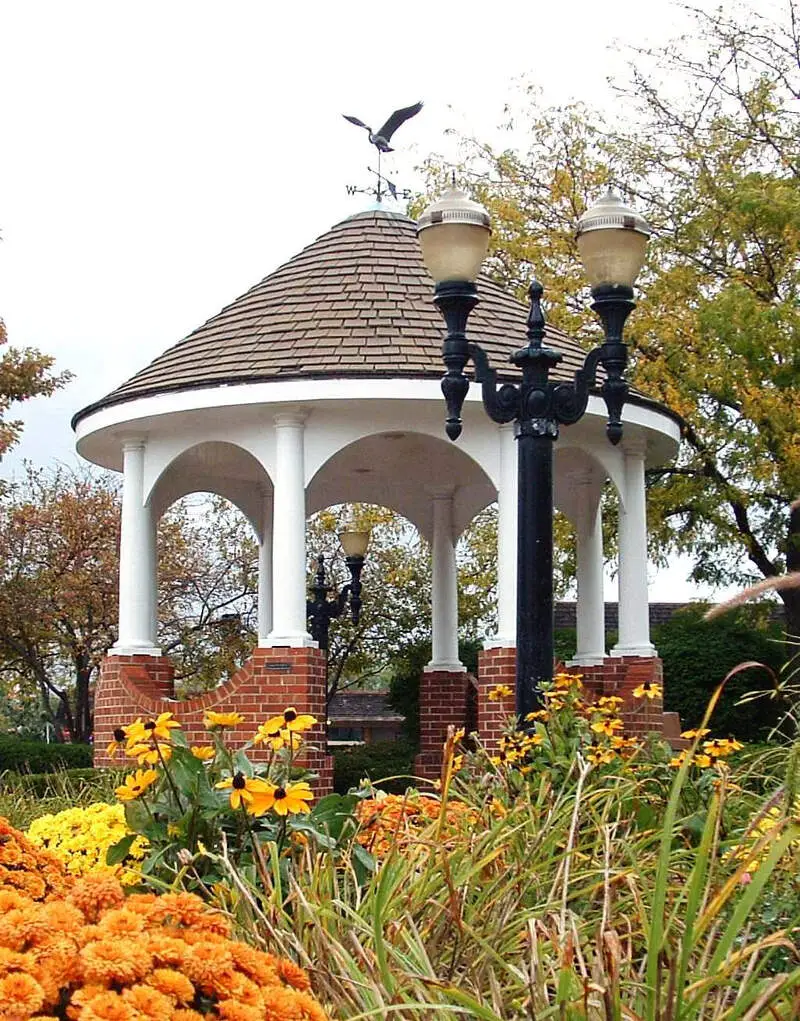
74.3% Democrat vote · #57 most liberal in Illinois
 Located in
Lake County, Illinois
Located in
Lake County, Illinois
Barrington is an affluent suburban village in Cook County and Lake County, Illinois, United States. The population was 10,327 at the 2010 census. Located approximately 32 miles northwest of Chicago, the area features wetlands, forest preserves, parks, and horse trails in a country-suburban setting.
Data | Crime | Cost of living | Movers
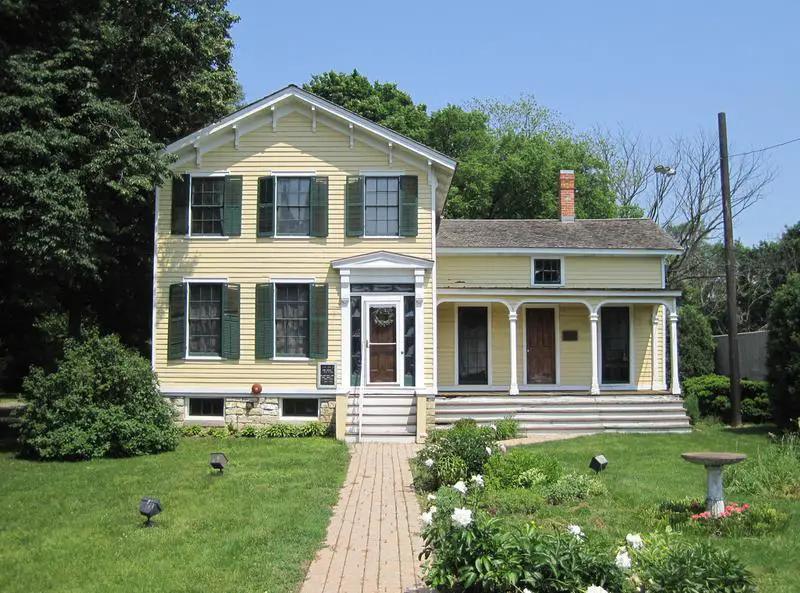
74.3% Democrat vote · #57 most liberal in Illinois
 Located in
DuPage County, Illinois
Located in
DuPage County, Illinois
Burr Ridge is a suburb of Chicago, in Cook and DuPage counties, Illinois, United States. The village is listed among the top wealthiest towns in Illinois and is locally known for its large beautiful residences. The population was 10,559 at the 2010 census.
Data | Crime | Cost of living | Movers
74.3% Democrat vote · #57 most liberal in Illinois
 Located in
Cook County, Illinois
Located in
Cook County, Illinois
Markham is a suburban city in Cook County, Illinois, United States. The population was 12,508 at the 2010 census.
Data | Crime | Cost of living | Movers
74.3% Democrat vote · #57 most liberal in Illinois
 Located in
Cook County, Illinois
Located in
Cook County, Illinois
Data | Crime | Cost of living | Movers
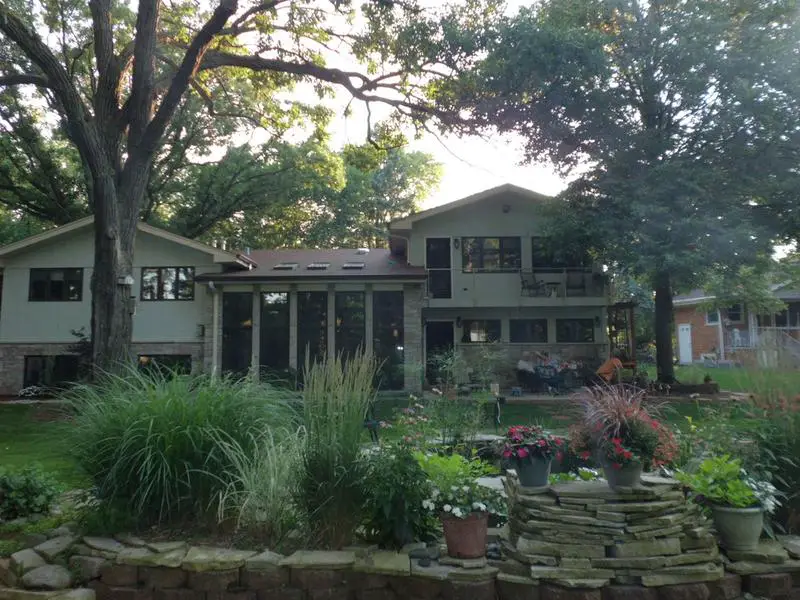
74.3% Democrat vote · #57 most liberal in Illinois
 Located in
Cook County, Illinois
Located in
Cook County, Illinois
Palos Heights is a city in Cook County, Illinois, United States. Palos Heights students can readily commute to Moraine Valley Community College in nearby Palos Hills. Moraine Valley serves the local residents through classes, seminars, lectures, concerts, plays, and other activities. Trinity Christian College is also located in Palos Heights.
Data | Crime | Cost of living | Movers
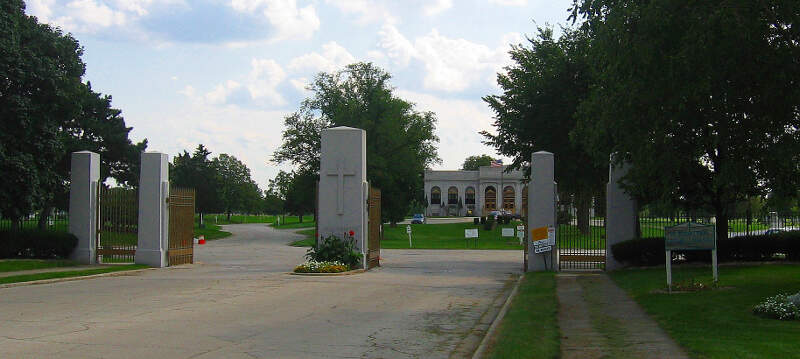
74.3% Democrat vote · #57 most liberal in Illinois
 Located in
Cook County, Illinois
Located in
Cook County, Illinois
Data | Crime | Cost of living | Movers
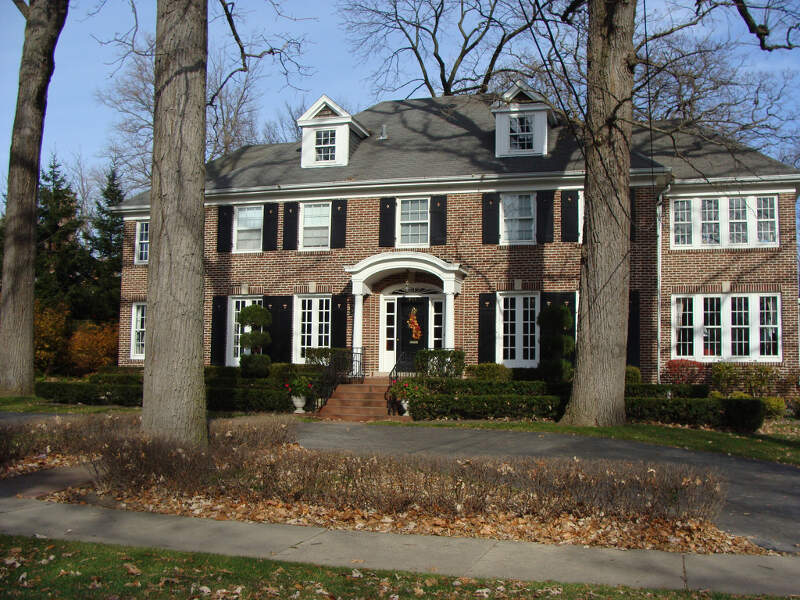
74.3% Democrat vote · #57 most liberal in Illinois
 Located in
Cook County, Illinois
Located in
Cook County, Illinois
Winnetka is a village in Cook County, Illinois, United States, located 16 miles north of downtown Chicago. The population was 12,187 at the 2010 census. The village is one of the wealthiest places in the nation in terms of household income, and the richest in Illinois.
Data | Crime | Cost of living | Movers
74.3% Democrat vote · #57 most liberal in Illinois
 Located in
Cook County, Illinois
Located in
Cook County, Illinois
Data | Crime | Cost of living | Movers
The receipts
Compare the top ten
Pick a metric. The bars rescale. The red line is Illinois’s statewide median.
On the map
Mapping the liberal strongholds in Illinois
Saturday Night Science
How we determined the most liberal cities in Illinois for 2026
To find the most liberal places in Illinois, we used Saturday Night Science – the argument you’d make at a bar – to find the cities with the most liberals.
We started by making a list of every city in Illinois over 5,000 people based on the 2020-2024 American Community Survey. That left us with 330 cities and towns.
We then measured the voting record and MIT election data to determine which places lean the most leftward in their allegiances by:
- Percentage Of Votes For Democratic President In 2020
Because no voting data exists at the city level, we used county-level election results from the 2020 election. We assigned every city in a county the percentage of votes that went to the Democrats, effectively extending the county’s results to the city level. In cases where larger cities encompassed an entire county, the election outcomes accurately reflected the city’s political landscape.
The winner, Chicago, is “The Most liberal City in Illinois For 2026”. The most conservative place in Illinois was Vandalia.
We updated this article for 2026. This report is our eleventh time ranking the most liberal places to live in Illinois.
The full plate
Most Liberal Places In Illinois
Click any column to sort. Search by city name.
| Rank | City | Population | % Liberal |
|---|---|---|---|
| 57 | Chicago | 2,711,226 | 74.3% |
| 57 | Summit | 10,846 | 74.3% |
| 57 | Barrington | 11,077 | 74.3% |
| 57 | Burr Ridge | 11,141 | 74.3% |
| 57 | Markham | 11,355 | 74.3% |
| 57 | River Forest | 11,992 | 74.3% |
| 57 | Palos Heights | 12,152 | 74.3% |
| 57 | Justice | 12,324 | 74.3% |
| 57 | Winnetka | 12,484 | 74.3% |
| 57 | Northlake | 12,513 | 74.3% |
| 57 | Richton Park | 12,521 | 74.3% |
| 57 | Lincolnwood | 13,112 | 74.3% |
| 57 | Worth | 10,700 | 74.3% |
| 57 | Western Springs | 13,446 | 74.3% |
| 57 | Hazel Crest | 13,792 | 74.3% |
| 57 | Forest Park | 13,943 | 74.3% |
| 57 | Midlothian | 13,948 | 74.3% |
| 57 | Chicago Ridge | 14,099 | 74.3% |
| 57 | Hickory Hills | 14,526 | 74.3% |
| 57 | Norridge | 15,439 | 74.3% |
| 57 | Prospect Heights | 15,618 | 74.3% |
| 57 | La Grange | 15,998 | 74.3% |
| 57 | Country Club Hills | 16,324 | 74.3% |
| 57 | Westchester | 16,436 | 74.3% |
| 57 | Bridgeview | 16,849 | 74.3% |
| 57 | La Grange Park | 13,447 | 74.3% |
| 57 | Crestwood | 10,579 | 74.3% |
| 57 | River Grove | 10,451 | 74.3% |
| 57 | Riverdale | 10,340 | 74.3% |
| 57 | South Barrington | 5,021 | 74.3% |
| 57 | Berkeley | 5,199 | 74.3% |
| 57 | Posen | 5,292 | 74.3% |
| 57 | Northfield | 5,487 | 74.3% |
| 57 | Willow Springs | 5,868 | 74.3% |
| 57 | Countryside | 6,267 | 74.3% |
| 57 | Orland Hills | 6,719 | 74.3% |
| 57 | Calumet Park | 6,855 | 74.3% |
| 57 | Stickney | 6,952 | 74.3% |
| 57 | North Riverside | 7,249 | 74.3% |
| 57 | Inverness | 7,275 | 74.3% |
| 57 | University Park | 7,306 | 74.3% |
| 57 | Broadview | 7,896 | 74.3% |
| 57 | Oak Brook | 8,056 | 74.3% |
| 57 | Hillside | 8,084 | 74.3% |
| 57 | Crete | 8,386 | 74.3% |
| 57 | Glenwood | 8,603 | 74.3% |
| 57 | Glencoe | 8,701 | 74.3% |
| 57 | Harwood Heights | 8,821 | 74.3% |
| 57 | Riverside | 9,039 | 74.3% |
| 57 | Lynwood | 9,083 | 74.3% |
| 57 | Flossmoor | 9,391 | 74.3% |
| 57 | Steger | 9,418 | 74.3% |
| 57 | Sauk Village | 9,678 | 74.3% |
| 57 | Lyons | 10,339 | 74.3% |
| 57 | Hinsdale | 17,175 | 74.3% |
| 57 | Lemont | 17,820 | 74.3% |
| 57 | Schiller Park | 11,393 | 74.3% |
| 57 | Franklin Park | 18,197 | 74.3% |
| 57 | Northbrook | 34,585 | 74.3% |
| 57 | Calumet City | 35,100 | 74.3% |
| 57 | Hanover Park | 36,732 | 74.3% |
| 57 | Wheeling | 38,433 | 74.3% |
| 57 | Park Ridge | 38,667 | 74.3% |
| 57 | Streamwood | 39,001 | 74.3% |
| 57 | Bartlett | 40,501 | 74.3% |
| 57 | Buffalo Grove | 42,891 | 74.3% |
| 57 | Elmhurst | 45,671 | 74.3% |
| 57 | Glenview | 47,752 | 74.3% |
| 57 | Hoffman Estates | 51,175 | 74.3% |
| 57 | Oak Park | 53,292 | 74.3% |
| 57 | Tinley Park | 54,842 | 74.3% |
| 57 | Mount Prospect | 55,472 | 74.3% |
| 57 | Berwyn | 55,595 | 74.3% |
| 57 | Oak Lawn | 56,861 | 74.3% |
| 57 | Orland Park | 57,916 | 74.3% |
| 57 | Des Plaines | 59,156 | 74.3% |
| 57 | Skokie | 66,219 | 74.3% |
| 57 | Palatine | 66,293 | 74.3% |
| 57 | Palos Hills | 18,081 | 74.3% |
| 57 | Evanston | 76,340 | 74.3% |
| 57 | Schaumburg | 76,868 | 74.3% |
| 57 | Cicero | 82,797 | 74.3% |
| 57 | Elgin | 114,934 | 74.3% |
| 57 | Woodridge | 33,941 | 74.3% |
| 57 | Elk Grove Village | 31,987 | 74.3% |
| 57 | Arlington Heights | 76,005 | 74.3% |
| 57 | Burbank | 28,739 | 74.3% |
| 57 | Niles | 30,064 | 74.3% |
| 57 | Bellwood | 18,256 | 74.3% |
| 57 | Alsip | 18,583 | 74.3% |
| 57 | Bensenville | 18,603 | 74.3% |
| 57 | Matteson | 18,645 | 74.3% |
| 57 | Homewood | 19,294 | 74.3% |
| 57 | Brookfield | 19,331 | 74.3% |
| 57 | Deerfield | 19,518 | 74.3% |
| 57 | Harvey | 20,230 | 74.3% |
| 57 | Frankfort | 20,651 | 74.3% |
| 57 | Dolton | 20,825 | 74.3% |
| 57 | South Holland | 20,911 | 74.3% |
| 57 | Park Forest | 21,156 | 74.3% |
Source: county-level 2020 election results, U.S. Census ACS 2020-2024. 330 cities with more than 5,000 residents.
Summary
Summing Up The Liberal Snowflakes in Illinois
Well, there you have it, the places in Illinois that have the highest number of liberals per capita, with Chicago ranking as the least conservative in the entire state.
The most liberal cities in Illinois are Chicago, Summit, Barrington, Burr Ridge, Markham, River Forest, Palos Heights, Justice, Winnetka, and Northlake.
If you’re curious, here are the least liberal cities in Illinois. Wondering how Chicago stacks up against a bigger name? See Chicago, IL vs. Atlanta, GA side by side.
Questions and answers
Most Liberal Places In Illinois FAQs
What is the most liberal city in Illinois?
Chicago is the most liberal place in Illinois for 2026, by Democrat share of the 2020 presidential vote. Summit and Barrington are next.
What are the most liberal places in Illinois?
The most liberal places in Illinois are Chicago, Summit, Barrington, Burr Ridge, Markham, River Forest, Palos Heights, Justice, Winnetka, and Northlake. We ranked all 330 cities with more than 5,000 residents.
How do you measure how liberal a city is?
Cities are ranked on the county-level Democrat vote share from the 2020 presidential election. One number, straight from certified election results.
What is the most conservative place in Illinois?
Vandalia posts the lowest Democrat vote share of the 330 Illinois cities we ranked, making it the most conservative place on this list. Our separate most conservative places in Illinois ranking runs the same math from the other direction.
Does city size matter in this ranking?
Only places with more than 5,000 residents qualify — 330 Illinois cities this year. Beyond that cutoff, a small town and a big city count the same.


