
There’s liberal media, Liberty Island, Liberty Bell, and liberal cities.
But where are the most liberal cities in the United States?
Most lists use vibes to guess which city seems more liberal, but we have Saturday Night Science to back us up.
Specifically, we wanted to know the cities in America that have the highest number of liberal voters.
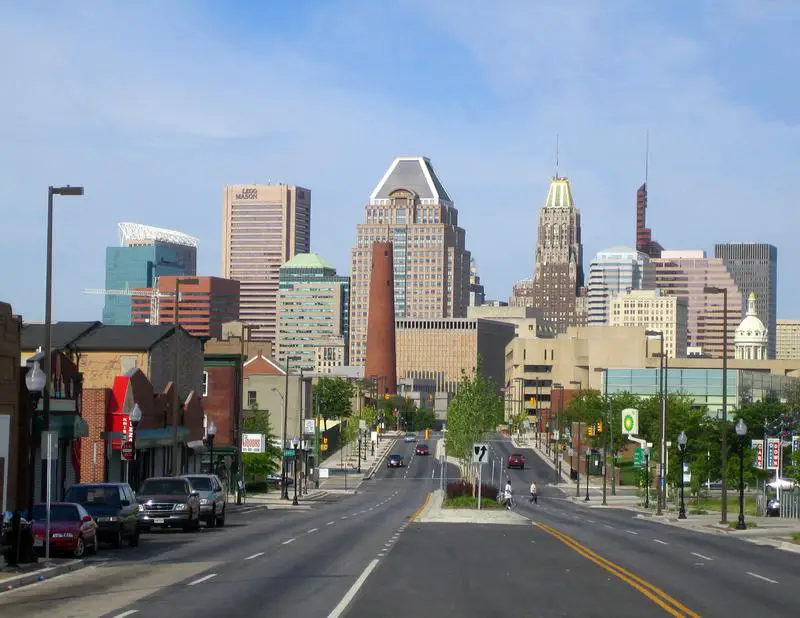
After analyzing the 100 biggest cities in America, it turns out Baltimore, MD is the most liberal city in America — not a huge surprise.
Table Of Contents: Top Ten | Methodology | Summary | Table
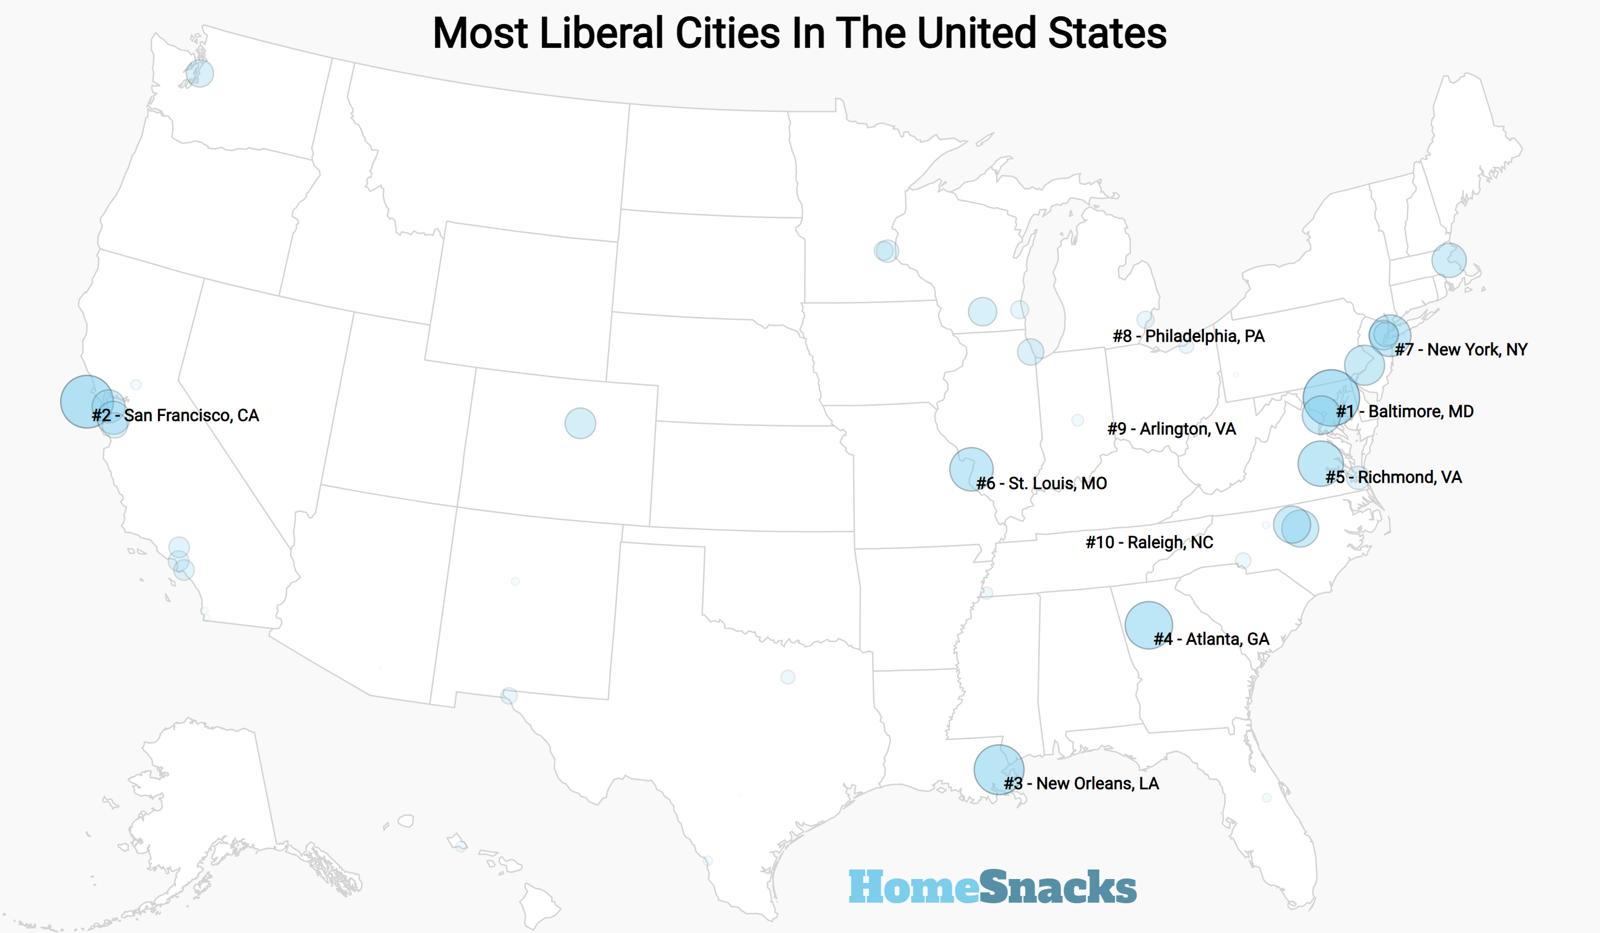
The 10 Most Liberal Cities In The United States For 2026
If you’re wondering, Corpus Christi, TX is the most conservative city in America.
And to be clear, we didn’t form this list based on our own biases — we relied on the cold hard data.
The 10 Most Liberal Cities In The US For 2026

/10
Population: 573,243
Percent Democrat: 87.3%
More on Baltimore: Data | Crime | Cost Of Living | Real Estate

The crime is very bad in this city. I love the culture and my neighbors but the extremely high crime rate is making me seriously consider on moving out.
The violence and the robbery. The restaurants in the city are amazing though.


/10
Population: 830,235
Percent Democrat: 85.3%
More on San Francisco: Data | Crime | Cost Of Living | Real Estate
I live here now and I like that it has what I call “flavor”. I grew up in a small suburban very safe small town. It was ranked “Best small town to raise a family in CA” once in some random magazine. I like that San Francisco has character, lots of activities to do, and it is a beautiful city just to live in. I also live in the Inner Sunset neighborhood near the golden gate park and do not experience seeing lots of homeless people around me so thats probably why I feel favorably about how SF feels.
One of my favorite places is Lands end and golden gate park. There are always activities going on in the park and it is just really nice to be able to access such a beautiful place easily by bike. I like that there are large concerts in golden gate park, night life experiences at the museums in the park, and large open spaces for family gatherings.

/10
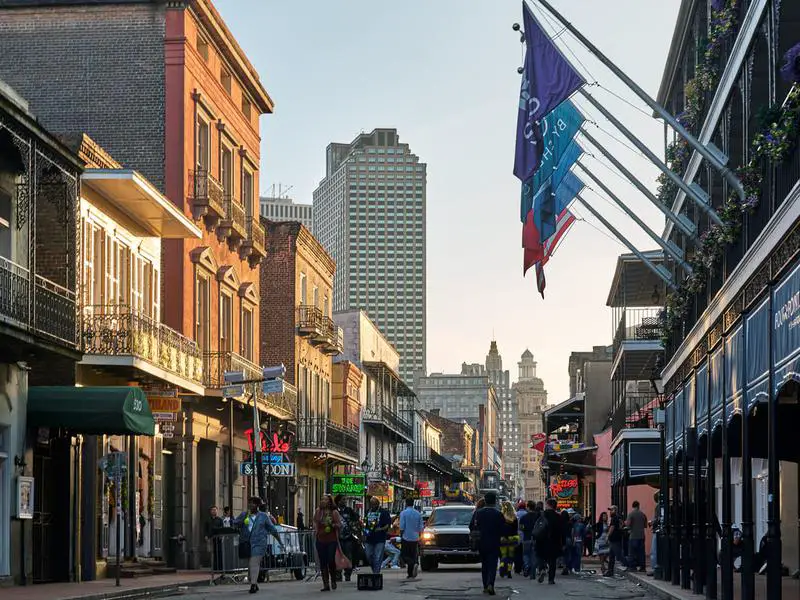
Population: 371,853
Percent Democrat: 83.1%
More on New Orleans: Data | Crime | Cost Of Living | Real Estate
New Orleans is divine for art, music, food, history, architecture and more.
Avoid the tourist areas and you’ll be just fine.

/10
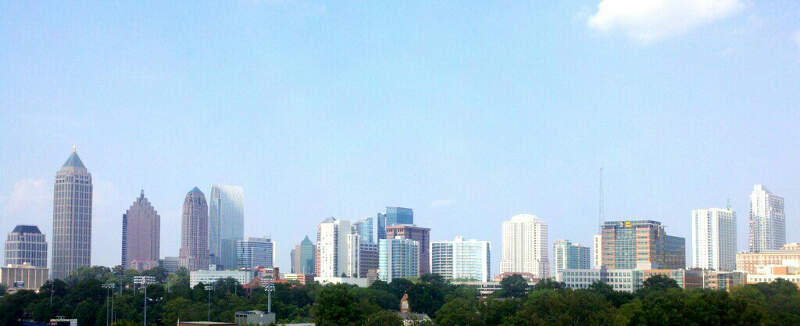
Population: 505,268
Percent Democrat: 83.1%
More on Atlanta: Data | Crime | Cost Of Living | Real Estate
I like how big Atlanta Georgia is and how lively and nice this place is.
I like the roads and how busy and nice this place is.


/10
Population: 229,359
Percent Democrat: 82.9%
More on Richmond: Data | Crime | Cost Of Living | Real Estate
Currently, the crime rate is fairly low. I think the schools are great. I love the river and parks in the area. There are also a lot of food options in the city! I can eat in a new restaurant every day of the week and not duplicate any for about 6 months. With that being said, I still have two favorites that I go to at least once a week.
I highly recommend a sandwich called the cheese colombo at Coppola’s in Carytown. It’s an adult grilled cheese with pepper, onion, and artichoke. Three kinds of cheese are fried directly on the griddle so they get melty and gooey in the middle, but really crispy and almost burnt on the outside. That helps the bun not get too soggy when the marinated veggies are added. It’s perfection.

/10
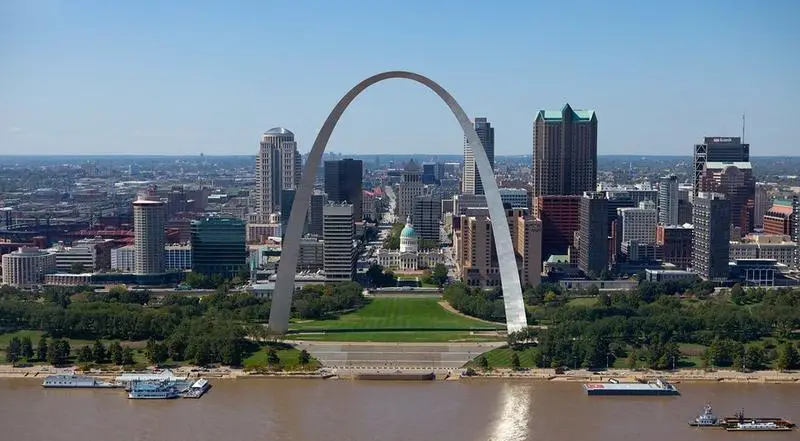
Population: 288,512
Percent Democrat: 82.2%
More on St. Louis: Data | Crime | Cost Of Living | Real Estate
Being in a new place is so different,everything is different but the people are great. I got tot meet some really good people along the way.
Of course the Arch stands out more than anything else in St. Louis. There is no bad side to it at all


/10
Population: 8,483,844
Percent Democrat: 82.2%
More on New York: Data | Crime | Cost Of Living | Real Estate
There is a ton to do in New York City. There are so many tourist attractions. There is Central Park and Rockafeller center. There is broadway.
Broadway is nice to see shows. New York City is super crowded.

/10
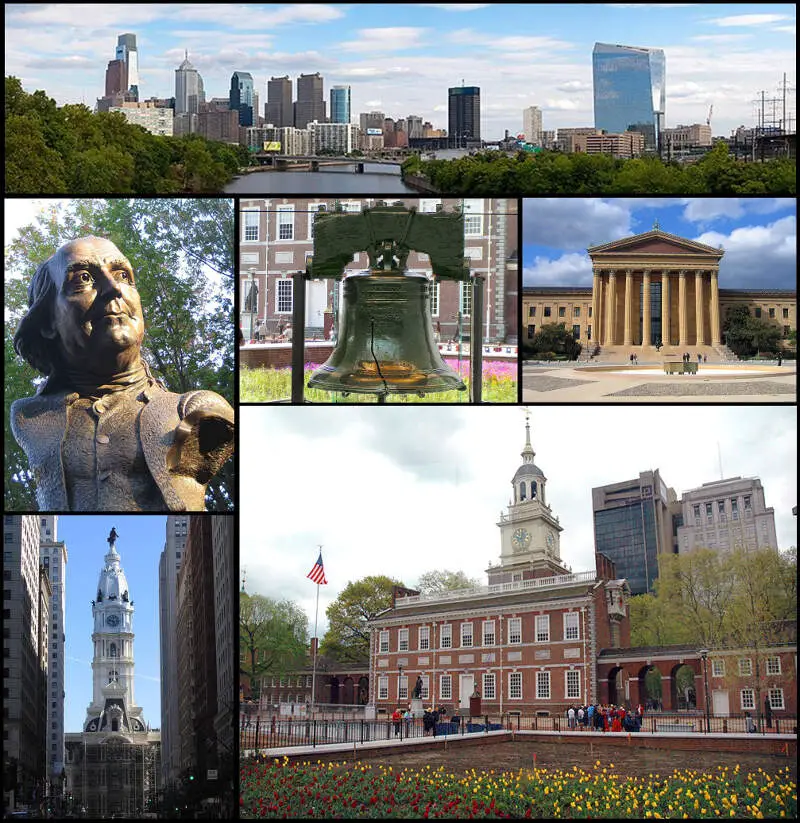
Population: 1,579,706
Percent Democrat: 81.4%
More on Philadelphia: Data | Cost Of Living | Real Estate
Philadelphia is very beautiful with historic features. the crime in philadelphia has went down 60% which is way better than last year. the living in philadelphia is awesome, the houses in certain neighborhoods are beautiful especially in center city philadelphia. the best place to go in philadelphia is pennslanding. Pennslanding has big ships and also there is entertainment on most of them. center city philadelphia is a great place to go as well, there is a lot of night life, clubs, lounges, bars, and restaurants with delicious food.
Center city philadelphia stood out the most because there is a lot of things to do there, like partying.


/10
Population: 236,254
Percent Democrat: 80.6%
More on Arlington: Data | Cost Of Living | Real Estate

/10
Population: 481,031
Percent Democrat: 80.4%
More on Raleigh: Data | Crime | Cost Of Living | Real Estate
How we determined the most liberal cities in America for 2026
Using Saturday Night Science, we created a list of the 100 biggest cities in America based on the 2020-2024 American Community Survey.
We then measured the voting record and MIT election data to determine which places lean the most leftward in their allegiances. We looked at:
- Percentage Of Votes For Democratic President In 2020
Because no centralized database contains voting data at the city level, we used county-level election results from the 2020 election. We assigned every city in a county the percentage of votes that went to the Democrats, effectively extending the county’s results to the city level. In cases where larger cities encompassed an entire county, the election outcomes accurately reflected the city’s political landscape.
For the majority of the cities on this list, that was the case.
Next, we ranked each city from 1 to 100 for each criterion, where number one was the most liberal.
The winner, Baltimore, MD, is “The Most Liberal City in America For 2026”.
We updated this article for 2026. This report is our eleventh time ranking the most liberal cities in America.
Summing Up All The Liberal Snowflake Cities In The US
Well, there you have it, the big cities in America that have the highest number of liberals per capita, with Baltimore, MD ranking as the least conservative in the entire country.
The most liberal cities in the United States are Baltimore, MD, San Francisco, CA, New Orleans, LA, Atlanta, GA, Richmond, VA, St. Louis, MO, New York, NY, Philadelphia, PA, Arlington, VA, and Raleigh, NC.
If you’re curious, here are some of the most conservative cities in America:
- Corpus Christi
- Oklahoma City
- Tulsa
For more reading, check out:
Most Liberal Cities In The United States For 2026
| Rank | City | Population | % Liberal |
|---|---|---|---|
| 1 | Baltimore, MD | 573,243 | 87.3% |
| 2 | San Francisco, CA | 830,235 | 85.3% |
| 3 | New Orleans, LA | 371,853 | 83.1% |
| 4 | Atlanta, GA | 505,268 | 83.1% |
| 5 | Richmond, VA | 229,359 | 82.9% |
| 6 | St. Louis, MO | 288,512 | 82.2% |
| 7 | New York, NY | 8,483,844 | 82.2% |
| 8 | Philadelphia, PA | 1,579,706 | 81.4% |
| 9 | Arlington, VA | 236,254 | 80.6% |
| 10 | Raleigh, NC | 481,031 | 80.4% |
| 11 | Durham, NC | 291,467 | 80.4% |
| 12 | Boston, MA | 666,442 | 80.2% |
| 13 | Oakland, CA | 439,418 | 80.2% |
| 14 | Fremont, CA | 228,295 | 80.2% |
| 15 | Denver, CO | 718,877 | 79.6% |
| 16 | Newark, NJ | 310,178 | 77.3% |
| 17 | Madison, WI | 278,001 | 75.5% |
| 18 | Seattle, WA | 754,195 | 75.0% |
| 19 | Chicago, IL | 2,711,226 | 74.3% |
| 20 | San Jose, CA | 990,138 | 72.6% |
| 21 | Jersey City, NJ | 294,078 | 72.6% |
| 22 | Norfolk, VA | 233,596 | 71.6% |
| 23 | St. Paul, MN | 307,284 | 71.5% |
| 24 | Los Angeles, CA | 3,857,263 | 71.0% |
| 25 | Long Beach, CA | 455,548 | 71.0% |
| 26 | Santa Clarita, CA | 230,221 | 71.0% |
| 27 | Minneapolis, MN | 427,246 | 70.5% |
| 28 | Milwaukee, WI | 566,973 | 69.1% |
| 29 | Detroit, MI | 638,530 | 68.4% |
| 30 | El Paso, TX | 680,130 | 66.8% |
| 31 | Charlotte, NC | 903,844 | 66.7% |
| 32 | Cleveland, OH | 366,097 | 66.5% |
| 33 | Irving, TX | 256,492 | 65.1% |
| 34 | Alexander , TN | 690,130 | 64.5% |
| 35 | Memphis, TN | 618,980 | 64.4% |
| 36 | Indianapolis, IN | 885,860 | 63.6% |
| 37 | Urban Honolulu, HI | 345,482 | 62.5% |
| 38 | Sacramento, CA | 528,706 | 61.4% |
| 39 | Laredo, TX | 257,619 | 61.1% |
| 40 | Orlando, FL | 319,758 | 61.0% |
| 41 | Albuquerque, NM | 562,218 | 61.0% |
| 42 | Greensboro, NC | 301,198 | 60.8% |
| 43 | San Diego, CA | 1,389,526 | 60.2% |
| 44 | Chula Vista, CA | 276,375 | 60.2% |
| 45 | Pittsburgh, PA | 304,759 | 59.6% |
| 46 | Lexington-Fayette Urban County, KY | 323,725 | 59.3% |
| 47 | Louisville/jefferson County Metro Government (Balance), KY | 631,818 | 59.1% |
| 48 | Tucson, AZ | 547,073 | 58.6% |
| 49 | San Antonio, TX | 1,479,835 | 58.2% |
| 50 | Toledo, OH | 267,463 | 57.5% |
| 51 | Cincinnati, OH | 311,224 | 57.1% |
| 52 | Aurora, CO | 394,432 | 56.7% |
| 53 | Winston-Salem, NC | 252,037 | 56.2% |
| 54 | Buffalo, NY | 276,854 | 56.0% |
| 55 | Stockton, CA | 322,326 | 55.9% |
| 56 | Houston, TX | 2,328,253 | 54.7% |
| 57 | Omaha, NE | 488,837 | 54.7% |
| 58 | Austin, TX | 979,539 | 54.4% |
| 59 | Portland, OR | 641,165 | 54.0% |
| 60 | Las Vegas, NV | 660,400 | 53.7% |
| 61 | Henderson, NV | 332,141 | 53.7% |
| 62 | North Las Vegas, NV | 278,595 | 53.7% |
| 63 | Enterprise, NV | 240,464 | 53.7% |
| 64 | Anaheim, CA | 344,521 | 53.5% |
| 65 | Santa Ana, CA | 312,534 | 53.5% |
| 66 | Irvine, CA | 311,690 | 53.5% |
| 67 | Miami, FL | 459,745 | 53.4% |
| 68 | Riverside, CA | 319,069 | 53.0% |
| 69 | Fresno, CA | 545,970 | 52.9% |
| 70 | Tampa, FL | 401,618 | 52.9% |
| 71 | Lincoln, NE | 294,856 | 52.7% |
| 72 | Chesapeake, VA | 252,583 | 52.2% |
| 73 | Virginia Beach, VA | 456,349 | 51.6% |
| 74 | Jacksonville, FL | 977,670 | 51.2% |
| 75 | Reno, NV | 273,212 | 50.8% |
| 76 | Phoenix, AZ | 1,642,323 | 50.3% |
| 77 | Mesa, AZ | 511,764 | 50.3% |
| 78 | Gilbert, AZ | 280,262 | 50.3% |
| 79 | Chandler, AZ | 280,136 | 50.3% |
| 80 | Glendale, AZ | 252,833 | 50.3% |
| 81 | Scottsdale, AZ | 243,821 | 50.3% |
| 82 | St. Petersburg, FL | 262,732 | 49.6% |
| 83 | Arlington, TX | 397,742 | 49.3% |
| 84 | Port St. Lucie, FL | 232,491 | 48.9% |
| 85 | Dallas, TX | 1,307,930 | 47.0% |
| 86 | Plano, TX | 290,594 | 47.0% |
| 87 | Garland, TX | 246,844 | 47.0% |
| 88 | Boise City, ID | 237,242 | 46.5% |
| 89 | Spokane, WA | 230,293 | 46.0% |
| 90 | Columbus, OH | 914,802 | 45.8% |
| 91 | Fort Worth, TX | 963,194 | 45.1% |
| 92 | Bakersfield, CA | 411,986 | 43.7% |
| 93 | Fort Wayne, IN | 268,589 | 43.3% |
| 94 | Wichita, KS | 397,945 | 42.9% |
| 95 | Colorado Springs, CO | 487,887 | 42.7% |
| 96 | Kansas City, MO | 510,612 | 33.2% |
| 97 | Lubbock, TX | 264,814 | 33.1% |
| 98 | Tulsa, OK | 413,794 | 29.2% |
| 99 | Oklahoma City, OK | 697,125 | 27.0% |
| 100 | Corpus Christi, TX | 317,419 | 23.7% |
Liberal Places By State
Most Liberal Cities In Alabama
Most Liberal Cities In Arkansas
Most Liberal Cities In Arizona
Most Liberal Cities In California
Most Liberal Cities In Colorado
Most Liberal Cities In Connecticut
Most Liberal Cities In Delaware
Most Liberal Cities In Florida
Most Liberal Cities In Georgia
Most Liberal Cities In Illinois
Most Liberal Cities In Louisiana
Most Liberal Cities In Massachusetts
Most Liberal Cities In Maryland
Most Liberal Cities In Michigan
Most Liberal Cities In Minnesota
Most Liberal Cities In Missouri
Most Liberal Cities In Mississippi
Most Liberal Cities In Montana
Most Liberal Cities In North Carolina
Most Liberal Cities In North Dakota
Most Liberal Cities In Nebraska
Most Liberal Cities In New Hampshire
Most Liberal Cities In New Jersey
Most Liberal Cities In Oklahoma
Most Liberal Cities In Pennsylvania
Most Liberal Cities In Rhode Island
Most Liberal Cities In South Carolina
Most Liberal Cities In South Dakota
Most Liberal Cities In Tennessee
Most Liberal Cities In Virginia
Most Liberal Cities In Vermont
Most Liberal Cities In Washington
Most Liberal Cities In Wisconsin