Most Native American places in New Jersey research summary. We used Saturday Night Science to research the New Jersey cities with the highest percentage of Native American residents for 2026. The data comes from the American Community Survey 2020-2024 vintage, which breaks down race by origin.
The city with the highest percentage of Native Americans is Ringwood. 0.70% of people in Ringwood are Native Americans.
The city with the lowest percentage of Native Americans is Woodland Park. 0.00% of people in Woodland Park are Native American.
The city with the most Native Americans is Jersey City. 599 people in Jersey City are Native American.
The city with the fewest Native Americans is Woodland Park. 0 people in Woodland Park are Native American.
The United States has 1,698,432 Native Americans and is 0.51% Native American.
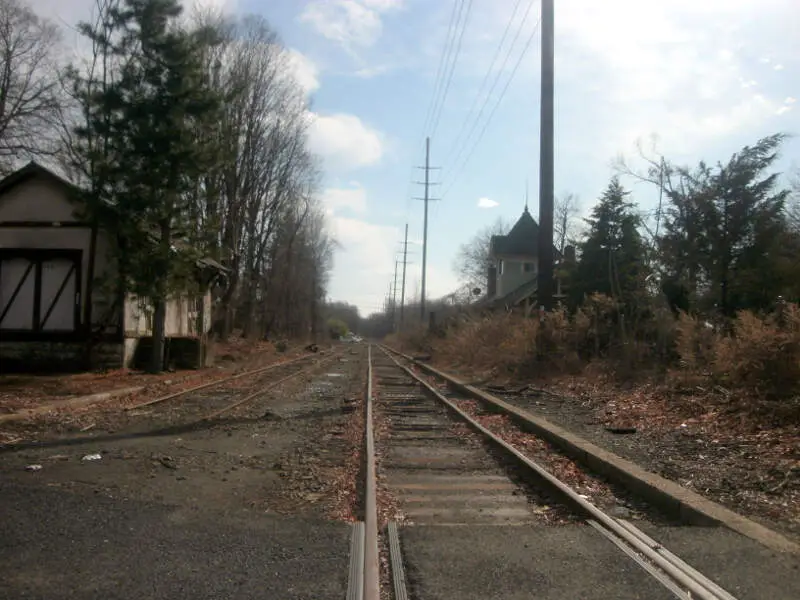
Which city in New Jersey had the largest Native American population? The place with the largest Native American population in New Jersey for 2026 is Ringwood. 0.70% of Ringwood identify as Native American.
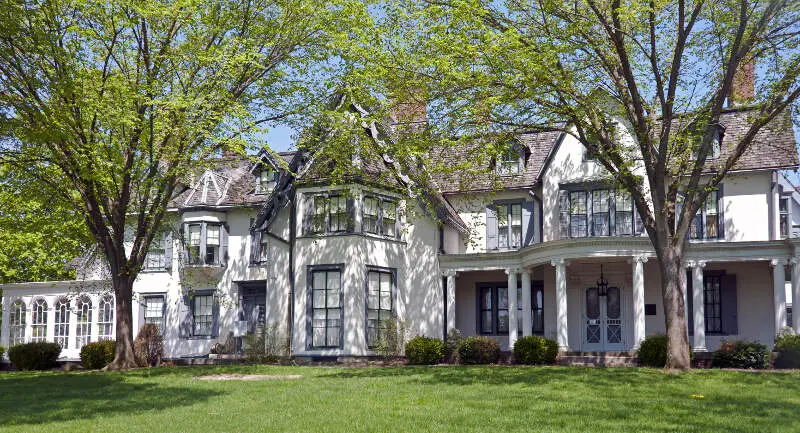
0.7% Native American · 82 Native American residents
Ringwood is a borough in Passaic County, New Jersey, United States. As of the 2010 United States Census, the borough’s population was 12,228, reflecting a decrease of 168 from the 12,396 counted in the 2000 Census, which had in turn declined by 227 from the 12,623 counted in the 1990 Census.
Data | Crime | Cost of living | Movers
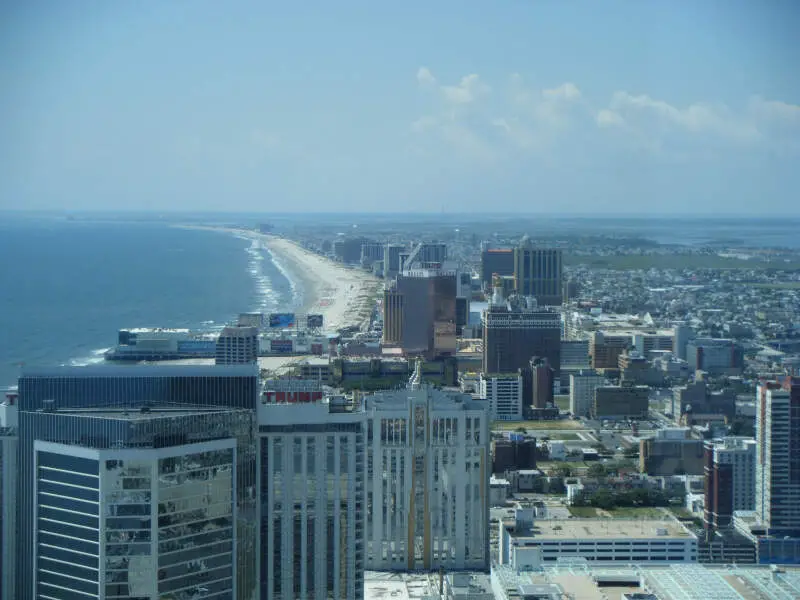
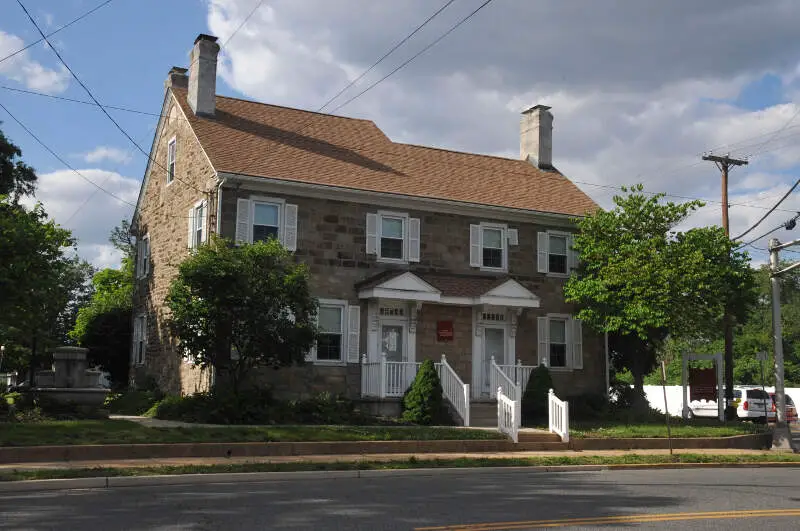
0.6% Native American · 245 Native American residents
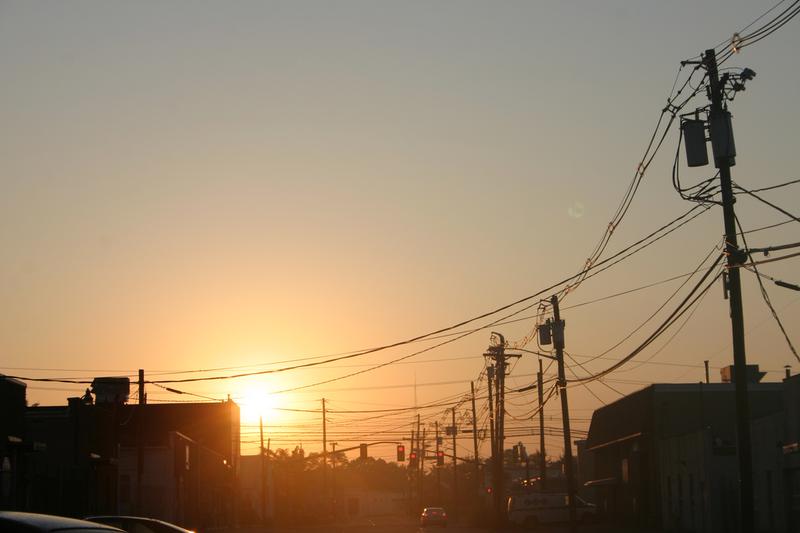
Atlantic City is a resort city in Atlantic County, New Jersey, United States, known for its casinos, boardwalks, and beaches. In 2010, it had a population of 39,558. The city was incorporated on May 1, 1854, from portions of Egg Harbor Township and Galloway Township. It borders Absecon, Brigantine, Pleasantville, Ventnor City, West Atlantic City, and the Atlantic Ocean.
Data | Crime | Cost of living | Movers
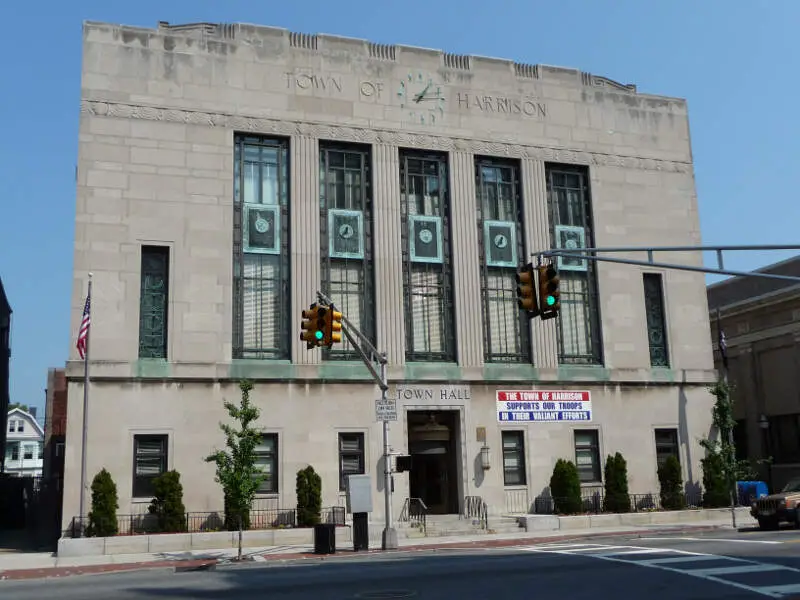
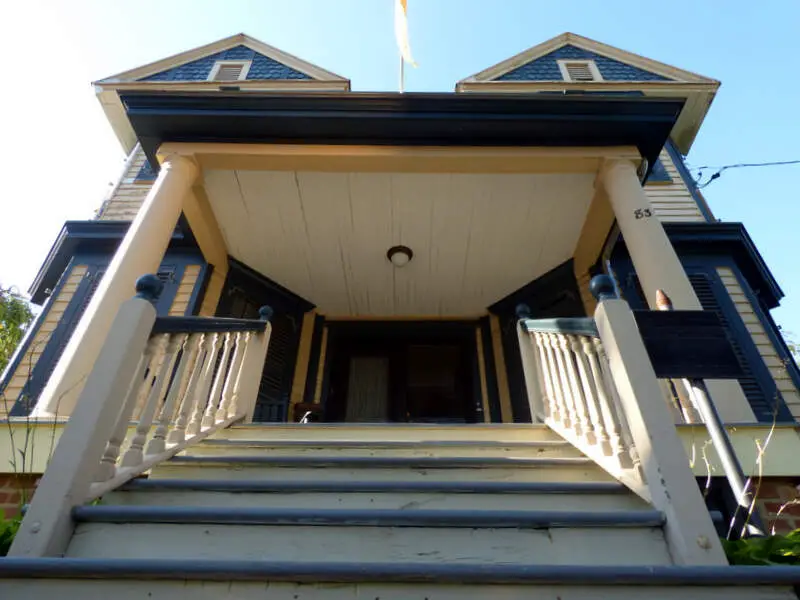
0.6% Native American · 125 Native American residents
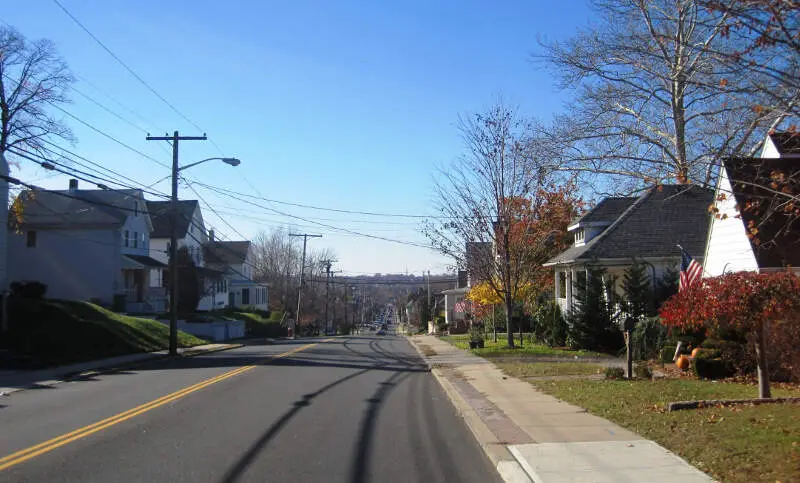
Harrison is a town in Hudson County, New Jersey, United States. It is a suburb of the nearby city of Newark, New Jersey.
Data | Crime | Cost of living | Movers
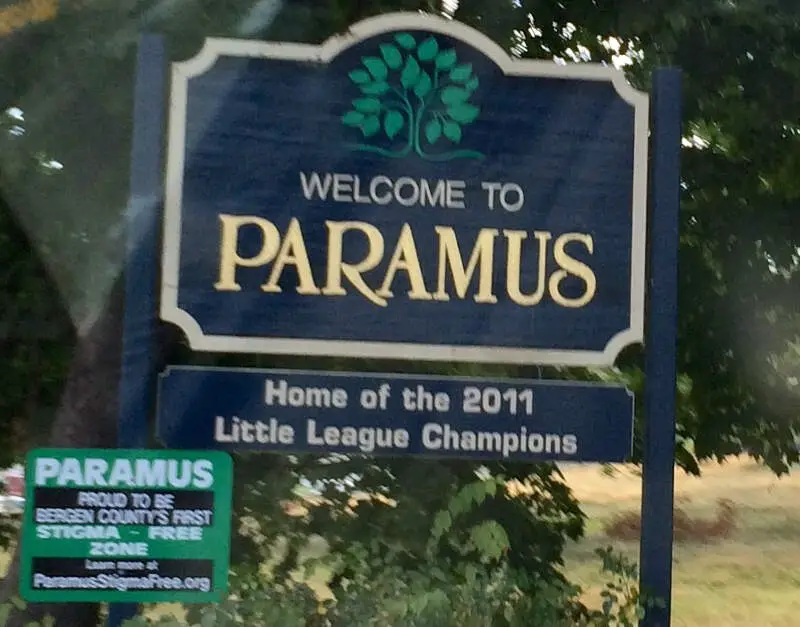
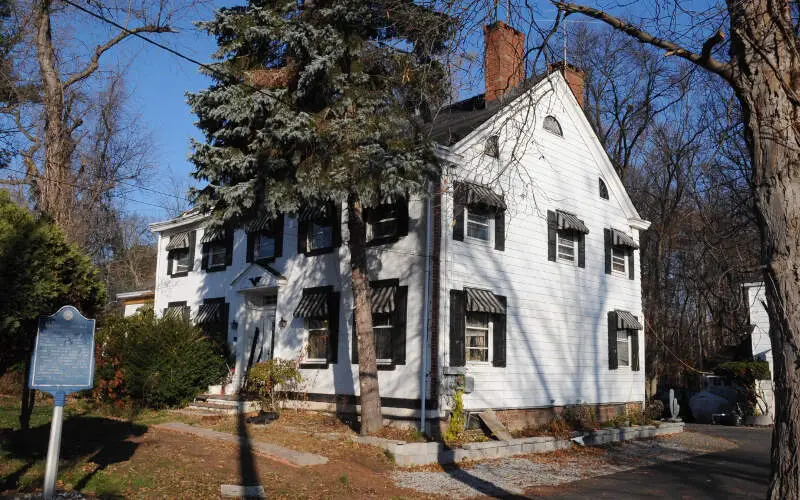
0.6% Native American · 156 Native American residents
Paramus is a borough in Bergen County, New Jersey, United States. As of the 2010 United States Census, the borough’s population was 26,342, reflecting an increase of 605 from the 25,737 counted in the 2000 Census, which had in turn increased by 670 from the 25,067 counted in the 1990 Census. A suburb of New York City, Paramus is located 15 to 20 miles northwest of Midtown Manhattan and approximately 8 miles west of Upper Manhattan. In 2013, it was named as a “New Jersey Healthy Town” under the state’s Mayor’s Wellness Campaign.
Data | Crime | Cost of living | Movers
0.5% Native American · 46 Native American residents
Closter is a borough in Bergen County, New Jersey, United States. As of the 2010 United States Census, the borough’s population was 8,373, reflecting a decline of 10 from the 8,383 counted in the 2000 Census, which had in turn increased by 289 from the 8,094 counted in the 1990 Census.
Data | Crime | Cost of living | Movers
0.5% Native American · 31 Native American residents
Paulsboro is a borough in Gloucester County, New Jersey, United States. As of the 2010 United States Census, the borough’s population was 6,097, reflecting a decline of 63 from the 6,160 counted in the 2000 Census, which had in turn declined by 417 from the 6,577 counted in the 1990 Census.
Data | Crime | Cost of living | Movers
0.5% Native American · 42 Native American residents
Haledon is a borough in Passaic County, New Jersey, United States. As of the 2010 United States Census, the borough’s population was 8,318, reflecting an increase of 66 from the 8,252 counted in the 2000 Census, which had in turn increased by 1,301 from the 6,951 counted in the 1990 Census.
Data | Crime | Cost of living | Movers
0.4% Native American · 66 Native American residents
Data | Crime | Cost of living | Movers
0.4% Native American · 84 Native American residents
Data | Crime | Cost of living | Movers
0.3% Native American · 157 Native American residents
Sayreville is a borough located on the Raritan River, near Raritan Bay in Middlesex County, New Jersey, United States. As of the 2010 United States Census, the borough’s population was 42,704, reflecting an increase of 2,327 from the 40,377 counted in the 2000 Census, which had in turn increased by 5,391 from the 34,986 counted in the 1990 Census.
Data | Crime | Cost of living | Movers
The receipts
Compare the top ten
Pick a metric. The bars rescale. The red line is New Jersey’s statewide median.
On the map
Where New Jersey’s Native American population is concentrated
Saturday Night Science
Methodology: How We Determined The Cities In New Jersey With The Largest Native American Population For 2026
We still believe in the accuracy of data — especially from the Census. So that’s where we went to get the race breakdown across New Jersey.
We used Saturday Night Science to analyze the Census’s most recently available data, the 2020-2024 American Community Survey data.
Specifically, we looked at table B03002: Hispanic OR LATINO ORIGIN BY RACE. Here are the category names as defined by the Census:
- Hispanic or Latino
- White alone
- Black or African American alone
- American Indian and Alaska Native alone
- Asian alone
- Native Hawaiian and Other Pacific Islander alone
- Some other race alone
- Two or more races
Our particular column of interest here was the number of people identifying as American Indian and Alaska Native alone.
We limited our analysis to places with a population greater than 5,000 people. That left us with 188 cities.
We then calculated the percentage of residents that are American Indian and Alaska Native. The percentages ranked from 0.70 to 0.00.
Finally, we ranked each city based on the percentage of the American Indian and Alaska Native population, with a higher score being more American Indian and Alaska Native than a lower score. Ringwood took the distinction of being the most American Indian and Alaska Native, while Woodland Park was the least Native American city.
We updated this article for 2026. This article is our eleventh time ranking the cities in New Jersey with the largest Native American population.
The full plate
Most Native American Places In New Jersey
Click any column to sort. Search by city name.
| Rank | City | Population | Native American Population | % Native American |
|---|---|---|---|---|
| 1 | Ringwood | 11,657 | 82 | 0.7% |
| 2 | Atlantic City | 38,632 | 245 | 0.6% |
| 3 | Harrison | 20,369 | 125 | 0.6% |
| 4 | Paramus | 26,568 | 156 | 0.6% |
| 5 | Closter | 8,606 | 46 | 0.5% |
| 6 | Paulsboro | 6,248 | 31 | 0.5% |
| 7 | Haledon | 8,980 | 42 | 0.5% |
| 8 | New Milford | 16,995 | 66 | 0.4% |
| 9 | Roselle | 22,646 | 84 | 0.4% |
| 10 | Sayreville | 45,838 | 157 | 0.3% |
| 11 | Millville | 27,511 | 86 | 0.3% |
| 12 | Wanaque | 11,206 | 31 | 0.3% |
| 13 | Bridgeton | 27,001 | 65 | 0.2% |
| 14 | Prospect Park | 6,319 | 15 | 0.2% |
| 15 | Carlstadt | 6,378 | 15 | 0.2% |
| 16 | Tenafly | 15,319 | 35 | 0.2% |
| 17 | Phillipsburg | 15,299 | 32 | 0.2% |
| 18 | Jersey City | 294,078 | 599 | 0.2% |
| 19 | Englewood | 29,638 | 51 | 0.2% |
| 20 | North Haledon | 8,778 | 15 | 0.2% |
| 21 | Pleasantville | 20,712 | 32 | 0.2% |
| 22 | Clementon | 5,410 | 8 | 0.1% |
| 23 | Newark | 310,178 | 454 | 0.1% |
| 24 | South Plainfield | 24,473 | 35 | 0.1% |
| 25 | Stratford | 7,018 | 10 | 0.1% |
| 26 | Hammonton | 14,840 | 20 | 0.1% |
| 27 | Palisades Park | 20,290 | 27 | 0.1% |
| 28 | Morristown | 20,453 | 23 | 0.1% |
| 29 | Raritan | 8,368 | 9 | 0.1% |
| 30 | Maywood | 10,093 | 10 | 0.1% |
| 31 | West Long Branch | 8,586 | 8 | 0.1% |
| 32 | Ocean City | 11,261 | 10 | 0.1% |
| 33 | Somers Point | 10,515 | 9 | 0.1% |
| 34 | Camden | 71,496 | 61 | 0.1% |
| 35 | Asbury Park | 15,295 | 13 | 0.1% |
| 36 | Little Ferry | 10,996 | 9 | 0.1% |
| 37 | Caldwell | 9,003 | 7 | 0.1% |
| 38 | Gloucester City | 11,509 | 8 | 0.1% |
| 39 | Bayonne | 71,553 | 47 | 0.1% |
| 40 | Chatham | 9,407 | 6 | 0.1% |
| 41 | Ramsey | 14,805 | 9 | 0.1% |
| 42 | Lindenwold | 21,719 | 13 | 0.1% |
| 43 | Florham Park | 13,564 | 8 | 0.1% |
| 44 | Hoboken | 58,668 | 34 | 0.1% |
| 45 | River Edge | 12,091 | 7 | 0.1% |
| 46 | Glen Rock | 12,154 | 7 | 0.1% |
| 47 | Collingswood | 14,205 | 8 | 0.1% |
| 48 | Cresskill | 9,174 | 5 | 0.1% |
| 49 | West New York | 52,004 | 27 | 0.1% |
| 50 | Fair Lawn | 35,610 | 18 | 0.1% |
| 51 | Vineland | 61,006 | 30 | 0.0% |
| 52 | North Arlington | 16,461 | 8 | 0.0% |
| 53 | Metuchen | 15,144 | 7 | 0.0% |
| 54 | Hackensack | 46,057 | 21 | 0.0% |
| 55 | Kearny | 40,614 | 18 | 0.0% |
| 56 | Fairview | 15,099 | 6 | 0.0% |
| 57 | Lodi | 26,082 | 10 | 0.0% |
| 58 | Cliffside Park | 25,781 | 9 | 0.0% |
| 59 | Trenton | 90,338 | 31 | 0.0% |
| 60 | Red Bank | 12,862 | 4 | 0.0% |
| 61 | Westfield | 31,111 | 8 | 0.0% |
| 62 | Passaic | 70,002 | 15 | 0.0% |
| 63 | Leonia | 9,336 | 2 | 0.0% |
| 64 | Union City | 66,463 | 14 | 0.0% |
| 65 | Point Pleasant | 19,334 | 4 | 0.0% |
| 66 | Elizabeth | 137,302 | 23 | 0.0% |
| 67 | Ridgewood | 26,308 | 4 | 0.0% |
| 68 | Hackett | 10,140 | 1 | 0.0% |
| 69 | Fort Lee | 40,067 | 3 | 0.0% |
| 70 | Long Branch | 32,530 | 2 | 0.0% |
| 71 | Paterson | 158,735 | 4 | 0.0% |
| 130 | Boonton | 8,854 | 0 | 0.0% |
| 130 | Bound Brook | 12,219 | 0 | 0.0% |
| 130 | Brigantine | 7,674 | 0 | 0.0% |
| 130 | Burlington | 9,993 | 0 | 0.0% |
| 130 | Glassboro | 23,717 | 0 | 0.0% |
| 130 | Haddon Heights | 7,516 | 0 | 0.0% |
| 130 | Northfield | 8,456 | 0 | 0.0% |
| 130 | Bogota | 9,360 | 0 | 0.0% |
| 130 | Manville | 10,921 | 0 | 0.0% |
| 130 | Margate City | 5,234 | 0 | 0.0% |
| 130 | Guttenberg | 11,754 | 0 | 0.0% |
| 130 | Bloomingdale | 7,716 | 0 | 0.0% |
| 130 | Belmar | 5,869 | 0 | 0.0% |
| 130 | Bernardsville | 7,916 | 0 | 0.0% |
| 130 | Bergenfield | 28,450 | 0 | 0.0% |
| 130 | Matawan | 9,710 | 0 | 0.0% |
| 130 | Bellmawr | 11,737 | 0 | 0.0% |
| 130 | Beachwood | 11,088 | 0 | 0.0% |
| 130 | Barrington | 7,076 | 0 | 0.0% |
| 130 | Audubon | 8,730 | 0 | 0.0% |
| 130 | Berlin | 7,539 | 0 | 0.0% |
| 130 | Carteret | 25,496 | 0 | 0.0% |
| 130 | Clayton | 8,921 | 0 | 0.0% |
| 130 | Clifton | 89,379 | 0 | 0.0% |
| 130 | Garfield | 32,783 | 0 | 0.0% |
| 130 | Butler | 8,133 | 0 | 0.0% |
| 130 | Allendale | 6,865 | 0 | 0.0% |
| 130 | Montvale | 8,901 | 0 | 0.0% |
| 130 | Midland Park | 7,019 | 0 | 0.0% |
Source: U.S. Census ACS 2020-2024, table B03002. 188 New Jersey cities with more than 5,000 residents.
Summary
Summary: Native American Populations Across New Jersey
If you’re looking for a breakdown of Native American populations across New Jersey according to the most recent data, this is an accurate list.
The most Native American cities in New Jersey are Ringwood, Atlantic City, Harrison, Paramus, Closter, Paulsboro, Haledon, New Milford, Roselle, and Sayreville.


