
Most Native American places in Texas research summary. We used Saturday Night Science to research the Texas cities with the highest percentage of Native American residents for 2026. The data comes from the American Community Survey 2020-2024 vintage, which breaks down race by origin.
-
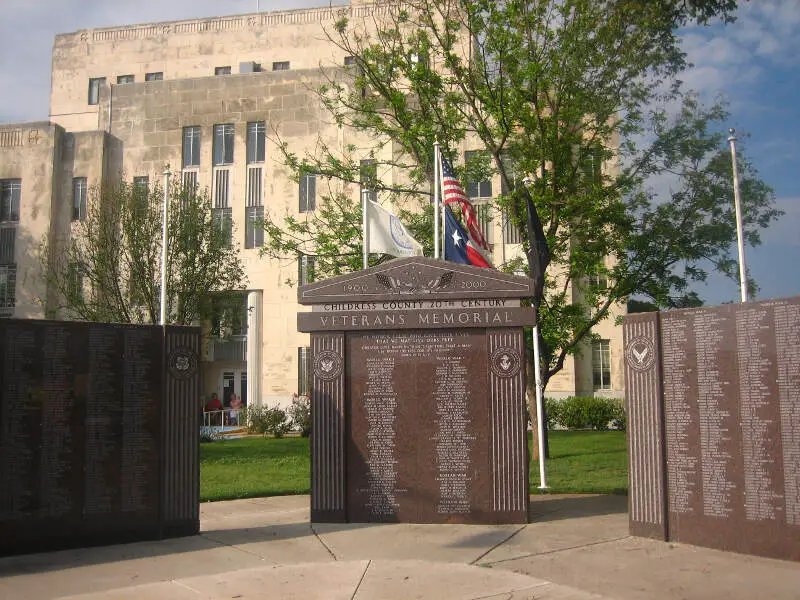
The city with the highest percentage of Native Americans is Childress. 1.68% of people in Childress are Native Americans.
-
The city with the lowest percentage of Native Americans is Kermit. 0.00% of people in Kermit are Native American.
-
The city with the most Native Americans is Houston. 2,541 people in Houston are Native American.
-
The city with the fewest Native Americans is Kermit. 0 people in Kermit are Native American.
-
The United States has 1,698,432 Native Americans and is 0.51% Native American.
Table Of Contents: Top Ten | Methodology | Summary | Table
The 10 Cities In Texas With The Largest Native American Population For 2026
Which city in Texas had the largest Native American population? The place with the largest Native American population in Texas for 2026 is Childress. 1.68 of Childress identify as Native American.
To see where Texas ranked as a state on diversity, we have a ranking of the most diverse states in America.
And if you already knew these places were Native American, check out the best places to live in Texas or the most diverse places in Texas.
Read below to see how we crunched the numbers and how your town ranked.
Cities In Texas With The Largest Native American Population For 2026

/10
Population: 5,834
# Of Native American Residents: 98
% Native American: 1.68%
More on Childress: Data | Crime | Cost Of Living | Movers

/10
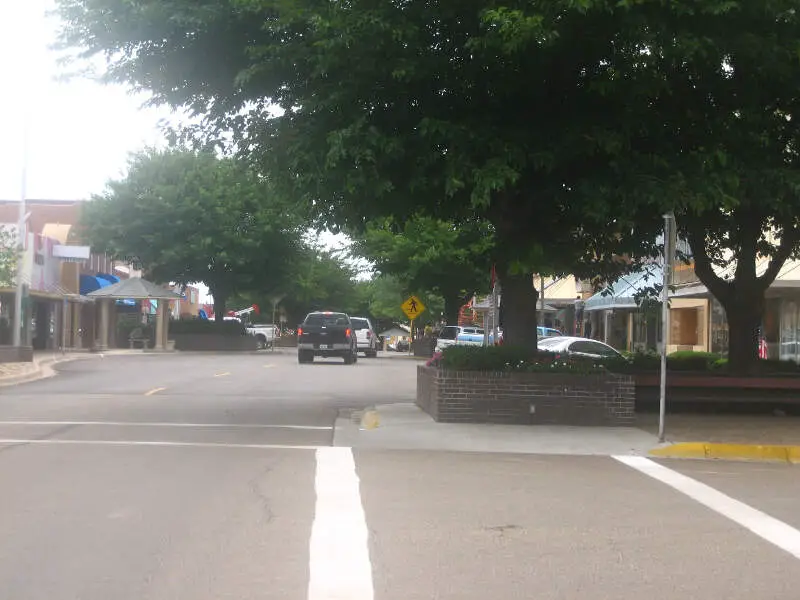
Population: 12,226
# Of Native American Residents: 201
% Native American: 1.64%
More on Borger: Data | Crime | Cost Of Living | Movers

/10
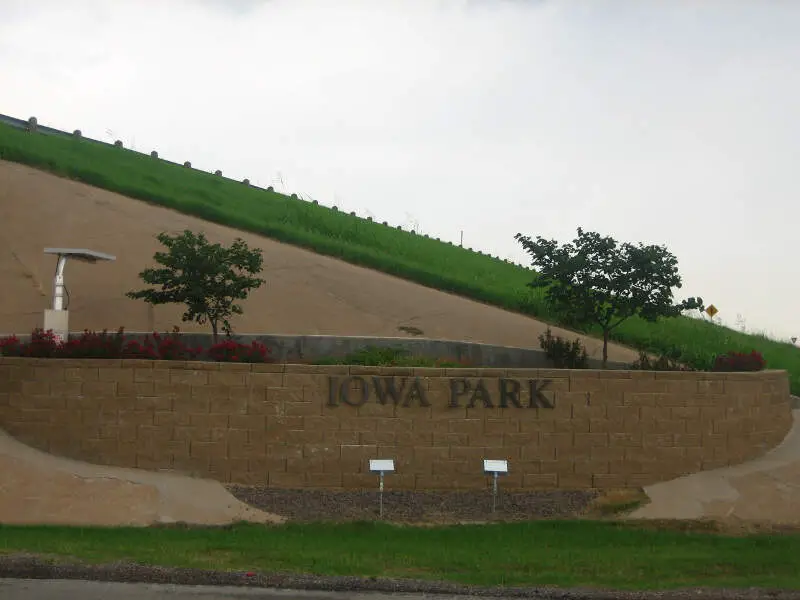
Population: 6,578
# Of Native American Residents: 100
% Native American: 1.52%
More on Iowa Park: Data | Crime | Cost Of Living | Movers

/10
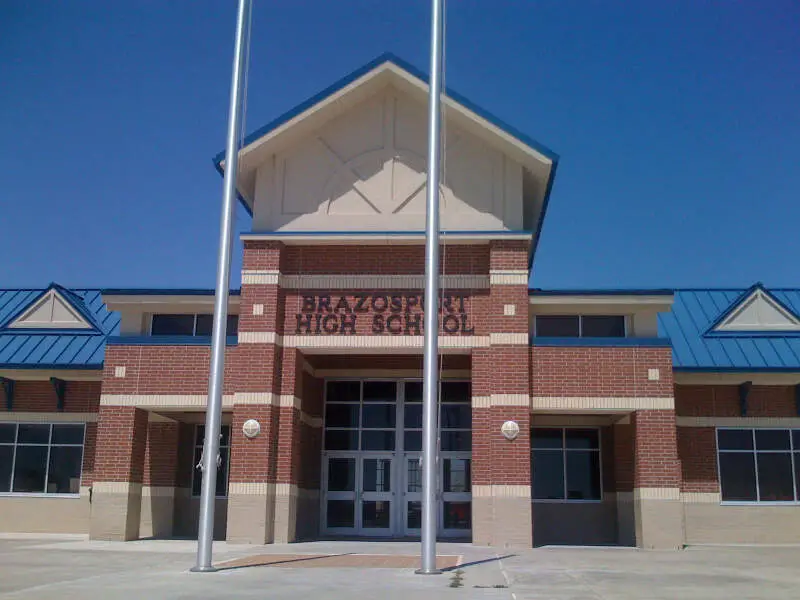
Population: 10,621
# Of Native American Residents: 139
% Native American: 1.31%
More on Freeport: Data | Crime | Cost Of Living | Movers

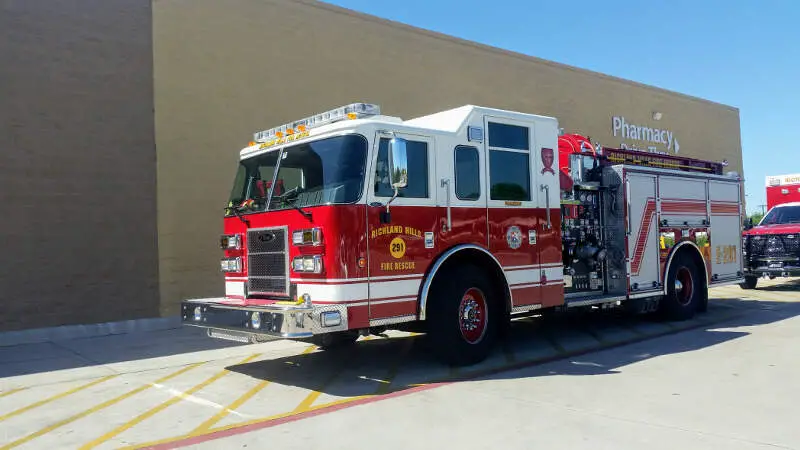
/10
Population: 8,493
# Of Native American Residents: 96
% Native American: 1.13%
More on Richland Hills: Data | Crime | Cost Of Living | Movers

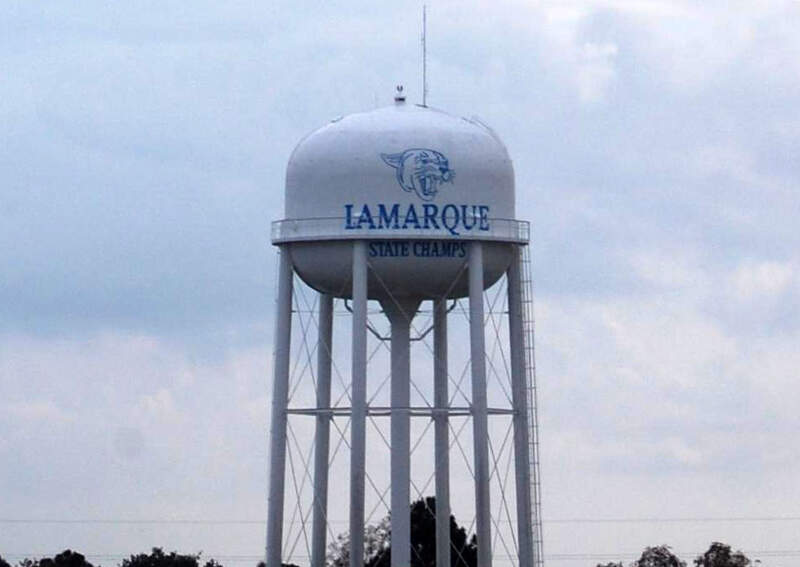
/10
Population: 19,268
# Of Native American Residents: 200
% Native American: 1.04%
More on La Marque: Data | Crime | Cost Of Living | Movers

/10
Population: 6,331
# Of Native American Residents: 64
% Native American: 1.01%
More on Bridgeport: Data | Crime | Cost Of Living | Movers

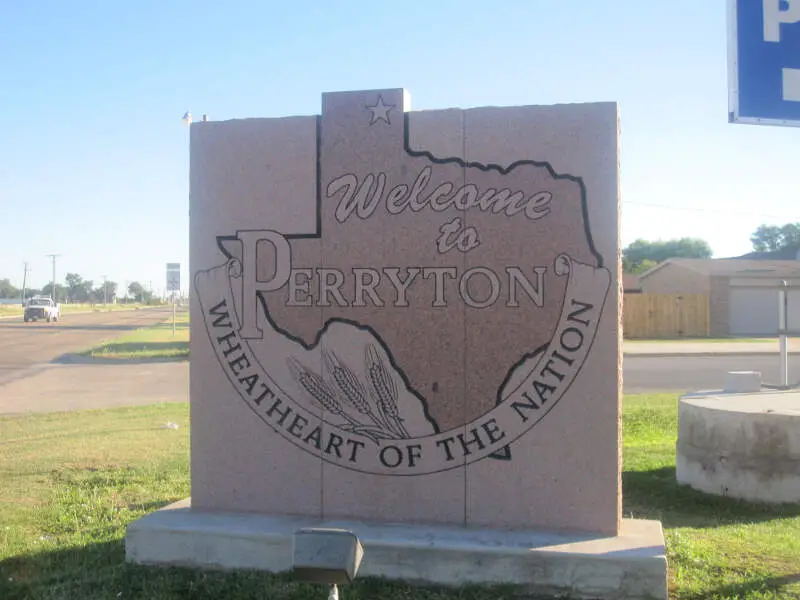
/10
Population: 8,585
# Of Native American Residents: 80
% Native American: 0.93%
More on Perryton: Data | Crime | Cost Of Living | Movers

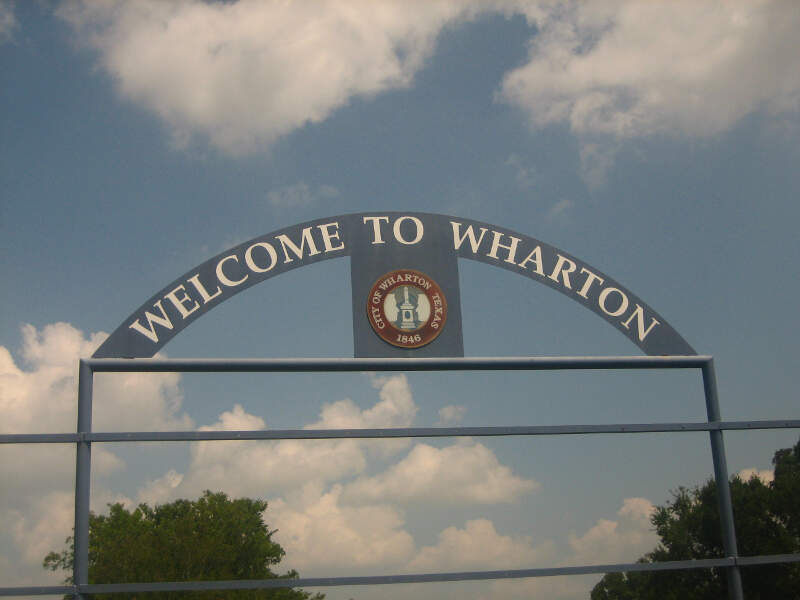
/10
Population: 8,724
# Of Native American Residents: 80
% Native American: 0.92%
More on Wharton: Data | Crime | Cost Of Living | Movers

/10
Population: 9,122
# Of Native American Residents: 82
% Native American: 0.9%
More on Whitehouse: Data | Crime | Cost Of Living | Movers
Methodology: How We Determined The Cities In Texas With The Largest Native American Population For 2026
We still believe in the accuracy of data — especially from the Census. So that’s where we went to get the race breakdown across Texas.
We used Saturday Night Science to analyze the Census’s most recently available data, the 2020-2024 American Community Survey data.
Specifically, we looked at table B03002: Hispanic OR LATINO ORIGIN BY RACE. Here are the category names as defined by the Census:
- Hispanic or Latino
- White alone*
- Black or African American alone*
- American Indian and Alaska Native alone*
- Asian alone*
- Native Hawaiian and Other Pacific Islander alone*
- Some other race alone*
- Two or more races*
Our particular column of interest here was the number of people identifying as American Indian and Alaska Native alone.
We limited our analysis to places with a population greater than 5,000 people. That left us with 324 cities.
We then calculated the percentage of residents that are American Indian and Alaska Native. The percentages ranked from 1.68 to 0.00.
Finally, we ranked each city based on the percentage of the American Indian and Alaska Native population, with a higher score being more American Indian and Alaska Native than a lower score. Childress took the distinction of being the most American Indian and Alaska Native, while Kermit was the least Native American city.
We updated this article for 2026. This article is our eleventh time ranking the cities in Texas with the largest Native American population.
Summary: Native American Populations Across Texas
If you’re looking for a breakdown of Native American populations across Texas according to the most recent data, this is an accurate list.
The most Native American cities in Texas are Childress, Borger, Iowa Park, Freeport, Richland Hills, La Marque, Bridgeport, Perryton, Wharton, and Whitehouse.
If you’re curious enough, here are the least Native American places in Texas:
- Kermit
- Gladewater
- Port Neches
For more Texas reading, check out:
- Best Places To Buy A House In Texas
- Best Places To Raise A Family In Texas
- Best Counties To Live In Texas
Most Native American Places In Texas
| Rank | City | Population | Native American Population | % Native American |
|---|---|---|---|---|
| 1 | Childress | 5,834 | 98 | 1.68% |
| 2 | Borger | 12,226 | 201 | 1.64% |
| 3 | Iowa Park | 6,578 | 100 | 1.52% |
| 4 | Freeport | 10,621 | 139 | 1.31% |
| 5 | Richland Hills | 8,493 | 96 | 1.13% |
| 6 | La Marque | 19,268 | 200 | 1.04% |
| 7 | Bridgeport | 6,331 | 64 | 1.01% |
| 8 | Perryton | 8,585 | 80 | 0.93% |
| 9 | Wharton | 8,724 | 80 | 0.92% |
| 10 | Whitehouse | 9,122 | 82 | 0.9% |
| 11 | White Oak | 6,235 | 55 | 0.88% |
| 12 | Lake Dallas | 7,822 | 59 | 0.75% |
| 13 | Horizon City | 23,668 | 174 | 0.74% |
| 14 | Sweetwater | 10,385 | 72 | 0.69% |
| 15 | Commerce | 9,383 | 62 | 0.66% |
| 16 | Universal City | 20,189 | 127 | 0.63% |
| 17 | Hitchcock | 7,563 | 45 | 0.6% |
| 18 | Azle | 14,126 | 82 | 0.58% |
| 19 | Gatesville | 16,228 | 91 | 0.56% |
| 20 | Pampa | 16,659 | 92 | 0.55% |
| 21 | Socorro | 37,123 | 202 | 0.54% |
| 22 | Brownfield | 8,738 | 47 | 0.54% |
| 23 | Stephenville | 21,682 | 109 | 0.5% |
| 24 | Taylor | 17,136 | 85 | 0.5% |
| 25 | Kilgore | 13,470 | 65 | 0.48% |
| 26 | Andrews | 13,468 | 64 | 0.48% |
| 27 | Uvalde | 15,417 | 72 | 0.47% |
| 28 | Hereford | 14,840 | 69 | 0.46% |
| 29 | Denison | 25,778 | 119 | 0.46% |
| 30 | Hempstead | 6,137 | 28 | 0.46% |
| 31 | Eagle Pass | 28,339 | 127 | 0.45% |
| 32 | Lakeway | 19,307 | 86 | 0.45% |
| 33 | Heath | 10,777 | 47 | 0.44% |
| 34 | Sealy | 7,053 | 30 | 0.43% |
| 35 | Monahans | 7,452 | 31 | 0.42% |
| 36 | Bowie | 5,770 | 24 | 0.42% |
| 37 | Anna | 24,330 | 100 | 0.41% |
| 38 | Graham | 8,792 | 36 | 0.41% |
| 39 | Seagoville | 19,352 | 78 | 0.4% |
| 40 | Burkburnett | 11,059 | 44 | 0.4% |
| 41 | Snyder | 11,241 | 44 | 0.39% |
| 42 | Alamo Heights | 7,492 | 29 | 0.39% |
| 43 | Joshua | 8,550 | 33 | 0.39% |
| 44 | Big Spring | 23,975 | 91 | 0.38% |
| 45 | Center | 5,271 | 19 | 0.36% |
| 46 | Colleyville | 26,012 | 93 | 0.36% |
| 47 | Cuero | 8,165 | 29 | 0.36% |
| 48 | Sanger | 9,641 | 33 | 0.34% |
| 49 | Celina | 34,268 | 112 | 0.33% |
| 50 | Alice | 17,707 | 56 | 0.32% |
| 51 | Atlanta | 5,439 | 17 | 0.31% |
| 52 | Dumas | 14,452 | 45 | 0.31% |
| 53 | Gainesville | 17,883 | 55 | 0.31% |
| 54 | Alvin | 28,333 | 86 | 0.3% |
| 55 | River Oaks | 7,584 | 23 | 0.3% |
| 56 | Santa Fe | 12,901 | 39 | 0.3% |
| 57 | Fairview | 10,783 | 32 | 0.3% |
| 58 | Aransas Pass | 8,972 | 25 | 0.28% |
| 59 | Duncanville | 39,683 | 110 | 0.28% |
| 60 | Corinth | 23,385 | 63 | 0.27% |
| 61 | Corsicana | 25,511 | 68 | 0.27% |
| 62 | Edna | 6,027 | 16 | 0.27% |
| 63 | Longview | 82,923 | 218 | 0.26% |
| 64 | Seabrook | 13,768 | 36 | 0.26% |
| 65 | Sachse | 30,491 | 79 | 0.26% |
| 66 | Brenham | 18,641 | 48 | 0.26% |
| 67 | Alton | 20,214 | 52 | 0.26% |
| 68 | Murphy | 21,188 | 52 | 0.25% |
| 69 | Harker Heights | 34,128 | 83 | 0.24% |
| 70 | Grapevine | 51,139 | 124 | 0.24% |
| 71 | Nacogdoches | 32,197 | 78 | 0.24% |
| 72 | Prosper | 37,869 | 91 | 0.24% |
| 73 | La Feria | 6,891 | 16 | 0.23% |
| 74 | Paris | 24,775 | 57 | 0.23% |
| 75 | Haltom City | 45,767 | 104 | 0.23% |
| 76 | University Park | 25,155 | 57 | 0.23% |
| 77 | Mount Pleasant | 16,136 | 36 | 0.22% |
| 78 | Nederland | 18,381 | 41 | 0.22% |
| 79 | Huntsville | 47,864 | 105 | 0.22% |
| 80 | Wichita Falls | 102,581 | 223 | 0.22% |
| 81 | Sherman | 46,397 | 100 | 0.22% |
| 82 | Little Elm | 54,820 | 117 | 0.21% |
| 83 | Gun Barrel City | 6,570 | 14 | 0.21% |
| 84 | Levelland | 12,466 | 26 | 0.21% |
| 85 | El Paso | 680,130 | 1,390 | 0.2% |
| 86 | Harlingen | 72,087 | 146 | 0.2% |
| 87 | Kingsville | 24,994 | 50 | 0.2% |
| 88 | Pleasanton | 11,011 | 22 | 0.2% |
| 89 | Farmers Branch | 36,645 | 72 | 0.2% |
| 90 | Waxahachie | 45,347 | 86 | 0.19% |
| 91 | Greenville | 31,222 | 58 | 0.19% |
| 92 | Odessa | 115,322 | 213 | 0.18% |
| 93 | Marshall | 23,825 | 44 | 0.18% |
| 94 | Weatherford | 35,788 | 66 | 0.18% |
| 95 | Amarillo | 201,885 | 370 | 0.18% |
| 96 | Palestine | 19,136 | 35 | 0.18% |
| 97 | Bellmead | 10,566 | 19 | 0.18% |
| 98 | Midland | 136,640 | 241 | 0.18% |
| 99 | Deer Park | 33,967 | 59 | 0.17% |
| 100 | Waco | 143,570 | 244 | 0.17% |