We analyzed research using Saturday Night Science from Virginia Commonwealth University that mapped Klaverns by city from 1915-1940. This report analyzes the locations of historic KKK organizations to see where they were the most prevalent in California.
The city in California with the most number of Klaverns was Oakland with 6 Klaverns. The city with the most number of Klaverns per capita was Randsburg with 0.0078 Klaverns. There were historically 67 Klaverns in California, across 43 places in California with at least 1 Klavern during the period of reference.
Hate groups can be hard to measure because, typically, there’s no record of where they exist. But there is data on where there were distinct Klaverns of the Ku Klux Klan in each state. These cities have historically been the most racist in California based on the number of KKK Klaverns.
This report does not speak to the current people who live there or the current state of the KKK in the same towns or areas.
1 Klaverns · #1 most historically racist in California
1 Klaverns · #2 most historically racist in California
Holtville is a city in Imperial County, California. Holtville is located 10.5 miles east of El Centro. The population was 5,939 at the 2010 census, up from 5,612 in 2000.
Data | Crime | Cost of living | Movers
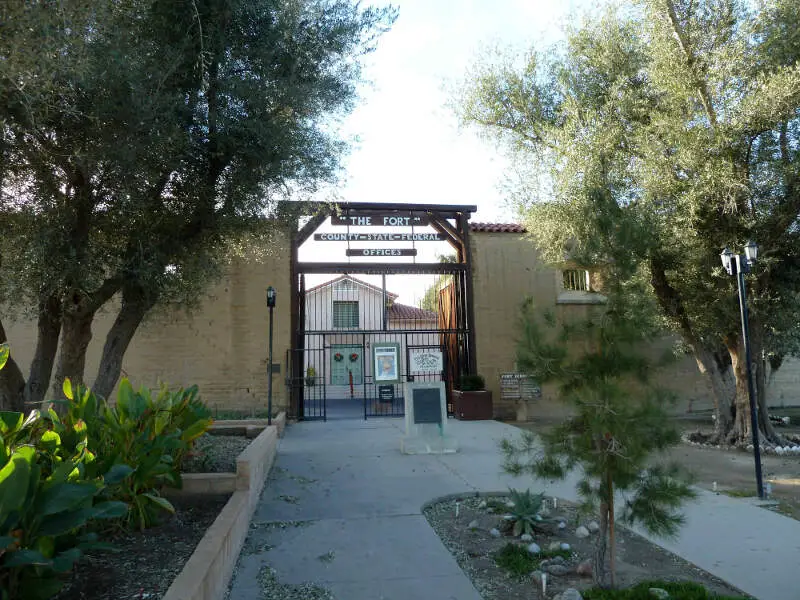
1 Klaverns · #3 most historically racist in California
Taft is a city in the foothills at the extreme southwestern edge of the San Joaquin Valley, in Kern County, California. Taft is located 32 miles west-southwest of Bakersfield, at an elevation of 955 feet. The population was 9,327 at the 2010 census. According to the United States Census Bureau, the city has a total area of 15.1 square miles.
Data | Crime | Cost of living | Movers
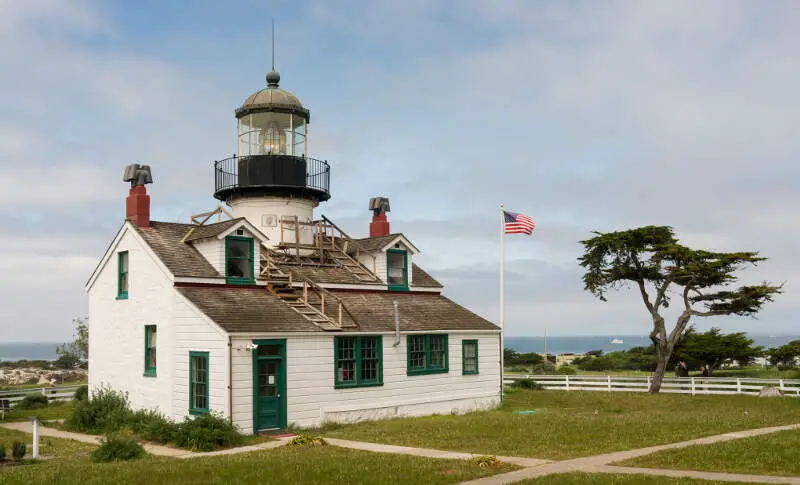
1 Klaverns · #4 most historically racist in California
Pacific Grove is a coastal city in Monterey County, California in the United States. The United States Census Bureau estimated its 2013 population at 15,504. Pacific Grove is located between Point Pinos and Monterey.
Data | Crime | Cost of living | Movers
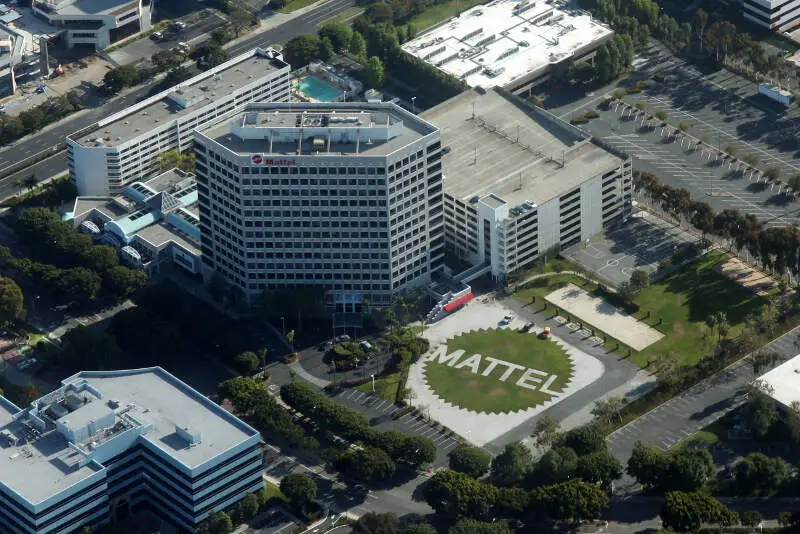
1 Klaverns · #5 most historically racist in California
El Segundo is a suburban city of Los Angeles located in Los Angeles County, California, United States. El Segundo, from Spanish, means “The Second” in English. Located on the Santa Monica Bay, it was incorporated on January 18, 1917, and part of the South Bay Cities Council of Governments. The population was 16,654 at the 2010 census, slightly up from 16,033 at the 2000 census.
Data | Crime | Cost of living | Movers
1 Klaverns · #6 most historically racist in California
Data | Crime | Cost of living | Movers
1 Klaverns · #7 most historically racist in California
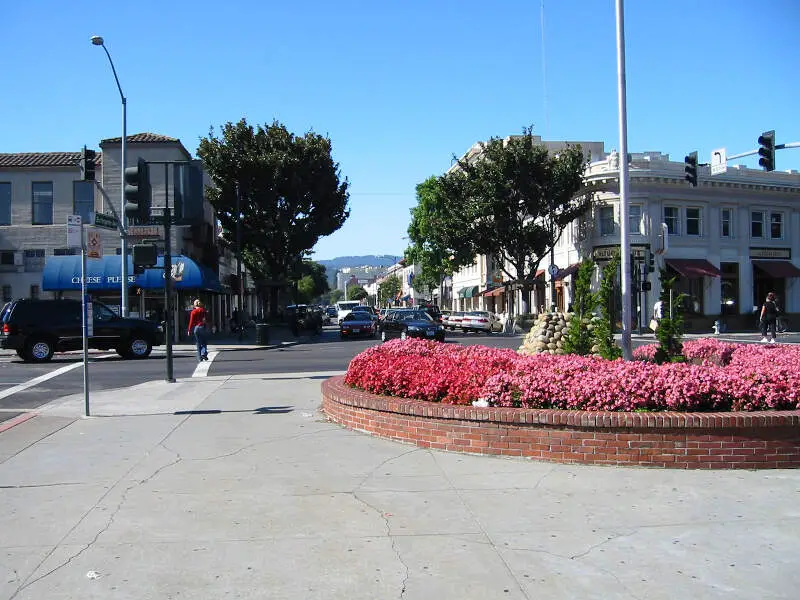
Burlingame is a city in San Mateo County, California. It is located on the San Francisco Peninsula and has a significant shoreline on San Francisco Bay. The city is named after diplomat Anson Burlingame and is often referred to as the City of Trees due to the number of trees within the city and its numerous eucalyptus groves. Burlingame is known for its high residential quality of life with a walkable downtown area and excellent public school system. The current median home value in Burlingame is $1.8M+ and as of the 2010 U.S. Census, Burlingame had a population of 28,806.
Data | Crime | Cost of living | Movers
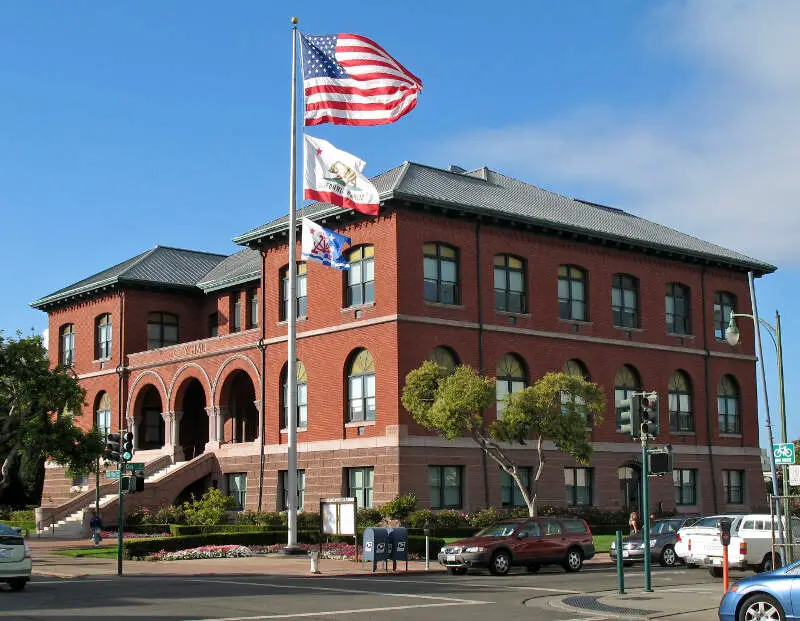
2 Klaverns · #8 most historically racist in California
Alameda is a city in Alameda County, California, United States. It is located on Alameda Island and Bay Farm Island, and is adjacent to and south of Oakland and east of San Francisco across the San Francisco Bay. Bay Farm Island, a portion of which is also known as “Harbor Bay Isle”, is not actually an island, and is part of the mainland adjacent to the Oakland International Airport. The city’s estimated 2017 population was 79,928. Alameda is a charter city, rather than a general law city, allowing the city to provide for any form of government. Alameda became a charter city and adopted a council-manager government in 1916, which it retains to the present.
Data | Crime | Cost of living | Movers
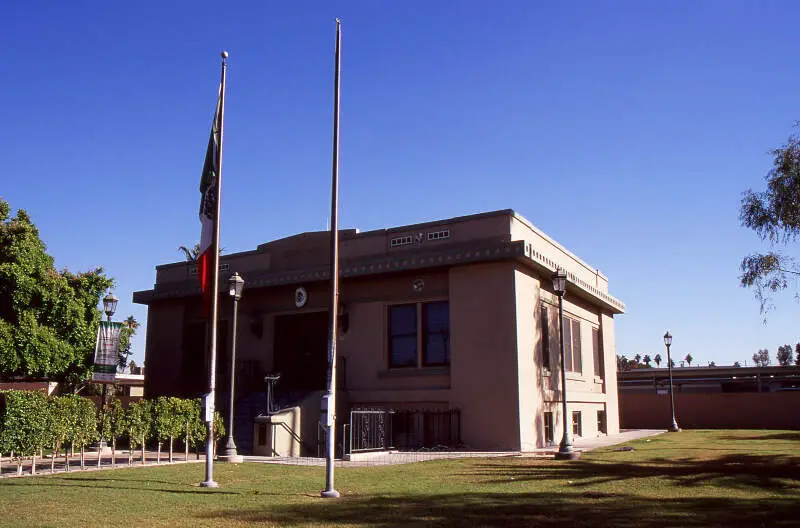
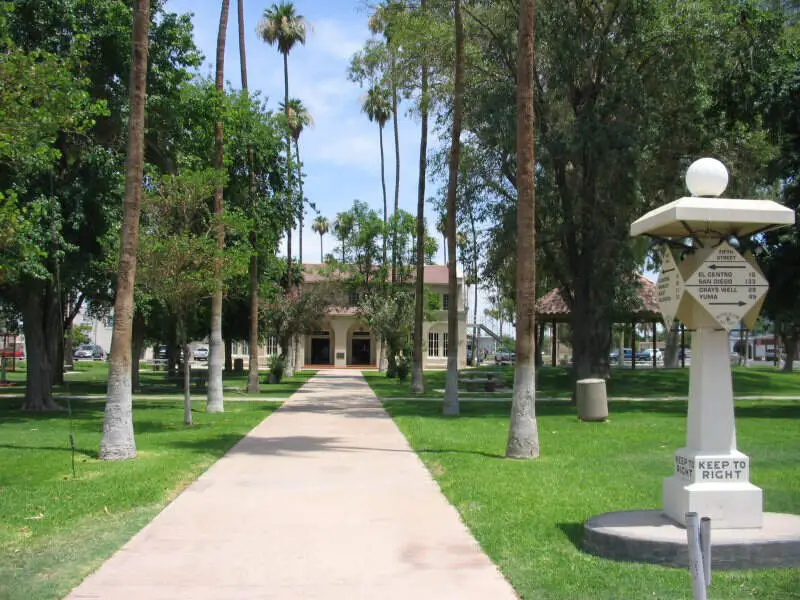
1 Klaverns · #9 most historically racist in California
Calexico is a city in Imperial County, California. The population was 38,572 at the 2010 census, up from 27,109 at the 2000 census. Calexico is about 122 miles east of San Diego and 62 miles west of Yuma, Arizona. The name of the city is a portmanteau of California and Mexico, which, like that of its adjacent sister city of Mexicali, emphasizes its identity as a border city.
Data | Crime | Cost of living | Movers
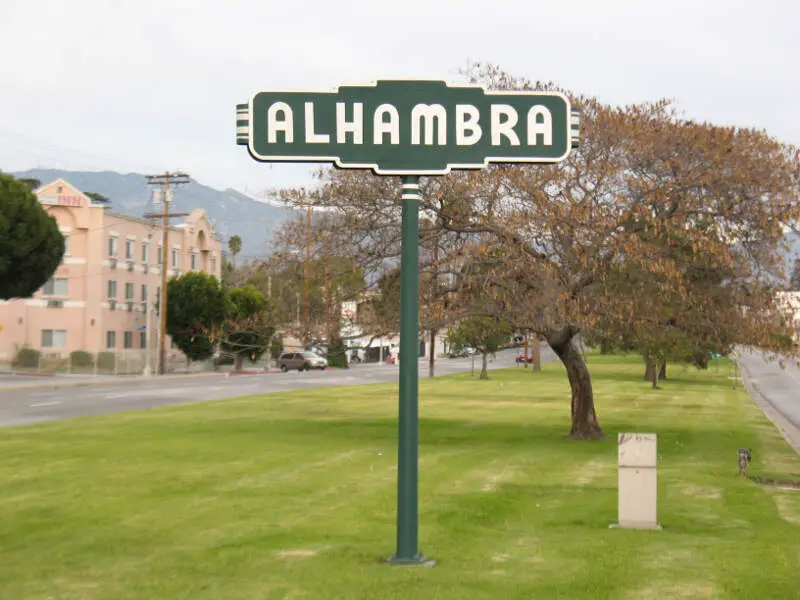
2 Klaverns · #10 most historically racist in California
Alhambra is a city located in the western San Gabriel Valley region of Los Angeles County, California, United States, approximately eight miles from the Downtown Los Angeles civic center. It was incorporated on July 11, 1903. As of the 2010 census, the population was 83,089. The city’s ZIP codes are 91801 and 91803.
Data | Crime | Cost of living | Movers
The receipts
Compare the top ten
Pick a metric. The bars rescale. The red line is California’s statewide median.
On the map
Where California’s historic Klaverns were
Saturday Night Science
Methodology: How We Measured The Most Historically Racist Places In The Golden State
While there are surveys and public polls on what places might be the most racist, we didn’t want to rely on speculation and opinion. Instead, we looked at the hard numbers from where KKK organizations have existed.
Specifically, we analyzed research out of Virginia Commonwealth University that mapped the Klans in each area and gave a history of their recruitment from 1915-1940.
- Number of historic KKK Klaverns (1915-1940) per current resident
Using Saturday Night Science, we analyzed the locations of historic KKK organizations per capita using current population data.
The full plate
Cities With Historically High KKK Membership In California
Click any column to sort. Search by city name.
| Rank | City | Population | Klaverns | Klaverns /100k |
|---|---|---|---|---|
| 1 | Randsburg | 128 | 1 | 781 |
| 2 | Holtville | 6,067 | 1 | 16 |
| 3 | Taft | 9,063 | 1 | 11 |
| 4 | Pacific Grove | 15,365 | 1 | 7 |
| 5 | El Segundo | 16,839 | 1 | 6 |
| 6 | Selma | 23,808 | 1 | 4 |
| 7 | Burlingame | 29,618 | 1 | 3 |
| 8 | Alameda | 75,763 | 2 | 3 |
| 9 | Calexico | 39,281 | 1 | 3 |
| 10 | Alhambra | 84,400 | 2 | 2 |
| 11 | Watsonville | 52,085 | 1 | 2 |
| 12 | Colton | 53,129 | 1 | 2 |
| 13 | Inglewood | 111,133 | 2 | 2 |
| 14 | Vallejo | 118,078 | 2 | 2 |
| 15 | Tulare | 60,663 | 1 | 2 |
| 16 | Santa Cruz | 62,045 | 1 | 2 |
| 17 | Montebello | 63,353 | 1 | 2 |
| 18 | Visalia | 126,942 | 2 | 2 |
| 19 | Palo Alto | 65,998 | 1 | 2 |
| 20 | Oakland | 402,339 | 6 | 1 |
| 21 | Redondo Beach | 67,511 | 1 | 1 |
| 22 | Pasadena | 139,065 | 2 | 1 |
| 23 | Napa | 78,511 | 1 | 1 |
| 24 | Hawthorne | 85,889 | 1 | 1 |
| 25 | Chico | 87,517 | 1 | 1 |
| 26 | Santa Monica | 91,619 | 1 | 1 |
| 27 | Santa Maria | 101,468 | 1 | 1 |
| 28 | Antioch | 105,630 | 1 | 1 |
| 29 | San Bernardino | 213,044 | 2 | 1 |
| 29 | Richmond | 106,469 | 1 | 1 |
| 31 | Orange | 138,980 | 1 | 1 |
| 32 | Torrance | 147,181 | 1 | 1 |
| 33 | San Francisco | 829,072 | 5 | 1 |
| 34 | Ontario | 166,892 | 1 | 1 |
| 35 | Fresno | 506,132 | 3 | 1 |
| 36 | Glendale | 195,380 | 1 | 1 |
| 37 | Long Beach | 468,594 | 2 | 0 |
| 38 | Anaheim | 342,973 | 1 | 0 |
| 39 | Bakersfield | 358,700 | 1 | 0 |
| 40 | Sacramento | 476,075 | 1 | 0 |
| 41 | San Jose | 986,320 | 2 | 0 |
| 42 | San Diego | 1,341,510 | 2 | 0 |
| 43 | Los Angeles | 3,862,210 | 4 | 0 |
Source: VCU Mapping the Klan, 1915-1940; current population data. 43 cities with at least one Klavern.
Summary
There You Have It – The Most Historically Racist Cities In California
When you’re looking at the places in California with the highest number of historical KKK Klaverns per capita, this is an accurate list.
Below is a chart that lists all cities in California with at least one KKK organization from 1915-1940.
The cities with the largest number of KKK Klaverns per capita were Randsburg, Holtville, Taft, Pacific Grove, El Segundo, Selma, Burlingame, Alameda, Calexico, and Alhambra.


