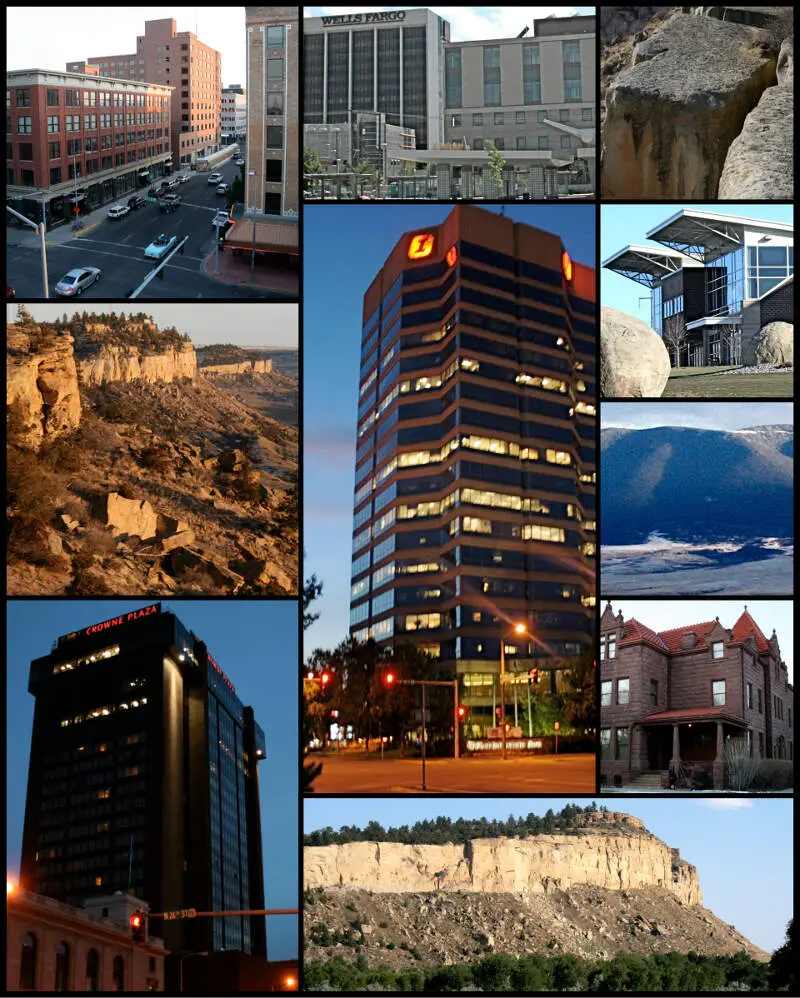
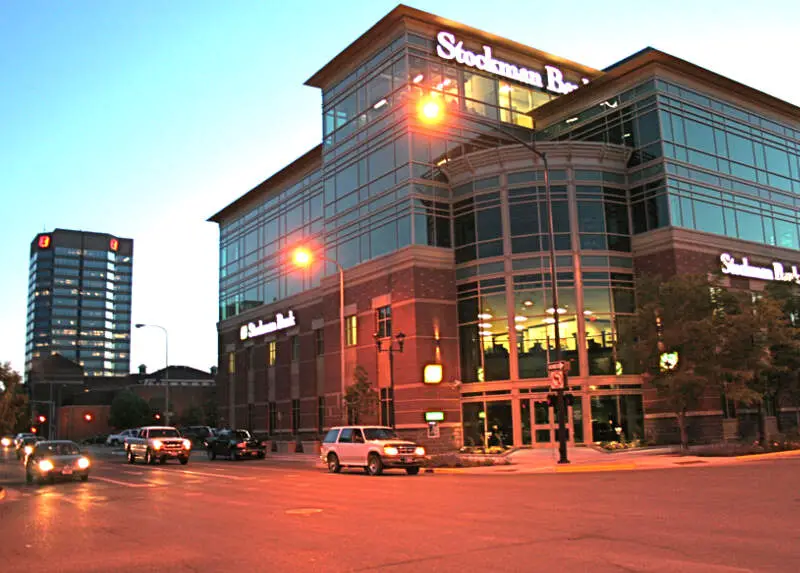
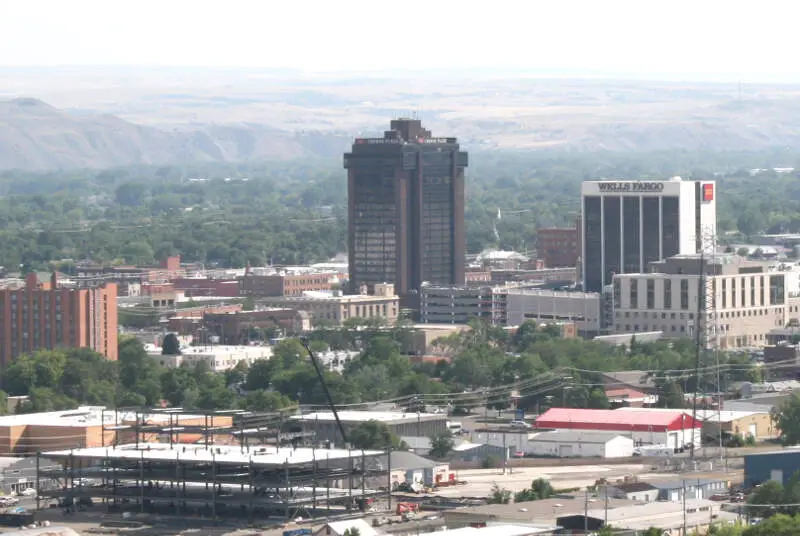
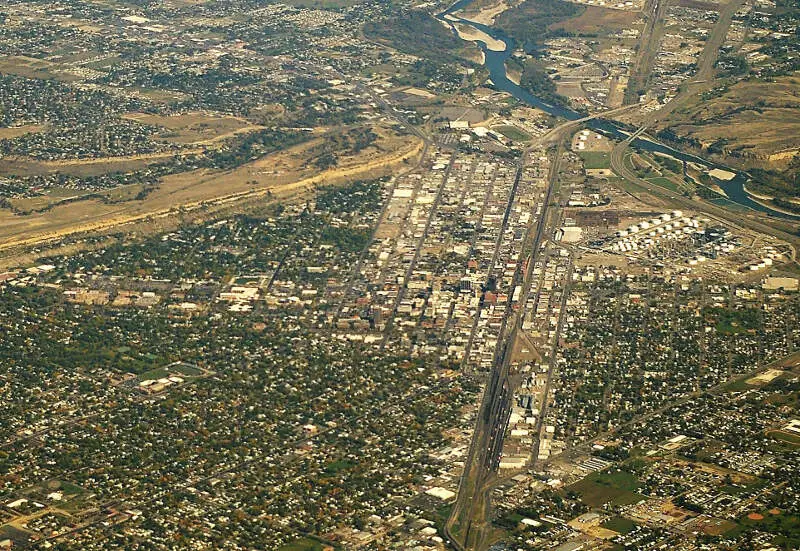
Billings, MT
Demographics And Statistics
Living In Billings, Montana Summary
Life in Billings research summary. HomeSnacks has been using Saturday Night Science to research the quality of life in Billings over the past nine years using Census, FBI, Zillow, and other primary data sources. Based on the most recently available data, we found the following about life in Billings:
The population in Billings is 118,321.
The median home value in Billings is $393,958.
The median income in Billings is $71,855.
The cost of living in Billings is 108 which is 1.1x higher than the national average.
The median rent in Billings is $1,097.
The unemployment rate in Billings is 3.5%.
The poverty rate in Billings is 10.6%.
The average high in Billings is 61.5° and the average low is 34.1°.
Billings SnackAbility
Overall SnackAbility
Billings, MT Crime Report
Crime in Billings summary. We use data from the FBI to determine the crime rates in Billings. Key points include:
There were 4,676 total crimes in Billings in the last reporting year.
The overall crime rate per 100,000 people in Billings is 3,829.5 / 100k people.
The violent crime rate per 100,000 people in Billings is 746.1 / 100k people.
The property crime rate per 100,000 people in Billings is 3,083.4 / 100k people.
Overall, crime in Billings is 80.70% above the national average.
Total Crimes
Above National Average
Crime In Billings Comparison Table
| Statistic | Count Raw |
Billings / 100k People |
Montana / 100k People |
National / 100k People |
|---|---|---|---|---|
| Total Crimes Per 100K | 4,676 | 3,829.5 | 2,040.7 | 2,119.2 |
| Violent Crime | 911 | 746.1 | 423.5 | 359.0 |
| Murder | 9 | 7.4 | 2.7 | 5.0 |
| Robbery | 105 | 86.0 | 19.1 | 61.0 |
| Aggravated Assault | 701 | 574.1 | 342.5 | 256.0 |
| Property Crime | 3,765 | 3,083.4 | 1,617.3 | 1,760.0 |
| Burglary | 445 | 364.4 | 167.2 | 229.0 |
| Larceny | 2,808 | 2,299.7 | 1,286.0 | 1,272.0 |
| Car Theft | 512 | 419.3 | 164.0 | 259.0 |
Billings, MT Cost Of Living
Cost of living in Billings summary. We use data on the cost of living to determine how expensive it is to live in Billings. Real estate prices drive most of the variance in cost of living around Montana. Key points include:
The cost of living in Billings is 108 with 100 being average.
The cost of living in Billings is 1.1x higher than the national average.
The median home value in Billings is $393,958.
The median income in Billings is $71,855.
Billings's Overall Cost Of Living
Higher Than The National Average
Cost Of Living In Billings Comparison Table
| Living Expense | Billings | Montana | National Average | |
|---|---|---|---|---|
| Overall | 108 | 101 | 100 | |
| Services | 103 | 104 | 100 | |
| Groceries | 103 | 102 | 100 | |
| Health | 103 | 99 | 100 | |
| Housing | 116 | 100 | 100 | |
| Transportation | 127 | 107 | 100 | |
| Utilities | 92 | 95 | 100 | |
Billings, MT Weather
The average high in Billings is 61.5° and the average low is 34.1°.
There are 38.8 days of precipitation each year.
Expect an average of 13.8 inches of precipitation each year with 49.3 inches of snow.
| Stat | Billings |
|---|---|
| Average Annual High | 61.5 |
| Average Annual Low | 34.1 |
| Annual Precipitation Days | 38.8 |
| Average Annual Precipitation | 13.8 |
| Average Annual Snowfall | 49.3 |
Average High
Days of Rain
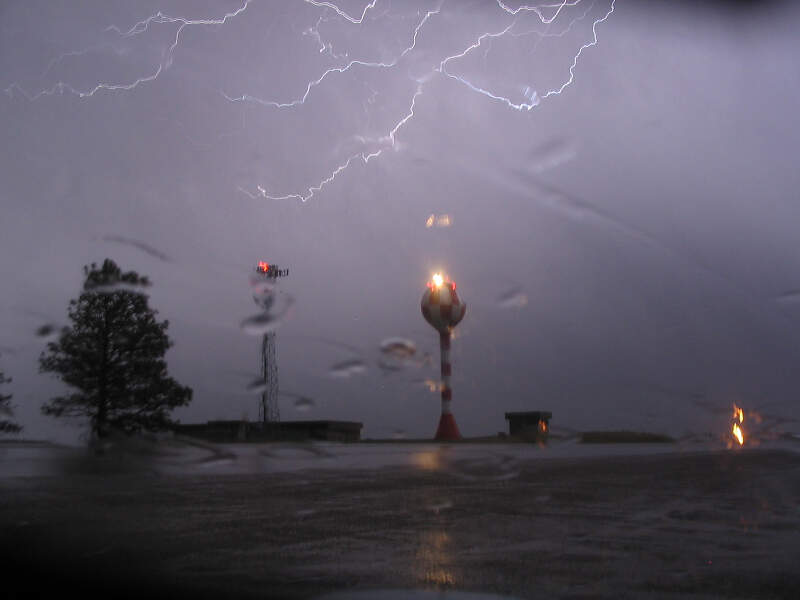
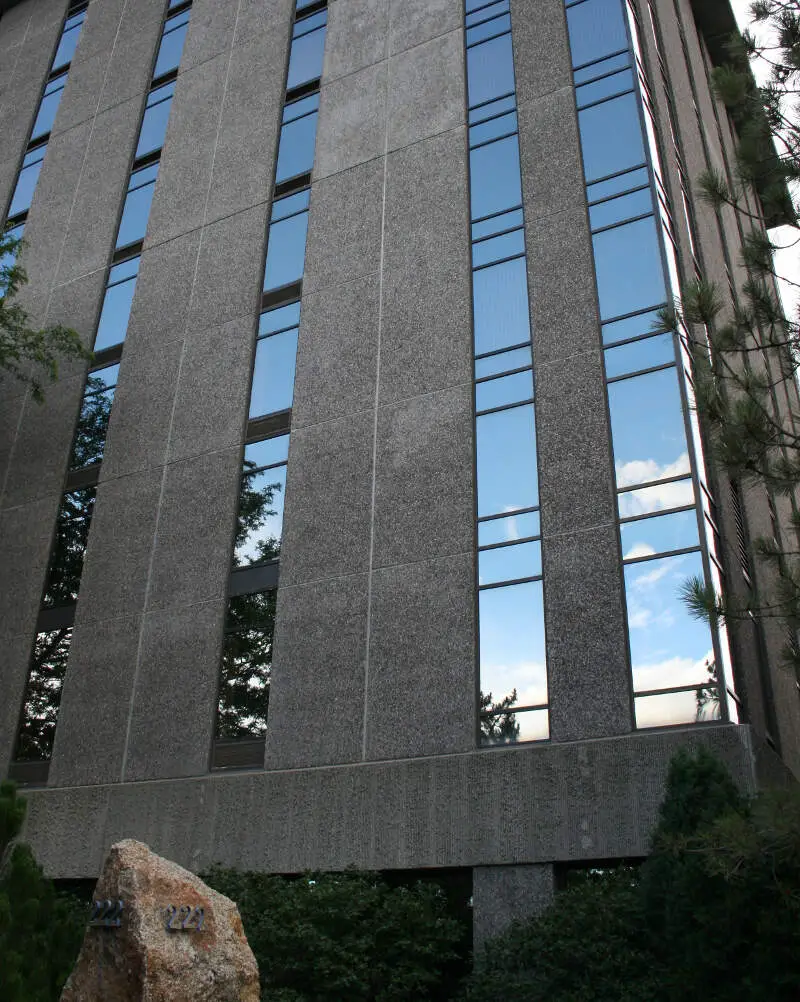
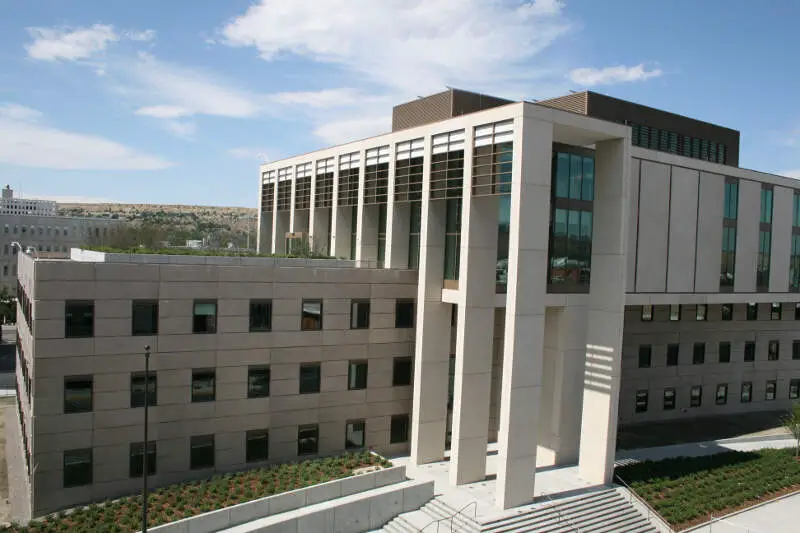
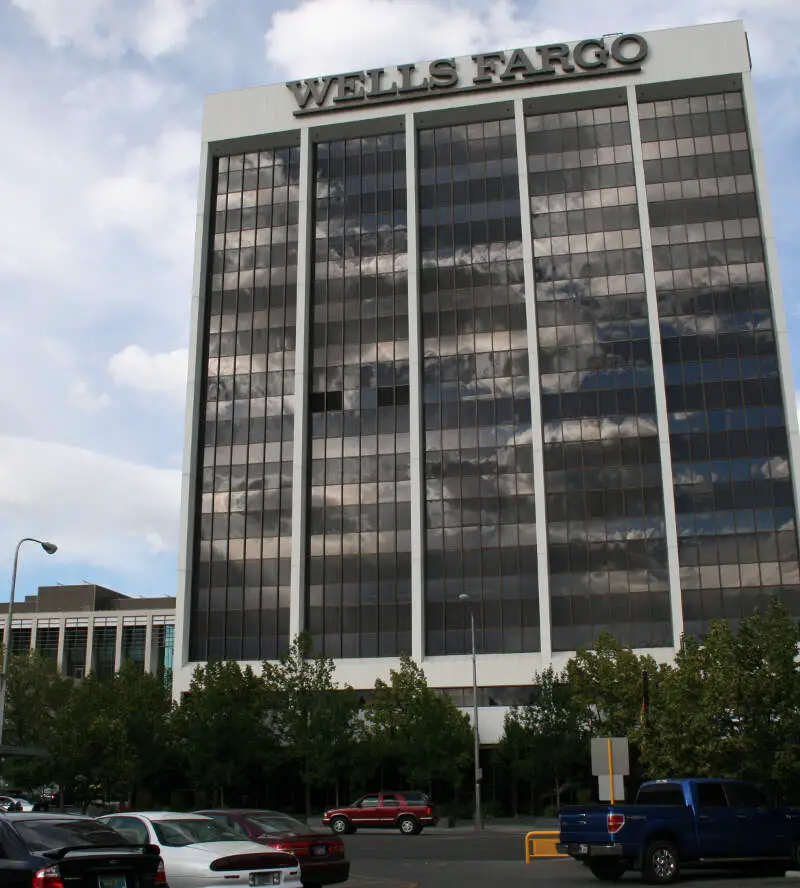
Billings, MT Photos
1 Reviews & Comments About Billings
/5

HomeSnacks User - None
I've had a brother that lived in Billings MT and we have cousins that live in Malta and Chinook MT. Anytime we've ever been there we've always enjoyed the different beauty and life style.
Farming is on the range there and farming in other places have different ways to raising their animals but they all come out the same if it's for the same purpose
Rankings for Billings in Montana


Locations Around Billings
Map Of Billings, MT
Best Places Around Billings
Lockwood, MT
Population 7,474
Laurel, MT
Population 7,198
Hardin, MT
Population 3,766
Billings Demographics And Statistics
Population over time in Billings
The current population in Billings is 118,321. The population has increased 16.5% from 2010.
| Year | Population | % Change |
|---|---|---|
| 2023 | 118,321 | 1.0% |
| 2022 | 117,093 | 1.2% |
| 2021 | 115,689 | 5.5% |
| 2020 | 109,705 | 0.1% |
| 2019 | 109,595 | 0.1% |
| 2018 | 109,431 | 0.3% |
| 2017 | 109,082 | -0.0% |
| 2016 | 109,089 | 0.9% |
| 2015 | 108,134 | 1.1% |
| 2014 | 106,979 | 1.1% |
| 2013 | 105,864 | 1.4% |
| 2012 | 104,374 | 1.4% |
| 2011 | 102,982 | 1.4% |
| 2010 | 101,549 | - |
Race / Ethnicity in Billings
Billings is:
83.2% White with 98,465 White residents.
0.5% African American with 569 African American residents.
4.2% American Indian with 4,929 American Indian residents.
0.8% Asian with 938 Asian residents.
0.1% Hawaiian with 64 Hawaiian residents.
0.2% Other with 182 Other residents.
3.9% Two Or More with 4,654 Two Or More residents.
7.2% Hispanic with 8,520 Hispanic residents.
| Race | Billings | MT | USA |
|---|---|---|---|
| White | 83.2% | 84.1% | 58.2% |
| African American | 0.5% | 0.5% | 12.0% |
| American Indian | 4.2% | 5.5% | 0.5% |
| Asian | 0.8% | 0.8% | 5.7% |
| Hawaiian | 0.1% | 0.0% | 0.2% |
| Other | 0.2% | 0.4% | 0.5% |
| Two Or More | 3.9% | 4.3% | 3.9% |
| Hispanic | 7.2% | 4.4% | 19.0% |
Gender in Billings
Billings is 50.5% female with 59,706 female residents.
Billings is 49.5% male with 58,615 male residents.
| Gender | Billings | MT | USA |
|---|---|---|---|
| Female | 50.5% | 49.3% | 50.5% |
| Male | 49.5% | 50.7% | 49.5% |
Highest level of educational attainment in Billings for adults over 25
0.0% of adults in Billings completed < 9th grade.
3.0% of adults in Billings completed 9-12th grade.
28.0% of adults in Billings completed high school / ged.
23.0% of adults in Billings completed some college.
8.0% of adults in Billings completed associate's degree.
25.0% of adults in Billings completed bachelor's degree.
8.0% of adults in Billings completed master's degree.
3.0% of adults in Billings completed professional degree.
2.0% of adults in Billings completed doctorate degree.
| Education | Billings | MT | USA |
|---|---|---|---|
| < 9th Grade | 0.0% | 1.0% | 5.0% |
| 9-12th Grade | 3.0% | 4.0% | 6.0% |
| High School / GED | 28.0% | 28.0% | 26.0% |
| Some College | 23.0% | 22.0% | 19.0% |
| Associate's Degree | 8.0% | 10.0% | 9.0% |
| Bachelor's Degree | 25.0% | 23.0% | 21.0% |
| Master's Degree | 8.0% | 8.0% | 10.0% |
| Professional Degree | 3.0% | 2.0% | 2.0% |
| Doctorate Degree | 2.0% | 2.0% | 2.0% |
Household Income For Billings, Montana
3.5% of households in Billings earn Less than $10,000.
3.7% of households in Billings earn $10,000 to $14,999.
7.0% of households in Billings earn $15,000 to $24,999.
7.4% of households in Billings earn $25,000 to $34,999.
12.6% of households in Billings earn $35,000 to $49,999.
18.1% of households in Billings earn $50,000 to $74,999.
13.0% of households in Billings earn $75,000 to $99,999.
17.9% of households in Billings earn $100,000 to $149,999.
7.8% of households in Billings earn $150,000 to $199,999.
9.1% of households in Billings earn $200,000 or more.
| Income | Billings | MT | USA |
|---|---|---|---|
| Less than $10,000 | 3.5% | 4.4% | 4.9% |
| $10,000 to $14,999 | 3.7% | 3.8% | 3.6% |
| $15,000 to $24,999 | 7.0% | 7.5% | 6.6% |
| $25,000 to $34,999 | 7.4% | 8.0% | 6.8% |
| $35,000 to $49,999 | 12.6% | 12.1% | 10.4% |
| $50,000 to $74,999 | 18.1% | 17.8% | 15.7% |
| $75,000 to $99,999 | 13.0% | 13.7% | 12.7% |
| $100,000 to $149,999 | 17.9% | 16.8% | 17.4% |
| $150,000 to $199,999 | 7.8% | 7.7% | 9.3% |
| $200,000 or more | 9.1% | 8.1% | 12.6% |


