Aberdeen, NC
Demographics And Statistics
Living In Aberdeen, North Carolina Summary
Life in Aberdeen research summary. HomeSnacks has been using Saturday Night Science to research the quality of life in Aberdeen over the past nine years using Census, FBI, Zillow, and other primary data sources. Based on the most recently available data, we found the following about life in Aberdeen:
The population in Aberdeen is 8,969.
The median home value in Aberdeen is $345,712.
The median income in Aberdeen is $72,955.
The cost of living in Aberdeen is 99 which is 1.0x lower than the national average.
The median rent in Aberdeen is $1,151.
The unemployment rate in Aberdeen is 3.2%.
The poverty rate in Aberdeen is 10.3%.
The average high in Aberdeen is 72.7° and the average low is 49.9°.
Aberdeen SnackAbility
Overall SnackAbility
Aberdeen, NC Crime Report
Crime in Aberdeen summary. We use data from the FBI to determine the crime rates in Aberdeen. Key points include:
There were 344 total crimes in Aberdeen in the last reporting year.
The overall crime rate per 100,000 people in Aberdeen is 3,512.0 / 100k people.
The violent crime rate per 100,000 people in Aberdeen is 245.0 / 100k people.
The property crime rate per 100,000 people in Aberdeen is 3,267.0 / 100k people.
Overall, crime in Aberdeen is 65.72% above the national average.
Total Crimes
Above National Average
Crime In Aberdeen Comparison Table
| Statistic | Count Raw |
Aberdeen / 100k People |
North Carolina / 100k People |
National / 100k People |
|---|---|---|---|---|
| Total Crimes Per 100K | 344 | 3,512.0 | 2,343.9 | 2,119.2 |
| Violent Crime | 24 | 245.0 | 375.8 | 359.0 |
| Murder | 0 | 0.0 | 7.5 | 5.0 |
| Robbery | 0 | 0.0 | 50.2 | 61.0 |
| Aggravated Assault | 24 | 245.0 | 290.1 | 256.0 |
| Property Crime | 320 | 3,267.0 | 1,968.1 | 1,760.0 |
| Burglary | 49 | 500.3 | 323.9 | 229.0 |
| Larceny | 256 | 2,613.6 | 1,390.2 | 1,272.0 |
| Car Theft | 15 | 153.1 | 254.1 | 259.0 |
Aberdeen, NC Cost Of Living
Cost of living in Aberdeen summary. We use data on the cost of living to determine how expensive it is to live in Aberdeen. Real estate prices drive most of the variance in cost of living around North Carolina. Key points include:
The cost of living in Aberdeen is 99 with 100 being average.
The cost of living in Aberdeen is 1.0x lower than the national average.
The median home value in Aberdeen is $345,712.
The median income in Aberdeen is $72,955.
Aberdeen's Overall Cost Of Living
Lower Than The National Average
Cost Of Living In Aberdeen Comparison Table
| Living Expense | Aberdeen | North Carolina | National Average | |
|---|---|---|---|---|
| Overall | 99 | 92 | 100 | |
| Services | 96 | 100 | 100 | |
| Groceries | 102 | 99 | 100 | |
| Health | 104 | 106 | 100 | |
| Housing | 102 | 86 | 100 | |
| Transportation | 93 | 93 | 100 | |
| Utilities | 90 | 95 | 100 | |
Aberdeen, NC Weather
The average high in Aberdeen is 72.7° and the average low is 49.9°.
There are 73.9 days of precipitation each year.
Expect an average of 46.8 inches of precipitation each year with 2.6 inches of snow.
| Stat | Aberdeen |
|---|---|
| Average Annual High | 72.7 |
| Average Annual Low | 49.9 |
| Annual Precipitation Days | 73.9 |
| Average Annual Precipitation | 46.8 |
| Average Annual Snowfall | 2.6 |
Average High
Days of Rain
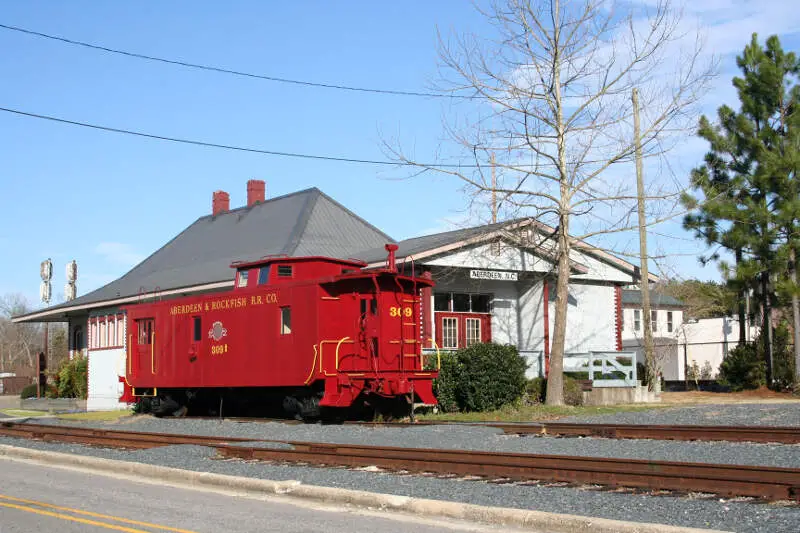
Aberdeen, NC Photos
1 Reviews & Comments About Aberdeen
/5

HomeSnacks User - None
I moved the Aberdeen to get away from the REAL rednecks. Clearly, you've not been to any town in Montgomery County... Seven Lakes is less than 20 minutes from Aberdeen, by the way - and is less" redneck than Pinehurst- Com'on, now.
Rankings for Aberdeen in North Carolina


Locations Around Aberdeen
Map Of Aberdeen, NC
Best Places Around Aberdeen
Holly Springs, NC
Population 43,429
Fuquay-Varina, NC
Population 37,749
Pinehurst, NC
Population 17,992
Fayetteville, NC
Population 209,692
Hope Mills, NC
Population 17,823
Southern Pines, NC
Population 16,052
Asheboro, NC
Population 27,353
Albemarle, NC
Population 16,527
Laurinburg, NC
Population 15,079
Aberdeen Demographics And Statistics
Population over time in Aberdeen
The current population in Aberdeen is 8,969. The population has increased 52.4% from 2010.
| Year | Population | % Change |
|---|---|---|
| 2023 | 8,969 | 3.4% |
| 2022 | 8,674 | 4.1% |
| 2021 | 8,333 | 6.0% |
| 2020 | 7,862 | 3.5% |
| 2019 | 7,595 | 2.4% |
| 2018 | 7,419 | 2.1% |
| 2017 | 7,265 | 2.2% |
| 2016 | 7,107 | 2.8% |
| 2015 | 6,914 | 3.2% |
| 2014 | 6,702 | 2.8% |
| 2013 | 6,520 | 3.3% |
| 2012 | 6,311 | 3.4% |
| 2011 | 6,102 | 3.7% |
| 2010 | 5,884 | - |
Race / Ethnicity in Aberdeen
Aberdeen is:
65.6% White with 5,881 White residents.
21.1% African American with 1,891 African American residents.
0.6% American Indian with 56 American Indian residents.
3.7% Asian with 335 Asian residents.
1.2% Hawaiian with 109 Hawaiian residents.
0.0% Other with 0 Other residents.
4.7% Two Or More with 418 Two Or More residents.
3.1% Hispanic with 279 Hispanic residents.
| Race | Aberdeen | NC | USA |
|---|---|---|---|
| White | 65.6% | 60.6% | 58.2% |
| African American | 21.1% | 20.3% | 12.0% |
| American Indian | 0.6% | 0.8% | 0.5% |
| Asian | 3.7% | 3.1% | 5.7% |
| Hawaiian | 1.2% | 0.1% | 0.2% |
| Other | 0.0% | 0.4% | 0.5% |
| Two Or More | 4.7% | 3.7% | 3.9% |
| Hispanic | 3.1% | 10.9% | 19.0% |
Gender in Aberdeen
Aberdeen is 49.4% female with 4,429 female residents.
Aberdeen is 50.6% male with 4,540 male residents.
| Gender | Aberdeen | NC | USA |
|---|---|---|---|
| Female | 49.4% | 51.1% | 50.5% |
| Male | 50.6% | 48.9% | 49.5% |
Highest level of educational attainment in Aberdeen for adults over 25
1.0% of adults in Aberdeen completed < 9th grade.
4.0% of adults in Aberdeen completed 9-12th grade.
21.0% of adults in Aberdeen completed high school / ged.
24.0% of adults in Aberdeen completed some college.
15.0% of adults in Aberdeen completed associate's degree.
22.0% of adults in Aberdeen completed bachelor's degree.
11.0% of adults in Aberdeen completed master's degree.
2.0% of adults in Aberdeen completed professional degree.
0.0% of adults in Aberdeen completed doctorate degree.
| Education | Aberdeen | NC | USA |
|---|---|---|---|
| < 9th Grade | 1.0% | 4.0% | 5.0% |
| 9-12th Grade | 4.0% | 6.0% | 6.0% |
| High School / GED | 21.0% | 25.0% | 26.0% |
| Some College | 24.0% | 20.0% | 19.0% |
| Associate's Degree | 15.0% | 10.0% | 9.0% |
| Bachelor's Degree | 22.0% | 22.0% | 21.0% |
| Master's Degree | 11.0% | 9.0% | 10.0% |
| Professional Degree | 2.0% | 2.0% | 2.0% |
| Doctorate Degree | 0.0% | 2.0% | 2.0% |
Household Income For Aberdeen, North Carolina
4.1% of households in Aberdeen earn Less than $10,000.
4.0% of households in Aberdeen earn $10,000 to $14,999.
9.8% of households in Aberdeen earn $15,000 to $24,999.
7.0% of households in Aberdeen earn $25,000 to $34,999.
11.0% of households in Aberdeen earn $35,000 to $49,999.
16.6% of households in Aberdeen earn $50,000 to $74,999.
16.0% of households in Aberdeen earn $75,000 to $99,999.
17.2% of households in Aberdeen earn $100,000 to $149,999.
8.1% of households in Aberdeen earn $150,000 to $199,999.
6.3% of households in Aberdeen earn $200,000 or more.
| Income | Aberdeen | NC | USA |
|---|---|---|---|
| Less than $10,000 | 4.1% | 5.0% | 4.9% |
| $10,000 to $14,999 | 4.0% | 3.9% | 3.6% |
| $15,000 to $24,999 | 9.8% | 7.6% | 6.6% |
| $25,000 to $34,999 | 7.0% | 7.8% | 6.8% |
| $35,000 to $49,999 | 11.0% | 12.0% | 10.4% |
| $50,000 to $74,999 | 16.6% | 17.0% | 15.7% |
| $75,000 to $99,999 | 16.0% | 13.0% | 12.7% |
| $100,000 to $149,999 | 17.2% | 16.5% | 17.4% |
| $150,000 to $199,999 | 8.1% | 7.8% | 9.3% |
| $200,000 or more | 6.3% | 9.5% | 12.6% |


