Dunn, NC
Demographics And Statistics
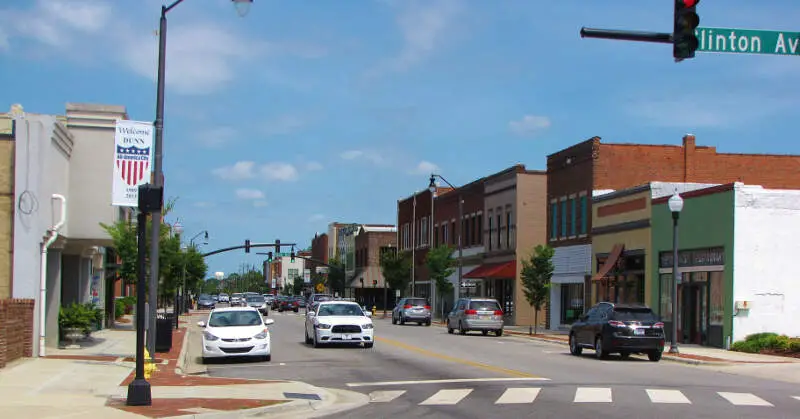
Living In Dunn, North Carolina Summary
Life in Dunn research summary. HomeSnacks has been using Saturday Night Science to research the quality of life in Dunn over the past nine years using Census, FBI, Zillow, and other primary data sources. Based on the most recently available data, we found the following about life in Dunn:
The population in Dunn is 8,512.
The median home value in Dunn is $217,627.
The median income in Dunn is $47,310.
The cost of living in Dunn is 91 which is 0.9x lower than the national average.
The median rent in Dunn is $780.
The unemployment rate in Dunn is 3.4%.
The poverty rate in Dunn is 18.6%.
The average high in Dunn is 72.4° and the average low is 50.2°.
Dunn SnackAbility
Overall SnackAbility
Dunn, NC Crime Report
Crime in Dunn summary. We use data from the FBI to determine the crime rates in Dunn. Key points include:
There were 519 total crimes in Dunn in the last reporting year.
The overall crime rate per 100,000 people in Dunn is 6,011.8 / 100k people.
The violent crime rate per 100,000 people in Dunn is 903.5 / 100k people.
The property crime rate per 100,000 people in Dunn is 5,108.3 / 100k people.
Overall, crime in Dunn is 183.68% above the national average.
Total Crimes
Above National Average
Crime In Dunn Comparison Table
| Statistic | Count Raw |
Dunn / 100k People |
North Carolina / 100k People |
National / 100k People |
|---|---|---|---|---|
| Total Crimes Per 100K | 519 | 6,011.8 | 2,343.9 | 2,119.2 |
| Violent Crime | 78 | 903.5 | 375.8 | 359.0 |
| Murder | 3 | 34.8 | 7.5 | 5.0 |
| Robbery | 10 | 115.8 | 50.2 | 61.0 |
| Aggravated Assault | 59 | 683.4 | 290.1 | 256.0 |
| Property Crime | 441 | 5,108.3 | 1,968.1 | 1,760.0 |
| Burglary | 124 | 1,436.3 | 323.9 | 229.0 |
| Larceny | 285 | 3,301.3 | 1,390.2 | 1,272.0 |
| Car Theft | 32 | 370.7 | 254.1 | 259.0 |
Dunn, NC Cost Of Living
Cost of living in Dunn summary. We use data on the cost of living to determine how expensive it is to live in Dunn. Real estate prices drive most of the variance in cost of living around North Carolina. Key points include:
The cost of living in Dunn is 91 with 100 being average.
The cost of living in Dunn is 0.9x lower than the national average.
The median home value in Dunn is $217,627.
The median income in Dunn is $47,310.
Dunn's Overall Cost Of Living
Lower Than The National Average
Cost Of Living In Dunn Comparison Table
| Living Expense | Dunn | North Carolina | National Average | |
|---|---|---|---|---|
| Overall | 91 | 92 | 100 | |
| Services | 101 | 100 | 100 | |
| Groceries | 96 | 99 | 100 | |
| Health | 112 | 106 | 100 | |
| Housing | 73 | 86 | 100 | |
| Transportation | 93 | 93 | 100 | |
| Utilities | 100 | 95 | 100 | |
Dunn, NC Weather
The average high in Dunn is 72.4° and the average low is 50.2°.
There are 68.2 days of precipitation each year.
Expect an average of 46.6 inches of precipitation each year with 1.9 inches of snow.
| Stat | Dunn |
|---|---|
| Average Annual High | 72.4 |
| Average Annual Low | 50.2 |
| Annual Precipitation Days | 68.2 |
| Average Annual Precipitation | 46.6 |
| Average Annual Snowfall | 1.9 |
Average High
Days of Rain
Dunn, NC Photos
3 Reviews & Comments About Dunn
/5

Alex - None
I live in Dunn lol. Well really in Sampson County but I don't think Dunn is that bad of a place to live. Especially compared to places such as Fayetteville.
JAMES ALLEN - None
Exscue me but I was born in raise in DUNN n c. in it safe town I ever live in
HomeSnacks User - 2019-02-26 20:18:13.207212
Dunn has always been a place that has been "bottom of the barrell" for towns to live in. They have no leaders willing to do what it takes to modernize and bring the town into the 21st century. It's very sad. I can say something because I was raised in Dunn and still live in the area.
Sherry's Bakery has the best donuts!
Rankings for Dunn in North Carolina


Locations Around Dunn
Map Of Dunn, NC
Best Places Around Dunn
Chapel Hill, NC
Population 59,889
Cary, NC
Population 176,686
Apex, NC
Population 67,765
Wake Forest, NC
Population 51,199
Morrisville, NC
Population 30,471
Holly Springs, NC
Population 43,429
Raleigh, NC
Population 470,763
Garner, NC
Population 32,543
Knightdale, NC
Population 19,532
Fuquay-Varina, NC
Population 37,749
Dunn Demographics And Statistics
Population over time in Dunn
The current population in Dunn is 8,512. The population has decreased -6.7% from 2010.
| Year | Population | % Change |
|---|---|---|
| 2023 | 8,512 | -0.4% |
| 2022 | 8,549 | -0.8% |
| 2021 | 8,616 | -11.5% |
| 2020 | 9,738 | 0.8% |
| 2019 | 9,664 | 0.3% |
| 2018 | 9,635 | -0.2% |
| 2017 | 9,657 | -1.1% |
| 2016 | 9,762 | 1.1% |
| 2015 | 9,654 | 0.9% |
| 2014 | 9,570 | 1.0% |
| 2013 | 9,473 | 1.8% |
| 2012 | 9,310 | 0.3% |
| 2011 | 9,278 | 1.7% |
| 2010 | 9,123 | - |
Race / Ethnicity in Dunn
Dunn is:
49.5% White with 4,212 White residents.
34.6% African American with 2,944 African American residents.
0.5% American Indian with 42 American Indian residents.
0.5% Asian with 41 Asian residents.
0.0% Hawaiian with 0 Hawaiian residents.
0.3% Other with 27 Other residents.
2.4% Two Or More with 208 Two Or More residents.
12.2% Hispanic with 1,038 Hispanic residents.
| Race | Dunn | NC | USA |
|---|---|---|---|
| White | 49.5% | 60.6% | 58.2% |
| African American | 34.6% | 20.3% | 12.0% |
| American Indian | 0.5% | 0.8% | 0.5% |
| Asian | 0.5% | 3.1% | 5.7% |
| Hawaiian | 0.0% | 0.1% | 0.2% |
| Other | 0.3% | 0.4% | 0.5% |
| Two Or More | 2.4% | 3.7% | 3.9% |
| Hispanic | 12.2% | 10.9% | 19.0% |
Gender in Dunn
Dunn is 57.0% female with 4,856 female residents.
Dunn is 43.0% male with 3,656 male residents.
| Gender | Dunn | NC | USA |
|---|---|---|---|
| Female | 57.0% | 51.1% | 50.5% |
| Male | 43.0% | 48.9% | 49.5% |
Highest level of educational attainment in Dunn for adults over 25
3.0% of adults in Dunn completed < 9th grade.
8.0% of adults in Dunn completed 9-12th grade.
36.0% of adults in Dunn completed high school / ged.
22.0% of adults in Dunn completed some college.
9.0% of adults in Dunn completed associate's degree.
14.0% of adults in Dunn completed bachelor's degree.
6.0% of adults in Dunn completed master's degree.
2.0% of adults in Dunn completed professional degree.
0.0% of adults in Dunn completed doctorate degree.
| Education | Dunn | NC | USA |
|---|---|---|---|
| < 9th Grade | 3.0% | 4.0% | 5.0% |
| 9-12th Grade | 8.0% | 6.0% | 6.0% |
| High School / GED | 36.0% | 25.0% | 26.0% |
| Some College | 22.0% | 20.0% | 19.0% |
| Associate's Degree | 9.0% | 10.0% | 9.0% |
| Bachelor's Degree | 14.0% | 22.0% | 21.0% |
| Master's Degree | 6.0% | 9.0% | 10.0% |
| Professional Degree | 2.0% | 2.0% | 2.0% |
| Doctorate Degree | 0.0% | 2.0% | 2.0% |
Household Income For Dunn, North Carolina
5.5% of households in Dunn earn Less than $10,000.
9.2% of households in Dunn earn $10,000 to $14,999.
9.5% of households in Dunn earn $15,000 to $24,999.
14.4% of households in Dunn earn $25,000 to $34,999.
15.0% of households in Dunn earn $35,000 to $49,999.
17.4% of households in Dunn earn $50,000 to $74,999.
9.4% of households in Dunn earn $75,000 to $99,999.
13.8% of households in Dunn earn $100,000 to $149,999.
1.6% of households in Dunn earn $150,000 to $199,999.
4.3% of households in Dunn earn $200,000 or more.
| Income | Dunn | NC | USA |
|---|---|---|---|
| Less than $10,000 | 5.5% | 5.0% | 4.9% |
| $10,000 to $14,999 | 9.2% | 3.9% | 3.6% |
| $15,000 to $24,999 | 9.5% | 7.6% | 6.6% |
| $25,000 to $34,999 | 14.4% | 7.8% | 6.8% |
| $35,000 to $49,999 | 15.0% | 12.0% | 10.4% |
| $50,000 to $74,999 | 17.4% | 17.0% | 15.7% |
| $75,000 to $99,999 | 9.4% | 13.0% | 12.7% |
| $100,000 to $149,999 | 13.8% | 16.5% | 17.4% |
| $150,000 to $199,999 | 1.6% | 7.8% | 9.3% |
| $200,000 or more | 4.3% | 9.5% | 12.6% |


