Compare Durham to…
Durham SnackAbility
Overall SnackAbility
Crime in Durham summary. We use data from the FBI to determine the crime rates in Durham. Key points include:
There were 13,266 total crimes in Durham in the last reporting year.
The overall crime rate per 100,000 people in Durham is 4,418.9 / 100k people.
The violent crime rate per 100,000 people in Durham is 619.2 / 100k people.
The property crime rate per 100,000 people in Durham is 3,799.7 / 100k people.
Overall, crime in Durham is 108.52% above the national average.
Total Crimes
Above National Average
Crime In Durham Comparison Table
| Statistic | Count Raw |
Durham / 100k People |
North Carolina / 100k People |
National / 100k People |
|---|---|---|---|---|
| Total Crimes Per 100K | 13,266 | 4,418.9 | 2,343.9 | 2,119.2 |
| Violent Crime | 1,859 | 619.2 | 375.8 | 359.0 |
| Murder | 37 | 12.3 | 7.5 | 5.0 |
| Robbery | 483 | 160.9 | 50.2 | 61.0 |
| Aggravated Assault | 1,167 | 388.7 | 290.1 | 256.0 |
| Property Crime | 11,407 | 3,799.7 | 1,968.1 | 1,760.0 |
| Burglary | 1,352 | 450.4 | 323.9 | 229.0 |
| Larceny | 8,182 | 2,725.4 | 1,390.2 | 1,272.0 |
| Car Theft | 1,873 | 623.9 | 254.1 | 259.0 |
Source: FBI Uniform Crime Reporting (2024)
Cost of living in Durham summary. We use data on the cost of living to determine how expensive it is to live in Durham. Real estate prices drive most of the variance in cost of living around North Carolina. Key points include:
The cost of living in Durham is 111 with 100 being average.
The cost of living in Durham is 1.1x higher than the national average.
The median home value in Durham is $396,394.
The median income in Durham is $81,619.
Durham's Overall Cost Of Living
Higher Than The National Average
Cost Of Living In Durham Comparison Table
| Living Expense | Durham | North Carolina | National Average |
|---|---|---|---|
| Overall | 111 | 95 | 100 |
| Services | 103 | 98 | 100 |
| Groceries | 100 | 98 | 100 |
| Health | 129 | 89 | 100 |
| Housing | 103 | 100 | 100 |
| Transportation | 103 | 97 | 100 |
| Utilities | 106 | 101 | 100 |
Source: Cost of living index, normalized to US average = 100
Durham, NC Weather
The average high in Durham is 70.7° and the average low is 47.7°.
There are 74.3 days of precipitation each year.
Expect an average of 45.5 inches of precipitation each year with 3.5 inches of snow.
| Stat | Durham |
|---|---|
| Average Annual High | 70.7 |
| Average Annual Low | 47.7 |
| Annual Precipitation Days | 74.3 |
| Average Annual Precipitation | 45.5 |
| Average Annual Snowfall | 3.5 |
Average High
Days of Rain
Source: NOAA climate normals (30-year)
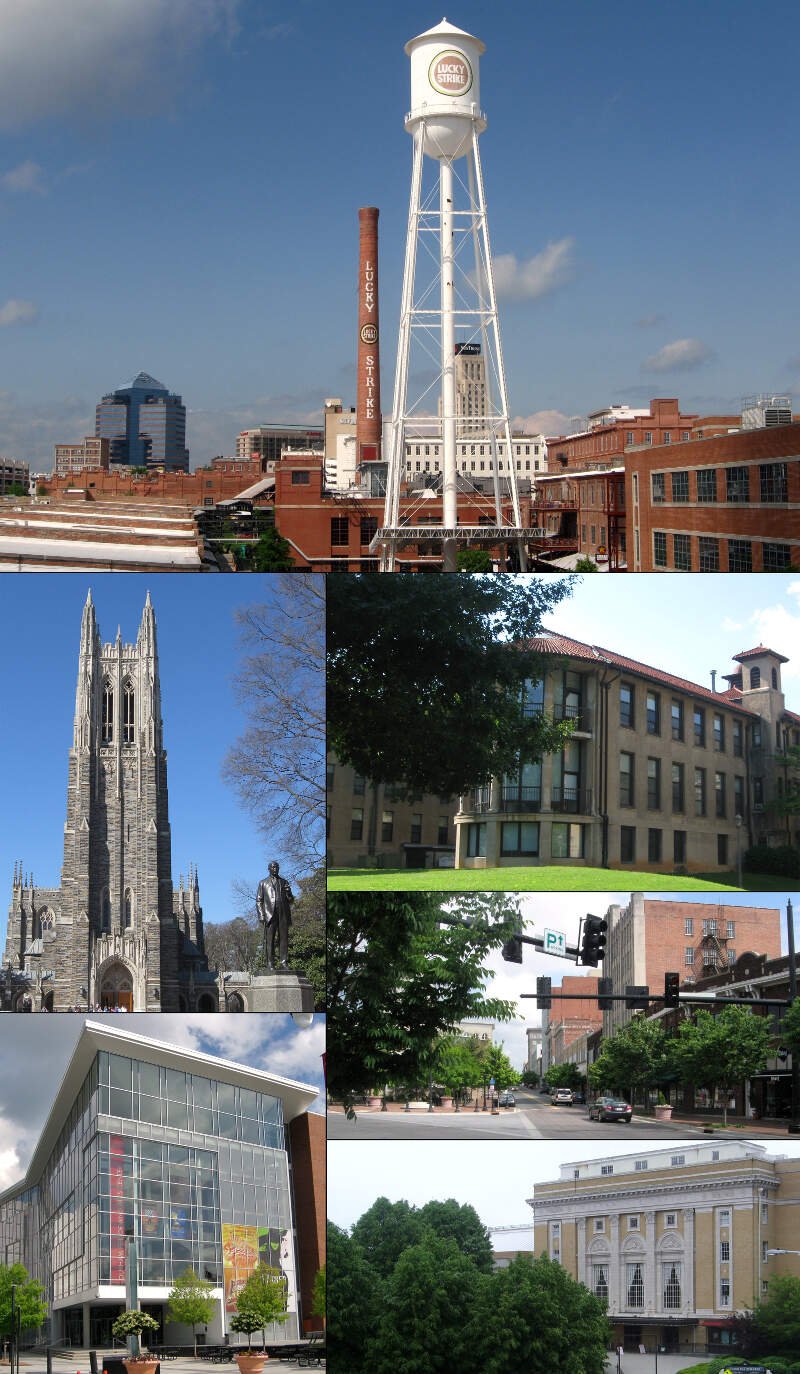
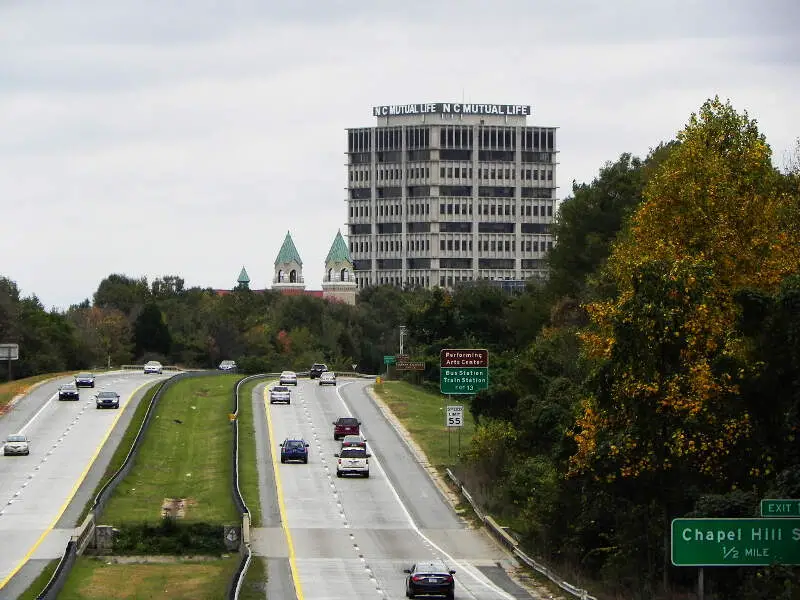
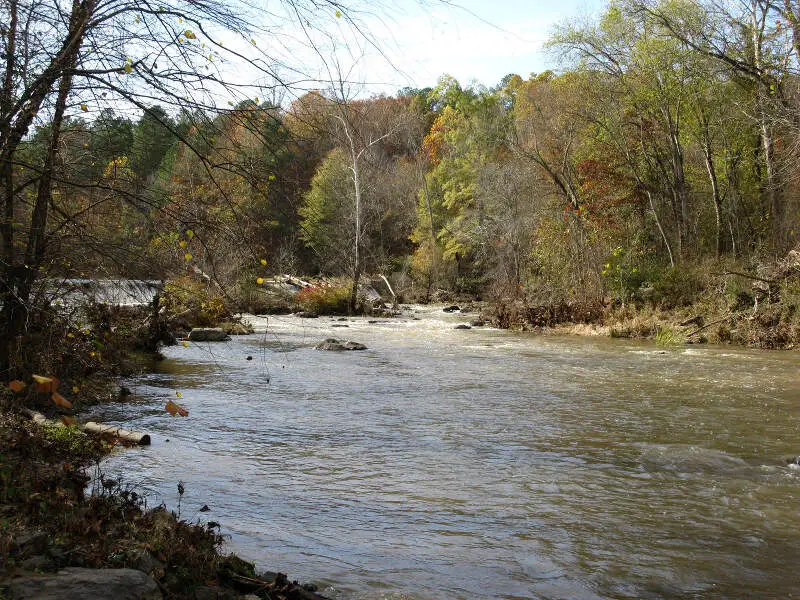
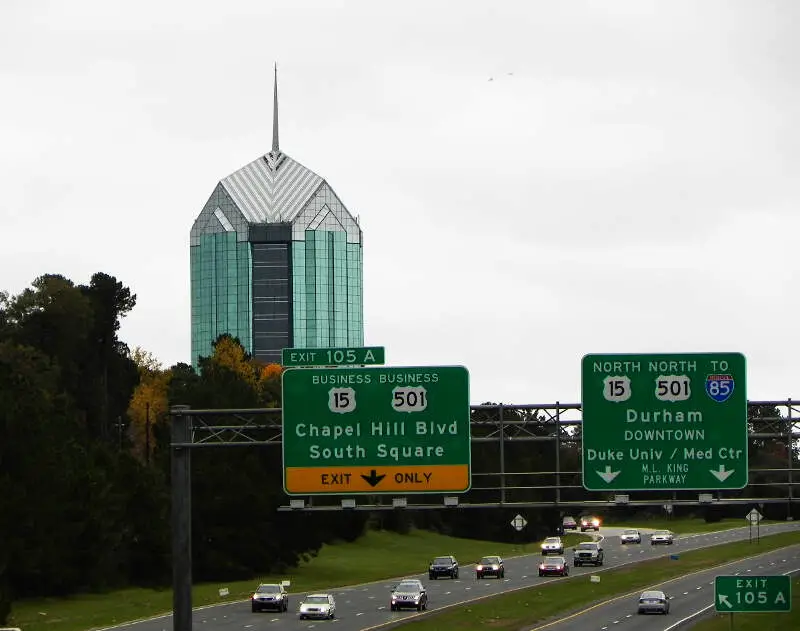
Durham, NC Photos


4 Reviews & Comments About Durham

I live n Durham. Most of it is fishy. And I'm from,ny !,!,!, but oh boy downtown about to start booming. But the high schools. No way
Durham has been a great place to live for the past 5 years.
There are two clear sections to it from my perspective, downtown and mid-burbs.
Downtown you can walk to everything and they are building it up like crazy.
The mid-burbs are still part of Durham, feel like the suburbs, not walking friendly, but safer and more kid friendly.
You can always park wherever you drive, so it's more of a lifestyle choice than anything else.
Durham is a small city with big city dreams. Fantastic restaurants and museums, lots of local flavor and passion, and a beautiful landscape.
Check out the museums, all of the musical venues, and the great outdoor amenities like the Eno River and the Tobacco Trail.
My son lives in Durham and his home has been broken into 3 times, he has had bullets come thru his window and the police tell him he's in the better part of that area. The bullets came from several blocks over where they have constant gun violence, he's west of Briar Creek area. I lived in Durham where you can't even leave a plant on the porch without it being stolen.
Rankings & Articles For Durham


Locations Around Durham
Map Of Durham, NC
Best Places Around Durham
Chapel Hill, NC
Population 61,607
Cary, NC
Population 179,306
Apex, NC
Population 70,630
Morrisville, NC
Population 31,422
Carrboro, NC
Population 21,204
Raleigh, NC
Population 481,031
Hillsborough, NC
Population 9,724
Butner, NC
Population 8,065
Durham Demographics And Statistics
Population over time in Durham
The current population in Durham is 291,467. The population has increased 32.3% from 2010.
| Year | Population | % Change |
|---|---|---|
| 2024 | 291,467 | 1.0% |
| 2023 | 288,465 | 1.5% |
| 2022 | 284,094 | 1.8% |
| 2021 | 279,106 | 1.0% |
| 2020 | 276,341 | 2.5% |
| 2019 | 269,702 | 2.0% |
| 2018 | 264,310 | 2.8% |
| 2017 | 257,232 | 2.2% |
| 2016 | 251,761 | 2.3% |
| 2015 | 246,084 | 2.5% |
| 2014 | 240,107 | 2.2% |
| 2013 | 234,922 | 2.2% |
| 2012 | 229,963 | 2.2% |
| 2011 | 224,930 | 2.1% |
| 2010 | 220,324 | - |
Race / Ethnicity in Durham
See the full breakdown
Durham is:
40.3% White with 117,487 White residents.
33.2% African American with 96,808 African American residents.
0.2% American Indian with 667 American Indian residents.
5.8% Asian with 16,949 Asian residents.
0.0% Hawaiian with 118 Hawaiian residents.
0.5% Other with 1,463 Other residents.
4.7% Two Or More with 13,715 Two Or More residents.
15.2% Hispanic with 44,260 Hispanic residents.
| Race | Durham | NC | USA |
|---|---|---|---|
| White | 40.3% | 60.0% | 57.4% |
| African American | 33.2% | 20.0% | 11.9% |
| American Indian | 0.2% | 0.8% | 0.5% |
| Asian | 5.8% | 3.3% | 5.9% |
| Hawaiian | 0.0% | 0.1% | 0.2% |
| Other | 0.5% | 0.5% | 0.6% |
| Two Or More | 4.7% | 4.1% | 4.3% |
| Hispanic | 15.2% | 11.3% | 19.3% |
Gender in Durham
See the full breakdown
Durham is 52.9% female with 154,315 female residents.
Durham is 47.1% male with 137,152 male residents.
| Gender | Durham | NC | USA |
|---|---|---|---|
| Female | 52.9% | 51.1% | 50.5% |
| Male | 47.1% | 48.9% | 49.5% |
Highest level of educational attainment in Durham for adults over 25
See the full breakdown
4.0% of adults in Durham completed < 9th grade.
4.0% of adults in Durham completed 9-12th grade.
15.0% of adults in Durham completed high school / ged.
13.0% of adults in Durham completed some college.
7.0% of adults in Durham completed associate's degree.
30.0% of adults in Durham completed bachelor's degree.
17.0% of adults in Durham completed master's degree.
5.0% of adults in Durham completed professional degree.
5.0% of adults in Durham completed doctorate degree.
| Education | Durham | NC | USA |
|---|---|---|---|
| < 9th Grade | 4.0% | 3.0% | 4.0% |
| 9-12th Grade | 4.0% | 6.0% | 6.0% |
| High School / GED | 15.0% | 25.0% | 26.0% |
| Some College | 13.0% | 20.0% | 19.0% |
| Associate's Degree | 7.0% | 10.0% | 9.0% |
| Bachelor's Degree | 30.0% | 22.0% | 22.0% |
| Master's Degree | 17.0% | 10.0% | 10.0% |
| Professional Degree | 5.0% | 2.0% | 2.0% |
| Doctorate Degree | 5.0% | 2.0% | 2.0% |
Household Income For Durham, North Carolina
See the full breakdown
4.7% of households in Durham earn Less than $10,000.
2.6% of households in Durham earn $10,000 to $14,999.
5.5% of households in Durham earn $15,000 to $24,999.
5.9% of households in Durham earn $25,000 to $34,999.
10.2% of households in Durham earn $35,000 to $49,999.
16.6% of households in Durham earn $50,000 to $74,999.
12.9% of households in Durham earn $75,000 to $99,999.
17.9% of households in Durham earn $100,000 to $149,999.
10.1% of households in Durham earn $150,000 to $199,999.
13.6% of households in Durham earn $200,000 or more.
| Income | Durham | NC | USA |
|---|---|---|---|
| Less than $10,000 | 4.7% | 5.0% | 5.0% |
| $10,000 to $14,999 | 2.6% | 3.7% | 3.4% |
| $15,000 to $24,999 | 5.5% | 7.1% | 6.3% |
| $25,000 to $34,999 | 5.9% | 7.4% | 6.6% |
| $35,000 to $49,999 | 10.2% | 11.7% | 10.1% |
| $50,000 to $74,999 | 16.6% | 16.8% | 15.5% |
| $75,000 to $99,999 | 12.9% | 13.0% | 12.6% |
| $100,000 to $149,999 | 17.9% | 16.6% | 17.5% |
| $150,000 to $199,999 | 10.1% | 8.3% | 9.6% |
| $200,000 or more | 13.6% | 10.4% | 13.4% |
Source: U.S. Census ACS 5-year estimates (2024)


