Matthews, NC
Demographics And Statistics
Living In Matthews, North Carolina Summary
Life in Matthews research summary. HomeSnacks has been using Saturday Night Science to research the quality of life in Matthews over the past nine years using Census, FBI, Zillow, and other primary data sources. Based on the most recently available data, we found the following about life in Matthews:
The population in Matthews is 29,959.
The median home value in Matthews is $497,609.
The median income in Matthews is $105,579.
The cost of living in Matthews is 113 which is 1.1x higher than the national average.
The median rent in Matthews is $1,670.
The unemployment rate in Matthews is 2.2%.
The poverty rate in Matthews is 4.0%.
The average high in Matthews is 71.4° and the average low is 50.3°.
Matthews SnackAbility
Overall SnackAbility
Matthews, NC Crime Report
Crime in Matthews summary. We use data from the FBI to determine the crime rates in Matthews. Key points include:
There were 892 total crimes in Matthews in the last reporting year.
The overall crime rate per 100,000 people in Matthews is 2,838.8 / 100k people.
The violent crime rate per 100,000 people in Matthews is 184.6 / 100k people.
The property crime rate per 100,000 people in Matthews is 2,654.2 / 100k people.
Overall, crime in Matthews is 33.95% above the national average.
Total Crimes
Above National Average
Crime In Matthews Comparison Table
| Statistic | Count Raw |
Matthews / 100k People |
North Carolina / 100k People |
National / 100k People |
|---|---|---|---|---|
| Total Crimes Per 100K | 892 | 2,838.8 | 2,343.9 | 2,119.2 |
| Violent Crime | 58 | 184.6 | 375.8 | 359.0 |
| Murder | 0 | 0.0 | 7.5 | 5.0 |
| Robbery | 20 | 63.6 | 50.2 | 61.0 |
| Aggravated Assault | 32 | 101.8 | 290.1 | 256.0 |
| Property Crime | 834 | 2,654.2 | 1,968.1 | 1,760.0 |
| Burglary | 110 | 350.1 | 323.9 | 229.0 |
| Larceny | 666 | 2,119.5 | 1,390.2 | 1,272.0 |
| Car Theft | 58 | 184.6 | 254.1 | 259.0 |
Matthews, NC Cost Of Living
Cost of living in Matthews summary. We use data on the cost of living to determine how expensive it is to live in Matthews. Real estate prices drive most of the variance in cost of living around North Carolina. Key points include:
The cost of living in Matthews is 113 with 100 being average.
The cost of living in Matthews is 1.1x higher than the national average.
The median home value in Matthews is $497,609.
The median income in Matthews is $105,579.
Matthews's Overall Cost Of Living
Higher Than The National Average
Cost Of Living In Matthews Comparison Table
| Living Expense | Matthews | North Carolina | National Average | |
|---|---|---|---|---|
| Overall | 113 | 92 | 100 | |
| Services | 103 | 100 | 100 | |
| Groceries | 102 | 99 | 100 | |
| Health | 112 | 106 | 100 | |
| Housing | 148 | 86 | 100 | |
| Transportation | 94 | 93 | 100 | |
| Utilities | 90 | 95 | 100 | |
Matthews, NC Weather
The average high in Matthews is 71.4° and the average low is 50.3°.
There are 73.3 days of precipitation each year.
Expect an average of 44.3 inches of precipitation each year with 2.4 inches of snow.
| Stat | Matthews |
|---|---|
| Average Annual High | 71.4 |
| Average Annual Low | 50.3 |
| Annual Precipitation Days | 73.3 |
| Average Annual Precipitation | 44.3 |
| Average Annual Snowfall | 2.4 |
Average High
Days of Rain
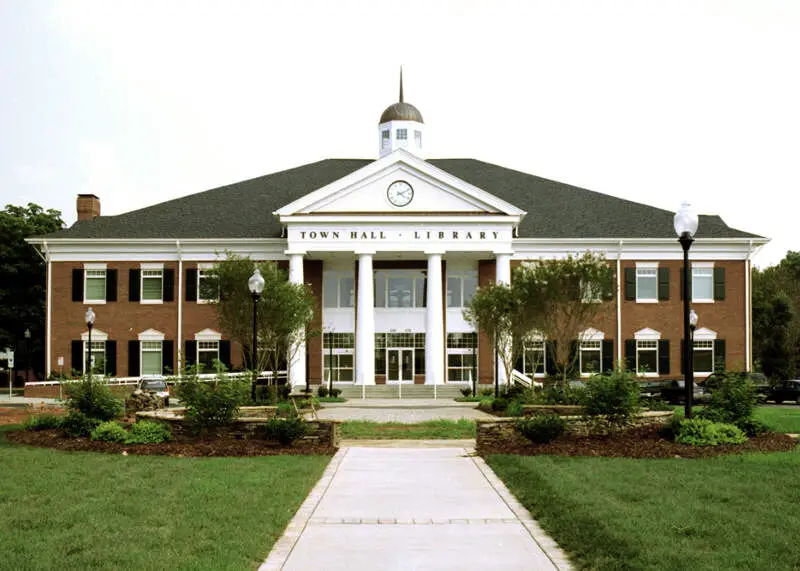
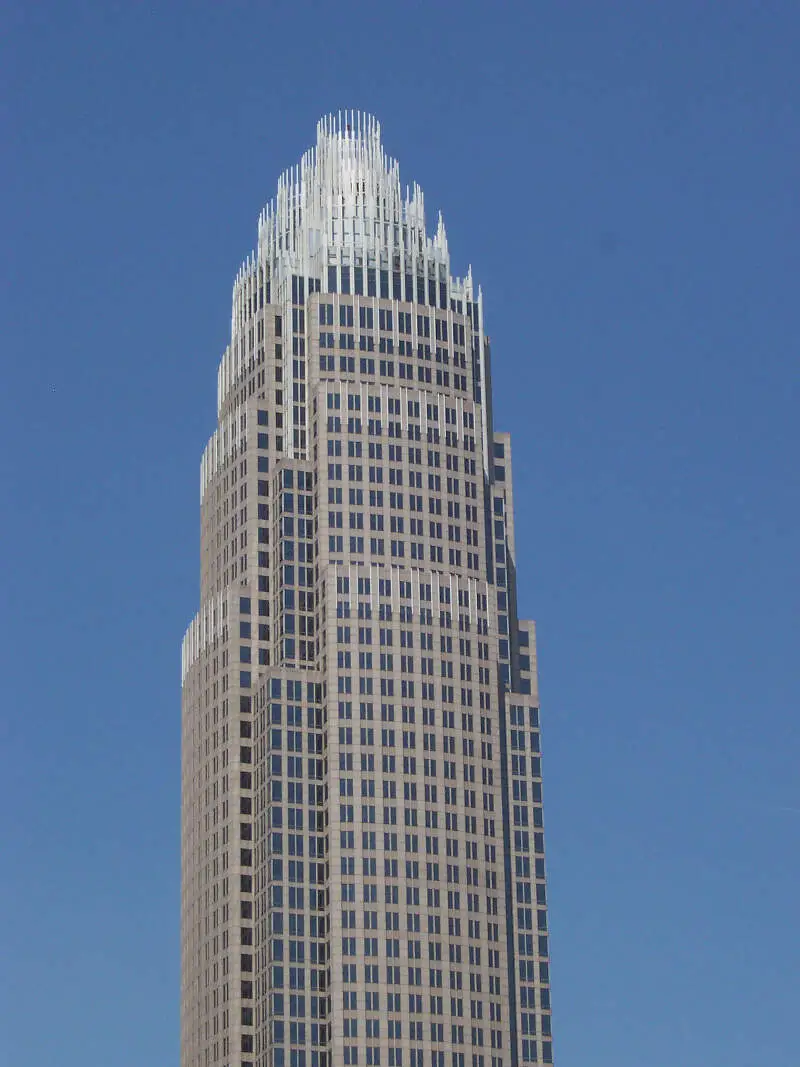
Matthews, NC Photos
Rankings for Matthews in North Carolina


Locations Around Matthews
Map Of Matthews, NC
Best Places Around Matthews
Harrisburg, NC
Population 19,203
Marvin, NC
Population 6,542
Stallings, NC
Population 16,495
Indian Trail, NC
Population 41,146
Wesley Chapel, NC
Population 8,923
Weddington, NC
Population 13,468
Charlotte, NC
Population 886,283
Concord, NC
Population 106,518
Mint Hill, NC
Population 26,954
Unionville, NC
Population 6,826
Matthews Demographics And Statistics
Population over time in Matthews
The current population in Matthews is 29,959. The population has increased 12.8% from 2010.
| Year | Population | % Change |
|---|---|---|
| 2023 | 29,959 | 1.2% |
| 2022 | 29,613 | 0.7% |
| 2021 | 29,417 | -10.0% |
| 2020 | 32,682 | 2.0% |
| 2019 | 32,044 | 2.1% |
| 2018 | 31,400 | 2.1% |
| 2017 | 30,760 | 2.3% |
| 2016 | 30,054 | 2.4% |
| 2015 | 29,352 | 2.4% |
| 2014 | 28,677 | 2.1% |
| 2013 | 28,079 | 2.0% |
| 2012 | 27,516 | 1.9% |
| 2011 | 27,014 | 1.7% |
| 2010 | 26,556 | - |
Race / Ethnicity in Matthews
Matthews is:
70.3% White with 21,070 White residents.
13.2% African American with 3,962 African American residents.
0.1% American Indian with 33 American Indian residents.
6.1% Asian with 1,827 Asian residents.
0.0% Hawaiian with 0 Hawaiian residents.
0.4% Other with 131 Other residents.
3.7% Two Or More with 1,094 Two Or More residents.
6.1% Hispanic with 1,842 Hispanic residents.
| Race | Matthews | NC | USA |
|---|---|---|---|
| White | 70.3% | 60.6% | 58.2% |
| African American | 13.2% | 20.3% | 12.0% |
| American Indian | 0.1% | 0.8% | 0.5% |
| Asian | 6.1% | 3.1% | 5.7% |
| Hawaiian | 0.0% | 0.1% | 0.2% |
| Other | 0.4% | 0.4% | 0.5% |
| Two Or More | 3.7% | 3.7% | 3.9% |
| Hispanic | 6.1% | 10.9% | 19.0% |
Gender in Matthews
Matthews is 51.4% female with 15,386 female residents.
Matthews is 48.6% male with 14,572 male residents.
| Gender | Matthews | NC | USA |
|---|---|---|---|
| Female | 51.4% | 51.1% | 50.5% |
| Male | 48.6% | 48.9% | 49.5% |
Highest level of educational attainment in Matthews for adults over 25
1.0% of adults in Matthews completed < 9th grade.
3.0% of adults in Matthews completed 9-12th grade.
17.0% of adults in Matthews completed high school / ged.
18.0% of adults in Matthews completed some college.
7.0% of adults in Matthews completed associate's degree.
38.0% of adults in Matthews completed bachelor's degree.
12.0% of adults in Matthews completed master's degree.
2.0% of adults in Matthews completed professional degree.
2.0% of adults in Matthews completed doctorate degree.
| Education | Matthews | NC | USA |
|---|---|---|---|
| < 9th Grade | 1.0% | 4.0% | 5.0% |
| 9-12th Grade | 3.0% | 6.0% | 6.0% |
| High School / GED | 17.0% | 25.0% | 26.0% |
| Some College | 18.0% | 20.0% | 19.0% |
| Associate's Degree | 7.0% | 10.0% | 9.0% |
| Bachelor's Degree | 38.0% | 22.0% | 21.0% |
| Master's Degree | 12.0% | 9.0% | 10.0% |
| Professional Degree | 2.0% | 2.0% | 2.0% |
| Doctorate Degree | 2.0% | 2.0% | 2.0% |
Household Income For Matthews, North Carolina
2.1% of households in Matthews earn Less than $10,000.
0.3% of households in Matthews earn $10,000 to $14,999.
2.7% of households in Matthews earn $15,000 to $24,999.
5.1% of households in Matthews earn $25,000 to $34,999.
10.5% of households in Matthews earn $35,000 to $49,999.
15.3% of households in Matthews earn $50,000 to $74,999.
10.3% of households in Matthews earn $75,000 to $99,999.
25.4% of households in Matthews earn $100,000 to $149,999.
12.1% of households in Matthews earn $150,000 to $199,999.
16.3% of households in Matthews earn $200,000 or more.
| Income | Matthews | NC | USA |
|---|---|---|---|
| Less than $10,000 | 2.1% | 5.0% | 4.9% |
| $10,000 to $14,999 | 0.3% | 3.9% | 3.6% |
| $15,000 to $24,999 | 2.7% | 7.6% | 6.6% |
| $25,000 to $34,999 | 5.1% | 7.8% | 6.8% |
| $35,000 to $49,999 | 10.5% | 12.0% | 10.4% |
| $50,000 to $74,999 | 15.3% | 17.0% | 15.7% |
| $75,000 to $99,999 | 10.3% | 13.0% | 12.7% |
| $100,000 to $149,999 | 25.4% | 16.5% | 17.4% |
| $150,000 to $199,999 | 12.1% | 7.8% | 9.3% |
| $200,000 or more | 16.3% | 9.5% | 12.6% |


