
You’re probably never going to make enough money to live in the richest counties in Missouri.
The median household income in St. Charles County, the richest county in Missouri is $102,912, significantly higher than the US median of $74,580, which means based purely on math most people never make enough to live there.
And that’s okay because it’s still fun to look at the people living in the lap of luxury.
So we used Saturday Night Science and the most recent Census to rank home prices and incomes for all 115 counties in the Show Me State. Let’s star gaze together.
Table Of Contents: Top Ten | Methodology | Table | Summary
The 10 Richest Counties In Missouri For 2025
- St. Charles County
- Platte County
- Cass County
- Clay County
- St. Louis County
- Christian County
- Lincoln County
- Warren County
- Jefferson County
- Boone County
What is the richest county in Missouri? The richest county in Missouri is St. Charles County. In contrast, the poorest county in state is Pemiscot County, according to the Census data.
Now you know exactly where to move in Missouri. Keep on reading for more about the top ten and a detailed methodology.
Or, check out the best places to live in Missouri and the cheapest places to live in Missouri.
The Richest Counties In Missouri For 2025
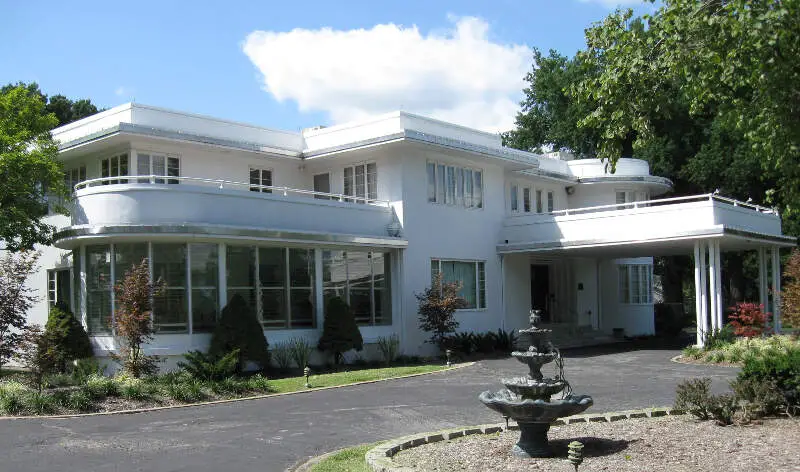
1. St. Charles County
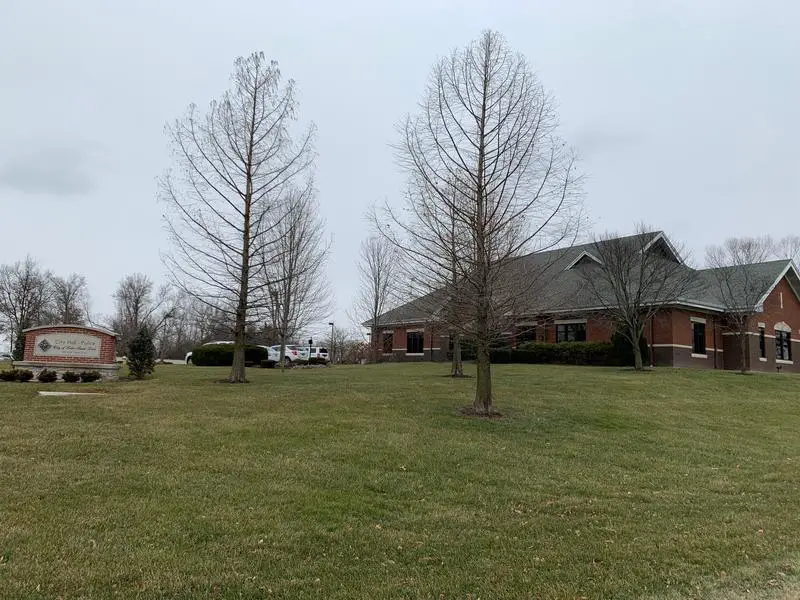
Biggest Place: O’Fallon
Population: 409,830
Median Income: $102,912 (highest)
Median Home Price: $296,800 (2nd highest)
More on St. Charles County:
2. Platte County

Biggest Place: Kansas City
Population: 108,751
Median Income: $95,748 (2nd highest)
Median Home Price: $317,600 (highest)
More on Platte County:
3. Cass County
Biggest Place: Kansas City
Population: 109,393
Median Income: $87,413 (3rd highest)
Median Home Price: $269,000 (4th highest)
More on Cass County:
4. Clay County

Biggest Place: Kansas City
Population: 255,566
Median Income: $86,150 (4th highest)
Median Home Price: $256,400 (6th highest)
More on Clay County:
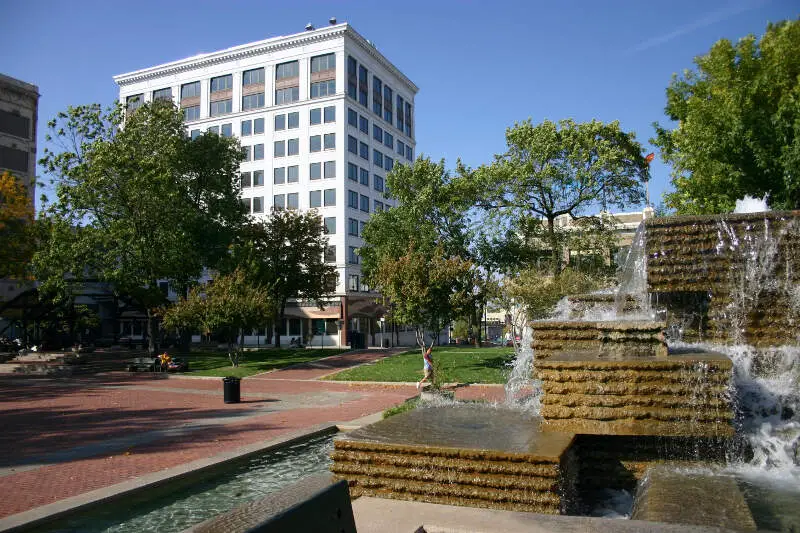
5. St. Louis County

Biggest Place: Florissant
Population: 996,618
Median Income: $81,340 (6th highest)
Median Home Price: $260,700 (5th highest)
More on St. Louis County:
6. Christian County
Biggest Place: Springfield
Population: 91,229
Median Income: $81,245 (7th highest)
Median Home Price: $249,700 (8th highest)
More on Christian County:
7. Lincoln County
Biggest Place: Troy
Population: 61,636
Median Income: $85,276 (5th highest)
Median Home Price: $224,800 (11th highest)
More on Lincoln County:
8. Warren County
Biggest Place: Warrenton
Population: 36,467
Median Income: $77,989 (10th highest)
Median Home Price: $241,200 (9th highest)
More on Warren County:
9. Jefferson County

Biggest Place: Arnold
Population: 228,227
Median Income: $80,522 (8th highest)
Median Home Price: $218,800 (14th highest)
More on Jefferson County:
10. Boone County
Biggest Place: Columbia
Population: 185,874
Median Income: $69,913 (18th highest)
Median Home Price: $254,100 (7th highest)
More on Boone County:
Methodology: How do you determine which Missouri county is the richest?
To determine the richest county in Missouri, we have to look at a handful of metrics that correlate with how rich people are. To do that, we made assumptions about what makes a county rich. For reference, we are trying to make the kind of argument you’d make at a bar using facts, Saturday Night Science.
With that in mind, we went to the American Community Survey data and Zillow for the most recent reporting period for data on the following:
- Average Home Price
- Median Income
We then ranked each county in Missouri for each of the criteria from one to 115, with one being the richest.
Taking the average rank across the two criteria, we created a Rich Score with the county posting the lowest overall score being the “Richest County In Missouri.”
The result is some of the places with the most expensive real estate and highest earners in the Show Me State.
We updated this article for 2025. This report is our first time ranking the richest counties to live in Missouri. We have also ranked the richest states and richest cities in the United States.
Summary: The Richest Counties In Missouri For 2025
Living in Missouri can vary from one part of the state to the next, with pretty extreme variance in home prices and incomes across counties.
The richest counties in Missouri are St. Charles County, Platte County, Cass County, Clay County, St. Louis County, Christian County, Lincoln County, Warren County, Jefferson County, and Boone County.
Now you know the parts of the state where Goodwill will have the best goodies, and that’s what you came here to learn at the end of the day.
You are welcome.
Here’s a look at the poorest counties in Missouri according to the data:
- Pemiscot County
- Worth County
- Dunklin County
For more Missouri reading, check out:
- Safest Places In Missouri
- Cheapest Places To Live In Missouri
- Best Places To Live In Missouri
- Best Counties To Live In Missouri
Detailed List Of The Richest Counties In Missouri
| Rank | County | Population | Median Income | Average Home Price |
|---|---|---|---|---|
| 1 | St. Charles County | 409,830 | $102,912 | $296,800 |
| 2 | Platte County | 108,751 | $95,748 | $317,600 |
| 3 | Cass County | 109,393 | $87,413 | $269,000 |
| 4 | Clay County | 255,566 | $86,150 | $256,400 |
| 5 | St. Louis County | 996,618 | $81,340 | $260,700 |
| 6 | Christian County | 91,229 | $81,245 | $249,700 |
| 7 | Lincoln County | 61,636 | $85,276 | $224,800 |
| 8 | Warren County | 36,467 | $77,989 | $241,200 |
| 9 | Jefferson County | 228,227 | $80,522 | $218,800 |
| 10 | Boone County | 185,874 | $69,913 | $254,100 |
| 11 | Cole County | 76,924 | $73,273 | $214,400 |
| 12 | Osage County | 13,379 | $75,355 | $205,700 |
| 13 | Franklin County | 105,316 | $71,973 | $214,900 |
| 14 | Webster County | 39,868 | $69,731 | $219,100 |
| 15 | Lafayette County | 32,974 | $79,091 | $200,300 |
| 16 | Camden County | 43,416 | $62,927 | $270,700 |
| 17 | Johnson County | 54,331 | $67,123 | $221,400 |
| 18 | Clinton County | 21,259 | $70,625 | $204,300 |
| 19 | Andrew County | 18,086 | $74,007 | $196,200 |
| 20 | Cape Girardeau County | 82,180 | $68,912 | $208,300 |
| 21 | Callaway County | 44,541 | $72,645 | $196,200 |
| 22 | Jackson County | 717,021 | $67,178 | $213,300 |
| 23 | Ray County | 23,149 | $72,152 | $187,400 |
| 24 | Cooper County | 16,835 | $67,548 | $197,100 |
| 25 | Stone County | 31,697 | $61,323 | $236,500 |
| 26 | Pulaski County | 53,850 | $66,435 | $189,700 |
| 27 | Ste. Genevieve County | 18,551 | $61,310 | $215,600 |
| 28 | Dekalb County | 11,176 | $69,093 | $167,500 |
| 29 | Perry County | 18,947 | $63,356 | $189,400 |
| 30 | Newton County | 59,490 | $64,583 | $175,300 |
| 31 | Maries County | 8,435 | $61,359 | $193,100 |
| 32 | Gasconade County | 14,774 | $65,096 | $168,900 |
| 33 | Moniteau County | 15,303 | $65,161 | $168,300 |
| 34 | Taney County | 56,382 | $58,258 | $203,800 |
| 35 | Montgomery County | 11,422 | $61,042 | $171,300 |
| 36 | Greene County | 301,121 | $57,488 | $203,500 |
| 37 | Marion County | 28,493 | $63,908 | $158,100 |
| 38 | Caldwell County | 8,890 | $62,520 | $156,700 |
| 39 | Pettis County | 43,205 | $60,232 | $161,500 |
| 40 | Polk County | 32,109 | $56,686 | $189,600 |
| 41 | Scotland County | 4,698 | $67,568 | $141,100 |
| 42 | Ralls County | 10,394 | $62,054 | $153,400 |
| 43 | Phelps County | 44,948 | $55,427 | $194,900 |
| 44 | Barry County | 34,831 | $56,611 | $172,900 |
| 45 | Buchanan County | 83,855 | $59,423 | $156,600 |
| 46 | Howard County | 10,141 | $62,628 | $145,300 |
| 47 | St. Louis City | 293,109 | $55,279 | $185,100 |
| 48 | Jasper County | 123,532 | $57,525 | $158,500 |
| 49 | Crawford County | 22,890 | $56,345 | $166,000 |
| 50 | Madison County | 12,665 | $58,435 | $155,900 |
| 51 | Daviess County | 8,449 | $60,665 | $149,200 |
| 52 | Nodaway County | 20,959 | $55,970 | $165,100 |
| 53 | Miller County | 25,081 | $55,172 | $169,800 |
| 54 | Shannon County | 7,137 | $59,000 | $151,000 |
| 55 | Bates County | 16,121 | $57,914 | $154,800 |
| 56 | Adair County | 25,224 | $56,583 | $159,500 |
| 57 | Lawrence County | 38,392 | $55,849 | $159,800 |
| 58 | Scott County | 37,967 | $58,847 | $143,700 |
| 59 | Chariton County | 7,406 | $63,307 | $118,900 |
| 60 | Livingston County | 14,330 | $60,148 | $138,300 |
| 61 | Henry County | 22,194 | $56,621 | $153,500 |
| 62 | Morgan County | 21,430 | $49,663 | $180,400 |
| 63 | Benton County | 19,887 | $52,200 | $164,700 |
| 64 | Bollinger County | 10,591 | $57,286 | $142,400 |
| 65 | Linn County | 11,850 | $61,975 | $117,300 |
| 66 | St. Francois County | 66,864 | $54,813 | $155,100 |
| 67 | Macon County | 15,163 | $58,318 | $127,000 |
| 68 | Douglas County | 11,850 | $49,828 | $164,400 |
| 69 | Pike County | 17,623 | $57,572 | $129,400 |
| 70 | Holt County | 4,254 | $58,516 | $122,300 |
| 71 | Carroll County | 8,459 | $61,712 | $110,500 |
| 72 | Saline County | 23,177 | $56,566 | $139,600 |
| 73 | Howell County | 40,168 | $49,814 | $161,000 |
| 74 | Laclede County | 36,245 | $50,825 | $158,000 |
| 75 | Dent County | 14,506 | $54,306 | $149,700 |
| 76 | Gentry County | 6,224 | $57,458 | $123,000 |
| 77 | Dade County | 7,627 | $49,899 | $157,200 |
| 78 | Dallas County | 17,344 | $53,177 | $151,200 |
| 79 | Randolph County | 24,524 | $55,310 | $141,900 |
| 80 | Cedar County | 14,440 | $45,577 | $162,500 |
| 81 | Atchison County | 5,216 | $59,260 | $100,600 |
| 82 | Mercer County | 3,501 | $60,357 | $95,300 |
| 83 | Vernon County | 19,713 | $54,519 | $136,700 |
| 84 | Audrain County | 24,688 | $56,232 | $121,600 |
| 85 | Putnam County | 4,675 | $56,875 | $111,600 |
| 86 | Stoddard County | 28,547 | $54,067 | $135,400 |
| 87 | Schuyler County | 4,044 | $56,023 | $118,200 |
| 88 | Wright County | 18,722 | $47,304 | $152,300 |
| 89 | Monroe County | 8,672 | $48,299 | $147,400 |
| 90 | Ozark County | 8,773 | $42,329 | $156,400 |
| 91 | Butler County | 42,166 | $49,213 | $138,800 |
| 92 | Barton County | 11,685 | $49,503 | $136,000 |
| 93 | Carter County | 5,269 | $45,083 | $147,600 |
| 94 | St. Clair County | 9,451 | $46,731 | $142,500 |
| 95 | Lewis County | 9,945 | $52,340 | $118,900 |
| 96 | Sullivan County | 5,903 | $55,500 | $103,300 |
| 97 | Washington County | 23,483 | $51,886 | $118,400 |
| 98 | Mcdonald County | 23,492 | $48,145 | $134,100 |
| 99 | Grundy County | 9,822 | $53,839 | $107,000 |
| 100 | Harrison County | 8,198 | $53,364 | $107,400 |