Greenwood, SC
Demographics And Statistics
Living In Greenwood, South Carolina Summary
Life in Greenwood research summary. HomeSnacks has been using Saturday Night Science to research the quality of life in Greenwood over the past nine years using Census, FBI, Zillow, and other primary data sources. Based on the most recently available data, we found the following about life in Greenwood:
The population in Greenwood is 22,527.
The median home value in Greenwood is $183,222.
The median income in Greenwood is $40,253.
The cost of living in Greenwood is 85 which is 0.8x lower than the national average.
The median rent in Greenwood is $826.
The unemployment rate in Greenwood is 6.6%.
The poverty rate in Greenwood is 25.1%.
The average high in Greenwood is 73.5° and the average low is 49.4°.
Greenwood SnackAbility
Overall SnackAbility
Greenwood, SC Crime Report
Crime in Greenwood summary. We use data from the FBI to determine the crime rates in Greenwood. Key points include:
There were 856 total crimes in Greenwood in the last reporting year.
The overall crime rate per 100,000 people in Greenwood is 3,808.2 / 100k people.
The violent crime rate per 100,000 people in Greenwood is 484.9 / 100k people.
The property crime rate per 100,000 people in Greenwood is 3,323.2 / 100k people.
Overall, crime in Greenwood is 79.70% above the national average.
Total Crimes
Above National Average
Crime In Greenwood Comparison Table
| Statistic | Count Raw |
Greenwood / 100k People |
South Carolina / 100k People |
National / 100k People |
|---|---|---|---|---|
| Total Crimes Per 100K | 856 | 3,808.2 | 2,402.5 | 2,119.2 |
| Violent Crime | 109 | 484.9 | 436.7 | 359.0 |
| Murder | 3 | 13.3 | 7.5 | 5.0 |
| Robbery | 13 | 57.8 | 35.1 | 61.0 |
| Aggravated Assault | 79 | 351.5 | 357.1 | 256.0 |
| Property Crime | 747 | 3,323.2 | 1,965.8 | 1,760.0 |
| Burglary | 164 | 729.6 | 282.4 | 229.0 |
| Larceny | 569 | 2,531.4 | 1,468.2 | 1,272.0 |
| Car Theft | 14 | 62.3 | 215.1 | 259.0 |
Greenwood, SC Cost Of Living
Cost of living in Greenwood summary. We use data on the cost of living to determine how expensive it is to live in Greenwood. Real estate prices drive most of the variance in cost of living around South Carolina. Key points include:
The cost of living in Greenwood is 85 with 100 being average.
The cost of living in Greenwood is 0.8x lower than the national average.
The median home value in Greenwood is $183,222.
The median income in Greenwood is $40,253.
Greenwood's Overall Cost Of Living
Lower Than The National Average
Cost Of Living In Greenwood Comparison Table
| Living Expense | Greenwood | South Carolina | National Average | |
|---|---|---|---|---|
| Overall | 85 | 93 | 100 | |
| Services | 104 | 102 | 100 | |
| Groceries | 98 | 97 | 100 | |
| Health | 98 | 92 | 100 | |
| Housing | 58 | 81 | 100 | |
| Transportation | 91 | 92 | 100 | |
| Utilities | 92 | 109 | 100 | |
Greenwood, SC Weather
The average high in Greenwood is 73.5° and the average low is 49.4°.
There are 71.5 days of precipitation each year.
Expect an average of 44.5 inches of precipitation each year with 1.0 inches of snow.
| Stat | Greenwood |
|---|---|
| Average Annual High | 73.5 |
| Average Annual Low | 49.4 |
| Annual Precipitation Days | 71.5 |
| Average Annual Precipitation | 44.5 |
| Average Annual Snowfall | 1.0 |
Average High
Days of Rain
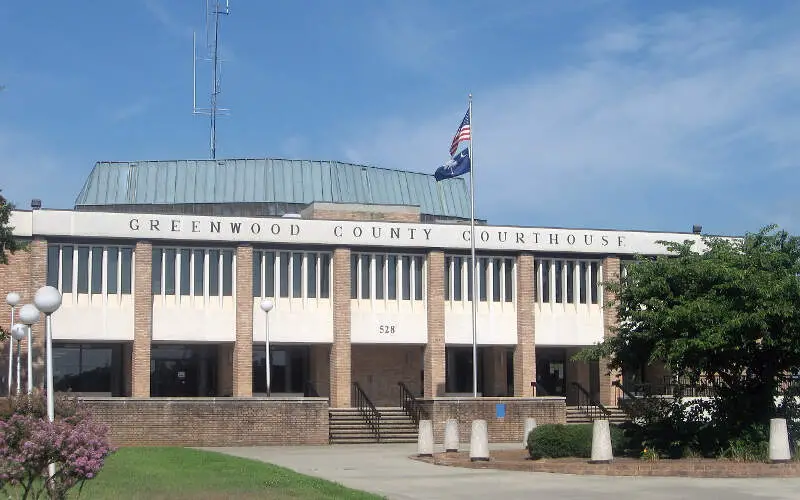
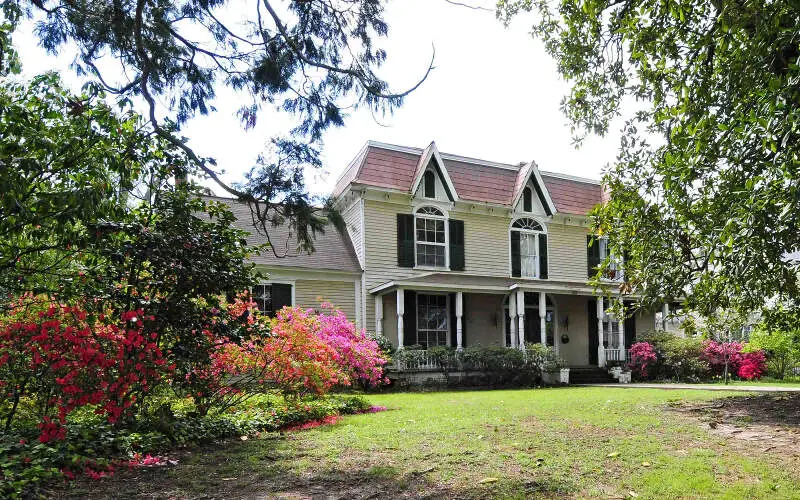
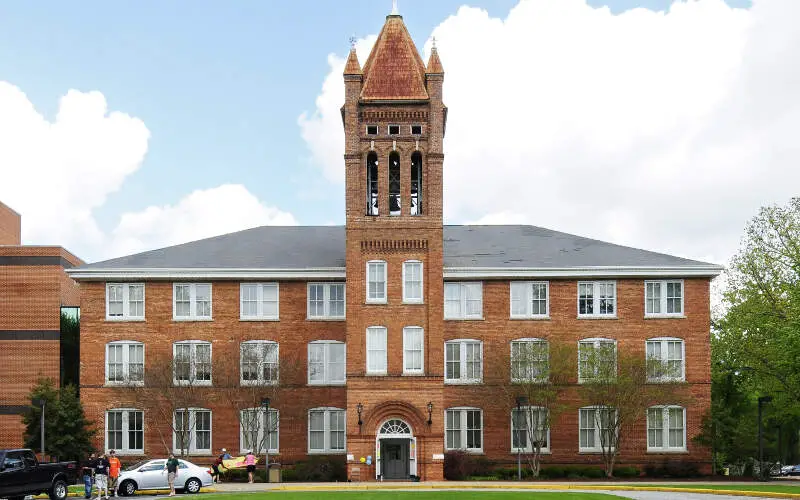
Greenwood, SC Photos
Rankings for Greenwood in South Carolina


Locations Around Greenwood
Map Of Greenwood, SC
Best Places Around Greenwood
Evans, GA
Population 37,718
Martinez, GA
Population 33,019
Five Forks, SC
Population 19,093
Mauldin, SC
Population 25,985
Centerville, SC
Population 6,860
Simpsonville, SC
Population 25,125
Wade Hampton, SC
Population 20,703
Powdersville, SC
Population 11,321
Easley, SC
Population 23,942
Greenville, SC
Population 71,755
Greenwood Demographics And Statistics
Population over time in Greenwood
The current population in Greenwood is 22,527. The population has decreased -1.8% from 2010.
| Year | Population | % Change |
|---|---|---|
| 2023 | 22,527 | -0.0% |
| 2022 | 22,528 | 0.7% |
| 2021 | 22,363 | -4.2% |
| 2020 | 23,351 | 0.4% |
| 2019 | 23,269 | 0.2% |
| 2018 | 23,230 | 0.4% |
| 2017 | 23,148 | -0.5% |
| 2016 | 23,260 | 0.0% |
| 2015 | 23,254 | -0.2% |
| 2014 | 23,296 | -0.2% |
| 2013 | 23,334 | 0.6% |
| 2012 | 23,206 | 0.4% |
| 2011 | 23,108 | 0.7% |
| 2010 | 22,936 | - |
Race / Ethnicity in Greenwood
Greenwood is:
38.6% White with 8,699 White residents.
49.4% African American with 11,122 African American residents.
0.0% American Indian with 0 American Indian residents.
1.5% Asian with 335 Asian residents.
0.0% Hawaiian with 0 Hawaiian residents.
0.8% Other with 183 Other residents.
0.8% Two Or More with 173 Two Or More residents.
8.9% Hispanic with 2,015 Hispanic residents.
| Race | Greenwood | SC | USA |
|---|---|---|---|
| White | 38.6% | 62.2% | 58.2% |
| African American | 49.4% | 25.1% | 12.0% |
| American Indian | 0.0% | 0.2% | 0.5% |
| Asian | 1.5% | 1.7% | 5.7% |
| Hawaiian | 0.0% | 0.1% | 0.2% |
| Other | 0.8% | 0.4% | 0.5% |
| Two Or More | 0.8% | 3.2% | 3.9% |
| Hispanic | 8.9% | 7.1% | 19.0% |
Gender in Greenwood
Greenwood is 54.1% female with 12,189 female residents.
Greenwood is 45.9% male with 10,338 male residents.
| Gender | Greenwood | SC | USA |
|---|---|---|---|
| Female | 54.1% | 51.3% | 50.5% |
| Male | 45.9% | 48.7% | 49.5% |
Highest level of educational attainment in Greenwood for adults over 25
6.0% of adults in Greenwood completed < 9th grade.
11.0% of adults in Greenwood completed 9-12th grade.
39.0% of adults in Greenwood completed high school / ged.
15.0% of adults in Greenwood completed some college.
9.0% of adults in Greenwood completed associate's degree.
13.0% of adults in Greenwood completed bachelor's degree.
6.0% of adults in Greenwood completed master's degree.
1.0% of adults in Greenwood completed professional degree.
0.0% of adults in Greenwood completed doctorate degree.
| Education | Greenwood | SC | USA |
|---|---|---|---|
| < 9th Grade | 6.0% | 4.0% | 5.0% |
| 9-12th Grade | 11.0% | 7.0% | 6.0% |
| High School / GED | 39.0% | 28.0% | 26.0% |
| Some College | 15.0% | 20.0% | 19.0% |
| Associate's Degree | 9.0% | 10.0% | 9.0% |
| Bachelor's Degree | 13.0% | 19.0% | 21.0% |
| Master's Degree | 6.0% | 9.0% | 10.0% |
| Professional Degree | 1.0% | 2.0% | 2.0% |
| Doctorate Degree | 0.0% | 1.0% | 2.0% |
Household Income For Greenwood, South Carolina
8.6% of households in Greenwood earn Less than $10,000.
9.7% of households in Greenwood earn $10,000 to $14,999.
18.5% of households in Greenwood earn $15,000 to $24,999.
8.3% of households in Greenwood earn $25,000 to $34,999.
19.6% of households in Greenwood earn $35,000 to $49,999.
16.6% of households in Greenwood earn $50,000 to $74,999.
8.8% of households in Greenwood earn $75,000 to $99,999.
7.7% of households in Greenwood earn $100,000 to $149,999.
1.0% of households in Greenwood earn $150,000 to $199,999.
1.3% of households in Greenwood earn $200,000 or more.
| Income | Greenwood | SC | USA |
|---|---|---|---|
| Less than $10,000 | 8.6% | 5.9% | 4.9% |
| $10,000 to $14,999 | 9.7% | 4.0% | 3.6% |
| $15,000 to $24,999 | 18.5% | 7.8% | 6.6% |
| $25,000 to $34,999 | 8.3% | 8.0% | 6.8% |
| $35,000 to $49,999 | 19.6% | 12.3% | 10.4% |
| $50,000 to $74,999 | 16.6% | 17.2% | 15.7% |
| $75,000 to $99,999 | 8.8% | 12.9% | 12.7% |
| $100,000 to $149,999 | 7.7% | 16.1% | 17.4% |
| $150,000 to $199,999 | 1.0% | 7.5% | 9.3% |
| $200,000 or more | 1.3% | 8.3% | 12.6% |


