The unfortunate fact of the matter is that some places in the Prairie State have a larger percent of their population that never graduated from high school.
While the emphasis on going to college might be overblown, the fact is that not graduating from high school puts you at a significant disadvantage on average. Educational attainment might not be the best way to measure one person’s intelligence, but it does shine a light on the state.
We will use Saturday Night Science to determine what places in Illinois have the highest percentage of adults without a high school degree.
A recent study we published found that Illinois is the 31st smartest state in the United States, with an average IQ of 99.
But that doesn’t mean that a few cities in Illinois are a bit slower than others due to a lack of basic education.
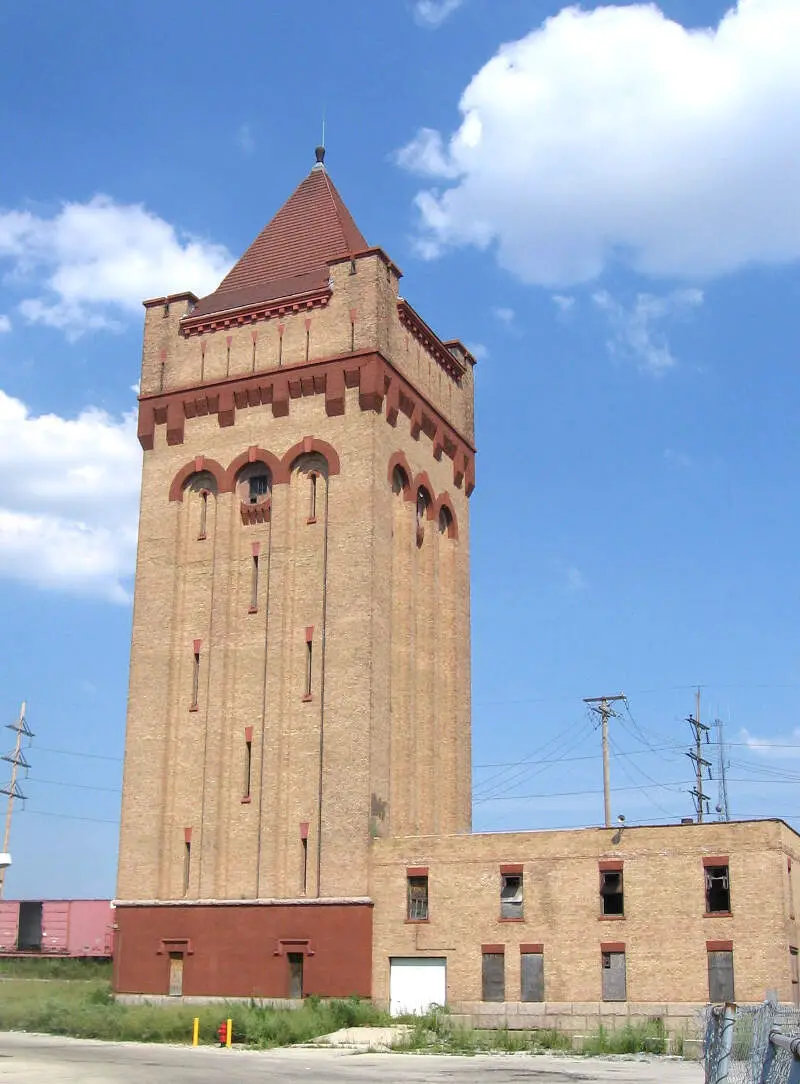
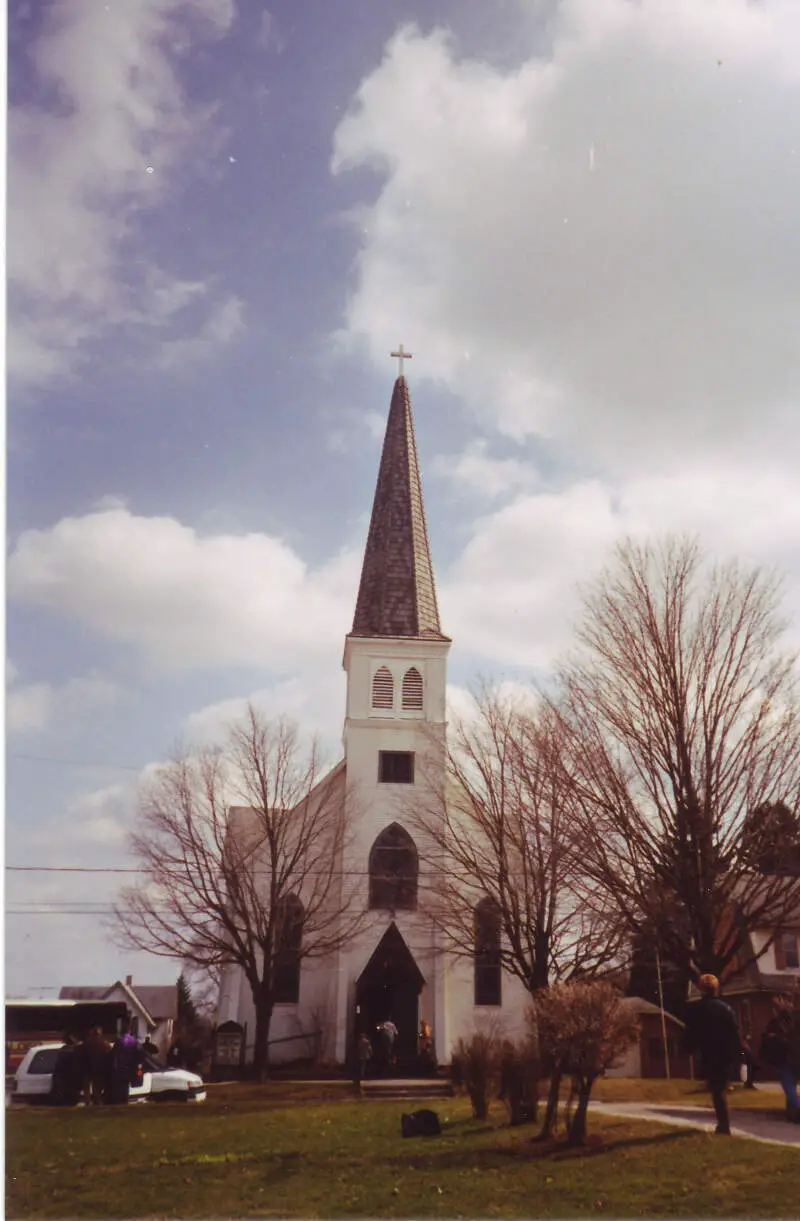
#1 dumbest in Illinois
Cicero is a suburb of Chicago and an incorporated town in Cook County, Illinois, United States. The population was 83,891 at the 2010 census. As of 2013, the town had a total population of 84,103, making it the 11th largest municipality in Illinois. Cicero is named for the town of Cicero, New York, which in turn was named for Marcus Tullius Cicero, the Roman statesman and orator.
Data | Crime | Cost of living | Movers
#2 dumbest in Illinois
Chester is a city in and the county seat of Randolph County, Illinois, United States, on a bluff above the Mississippi River. The population was 8,586 at the 2010 census. It lies 61 miles south of St. Louis, Missouri.
Data | Crime | Cost of living | Movers
#3 dumbest in Illinois
Pinckneyville is a city in and the county seat of Perry County, Illinois, United States. The population was 5,464 at the 2000 census. It is named for Charles Cotesworth Pinckney, an early American diplomat and presidential candidate.
Data | Crime | Cost of living | Movers
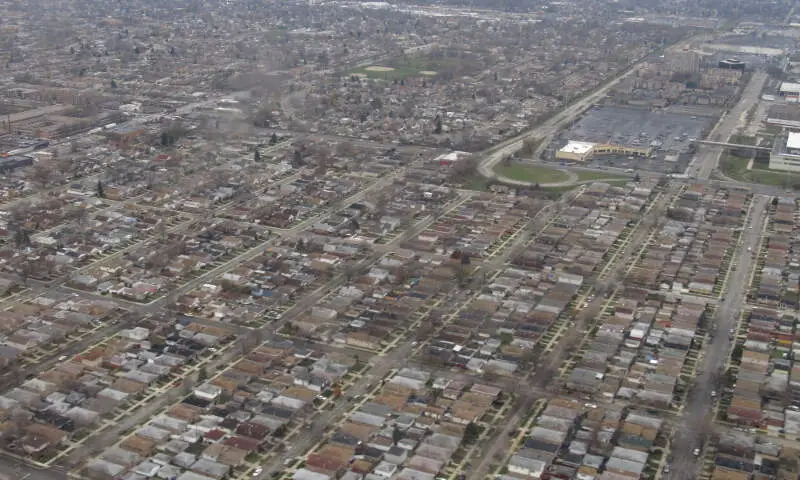
#4 dumbest in Illinois
Harvey is a city in Cook County, Illinois, United States, and a south suburb of Chicago. The population was 25,282 at the 2010 census. The city suffers from high levels of poverty and unemployment. It also suffers from high levels of crime.
Data | Crime | Cost of living | Movers
#5 dumbest in Illinois
Data | Crime | Cost of living | Movers
#6 dumbest in Illinois
Data | Crime | Cost of living | Movers
#7 dumbest in Illinois
Posen is a village in Cook County, Illinois, United States. Posen is the German-language name for the western Polish city of Pozna. The population of the village was 5,987 at the 2010 census, up from 4,730 in 2000.
Data | Crime | Cost of living | Movers
#8 dumbest in Illinois
Data | Crime | Cost of living | Movers
#9 dumbest in Illinois
Belvidere is a city in Boone County, Illinois, United States. The population was 25,585 as of the 2010 census. It is the county seat of Boone County. Belvidere is part of the Rockford, Illinois Metropolitan Statistical Area.
Data | Crime | Cost of living | Movers
#10 dumbest in Illinois
Burbank is a city in Cook County, Illinois, United States. The population was 28,925 at the 2010 census. It is located at the southwest edge of the city of Chicago; the Chicago city limit – specifically that of the Ashburn neighborhood – is in common with Burbank’s eastern city limit. Burbank shares a boundary with Oak Lawn to its south, Bridgeview to its west, and Bedford Park to its north; the city of Hometown is also adjacent to Burbank’s southeast corner. Burbank is less than two miles south of Chicago Midway International Airport.
Data | Crime | Cost of living | Movers
The receipts
Compare the top ten
Pick a metric. The bars rescale. The red line is Illinois’s statewide median.
On the map
Where Illinois’s dumbest cities are
Saturday Night Science
Methodology: How we determined the dumbest cities in the Prairie State
We realize that formal education is only part of it when it comes to being intelligent, but on the other hand, knowing the difference between they’re, their, and there is always going to make you look pretty stupid.
So, we used Saturday Night Science to narrow down our criteria to focus on a city’s educational opportunities and what percentage of the population takes advantage of those opportunities.
In short, we came up with these criteria to determine the dumbest cities in Illinois:
- % of the city’s population with less than a high school education (Age 25+)
- % of city’s population with a college degree (Age 25+)
We got the data from the U.S. Census 2020-2024 American Community Survey.
Then, our algorithm generates a rank for each place in these categories. After crunching all the numbers, a ranking of the cities in Illinois from dumbest to brightest.
For this ranking, we used every Illinois city with at least 5,000 residents. We updated this article for 2026, and it’s our eleventh time ranking the dumbest cities in Illinois.
The full plate
Dumbest Cities In Illinois For 2026
Click any column to sort. Search by city name.
| Rank | City | Population | % Adult High School Dropout | % Highly Educated |
|---|---|---|---|---|
| 1 | Cicero | 82,797 | 33.0% | 10.0% |
| 2 | Chester | 6,797 | 27.0% | 9.0% |
| 3 | Pinckneyville | 5,018 | 29.0% | 12.0% |
| 4 | Harvey | 20,230 | 22.0% | 11.0% |
| 5 | Summit | 10,846 | 32.0% | 14.0% |
| 6 | Northlake | 12,513 | 27.0% | 14.0% |
| 7 | Posen | 5,292 | 20.0% | 12.0% |
| 8 | Round Lake Beach | 27,079 | 25.0% | 15.0% |
| 9 | Belvidere | 24,752 | 21.0% | 13.0% |
| 10 | Burbank | 28,739 | 22.0% | 15.0% |
| 11 | Melrose Park | 24,549 | 30.0% | 16.0% |
| 12 | Kankakee | 23,996 | 18.0% | 13.0% |
| 13 | Round Lake Park | 7,919 | 22.0% | 16.0% |
| 14 | Hillsboro | 5,803 | 16.0% | 13.0% |
| 15 | West Frankfort | 7,118 | 15.0% | 9.0% |
| 16 | Vandalia | 5,796 | 16.0% | 13.0% |
| 17 | Beardstown | 6,169 | 20.0% | 17.0% |
| 18 | Du Quoin | 5,726 | 14.0% | 11.0% |
| 19 | Pontiac | 11,294 | 17.0% | 16.0% |
| 20 | Zion | 24,600 | 16.0% | 15.0% |
| 21 | East St. Louis | 17,999 | 15.0% | 15.0% |
| 22 | Kewanee | 11,913 | 15.0% | 16.0% |
| 23 | Bridgeview | 16,849 | 18.0% | 18.0% |
| 24 | Beach Park | 14,115 | 21.0% | 19.0% |
| 25 | Rock Falls | 8,587 | 13.0% | 13.0% |
| 26 | Streator | 12,330 | 12.0% | 12.0% |
| 27 | Harvard | 9,598 | 18.0% | 18.0% |
| 28 | Broadview | 7,896 | 16.0% | 18.0% |
| 29 | Franklin Park | 18,197 | 22.0% | 20.0% |
| 30 | Maywood | 23,201 | 19.0% | 19.0% |
| 31 | Monmouth | 8,581 | 16.0% | 18.0% |
| 32 | Bellwood | 18,256 | 15.0% | 17.0% |
| 33 | Metropolis | 5,864 | 13.0% | 15.0% |
| 34 | East Alton | 5,689 | 14.0% | 16.0% |
| 35 | Harrisburg | 8,372 | 14.0% | 16.0% |
| 36 | Paris | 8,276 | 15.0% | 17.0% |
| 37 | Waukegan | 89,076 | 24.0% | 21.0% |
| 38 | Bensenville | 18,603 | 20.0% | 20.0% |
| 39 | Blue Island | 21,741 | 20.0% | 20.0% |
| 40 | Rochelle | 9,529 | 15.0% | 18.0% |
| 41 | Lyons | 10,339 | 16.0% | 19.0% |
| 42 | Addison | 35,489 | 25.0% | 23.0% |
| 43 | Pana | 5,217 | 12.0% | 15.0% |
| 44 | Genoa | 5,492 | 12.0% | 15.0% |
| 45 | North Chicago | 30,643 | 18.0% | 21.0% |
| 46 | Berkeley | 5,199 | 14.0% | 18.0% |
| 47 | Canton | 13,144 | 12.0% | 16.0% |
| 48 | Benton | 6,863 | 13.0% | 18.0% |
| 49 | Mendota | 6,994 | 16.0% | 21.0% |
| 50 | Danville | 28,595 | 14.0% | 19.0% |
| 51 | Chicago Heights | 26,736 | 15.0% | 21.0% |
| 52 | Carpentersville | 37,346 | 22.0% | 25.0% |
| 53 | Dixon | 14,910 | 12.0% | 17.0% |
| 54 | Markham | 11,355 | 12.0% | 18.0% |
| 55 | Centralia | 11,856 | 11.0% | 16.0% |
| 56 | Hillside | 8,084 | 18.0% | 24.0% |
| 57 | Worth | 10,700 | 13.0% | 19.0% |
| 58 | Galesburg | 29,481 | 13.0% | 19.0% |
| 59 | Spring Valley | 5,476 | 11.0% | 17.0% |
| 60 | Carlinville | 5,480 | 16.0% | 24.0% |
| 61 | Salem | 7,236 | 9.0% | 15.0% |
| 62 | Steger | 9,418 | 11.0% | 18.0% |
| 63 | Elgin | 114,934 | 19.0% | 27.0% |
| 64 | Riverdale | 10,340 | 10.0% | 17.0% |
| 65 | Rockford | 147,521 | 15.0% | 24.0% |
| 66 | Greenville | 7,235 | 14.0% | 23.0% |
| 67 | Midlothian | 13,948 | 12.0% | 20.0% |
| 68 | Jacksonville | 18,014 | 14.0% | 22.0% |
| 69 | East Moline | 20,904 | 13.0% | 22.0% |
| 70 | Alsip | 18,583 | 11.0% | 19.0% |
| 71 | Crest Hill | 20,628 | 14.0% | 24.0% |
| 72 | Berwyn | 55,595 | 15.0% | 25.0% |
| 73 | Rantoul | 12,421 | 7.0% | 12.0% |
| 74 | LaSalle | 9,498 | 9.0% | 17.0% |
| 75 | Pekin | 31,781 | 9.0% | 18.0% |
| 76 | Jerseyville | 7,445 | 11.0% | 20.0% |
| 77 | Hanover Park | 36,732 | 17.0% | 29.0% |
| 78 | Romeoville | 41,152 | 16.0% | 28.0% |
| 79 | Schiller Park | 11,393 | 14.0% | 26.0% |
| 80 | Joliet | 150,445 | 14.0% | 26.0% |
| 81 | West Chicago | 25,395 | 21.0% | 32.0% |
| 82 | Freeport | 23,505 | 9.0% | 19.0% |
| 83 | Clinton | 6,985 | 10.0% | 20.0% |
| 84 | Mattoon | 16,586 | 10.0% | 20.0% |
| 85 | Machesney Park | 22,630 | 9.0% | 19.0% |
| 86 | Alton | 25,279 | 10.0% | 21.0% |
| 87 | Glendale Heights | 32,808 | 17.0% | 30.0% |
| 88 | Colona | 5,139 | 9.0% | 19.0% |
| 89 | Streamwood | 39,001 | 14.0% | 28.0% |
| 90 | Mount Carmel | 6,854 | 7.0% | 17.0% |
| 91 | Robinson | 7,084 | 12.0% | 26.0% |
| 92 | Stickney | 6,952 | 11.0% | 24.0% |
| 93 | Silvis | 7,955 | 7.0% | 16.0% |
| 94 | Wood River | 10,279 | 6.0% | 15.0% |
| 95 | Justice | 12,324 | 9.0% | 21.0% |
| 96 | Hickory Hills | 14,526 | 11.0% | 25.0% |
| 97 | River Grove | 10,451 | 10.0% | 24.0% |
| 98 | Rock Island | 36,151 | 10.0% | 24.0% |
| 99 | Highwood | 5,301 | 19.0% | 39.0% |
| 100 | Aurora | 179,898 | 17.0% | 38.0% |
Source: U.S. Census ACS 2020-2024. 323 cities with more than 5,000 residents.
Summary
There You Have It – Now That You’re Asleep
If you’re measuring the locations in Illinois where there are a high number of dropouts and adults who never received a formal education, this is an accurate ranking.
The dumbest cities in Illinois are Cicero, Chester, Pinckneyville, Harvey, Summit, Northlake, Posen, Round Lake Beach, Belvidere, and Burbank. Not sold on Illinois? Take the two-minute Find Your Place quiz and see which state actually fits you.
Questions and answers
Dumbest Places In Illinois FAQs
What is the dumbest city in Illinois?
Cicero is the dumbest place in Illinois for 2026, going purely by adult educational attainment. Chester and Pinckneyville are next.
What are the dumbest places in Illinois?
The dumbest places in Illinois are Cicero, Chester, Pinckneyville, Harvey, Summit, Northlake, Posen, Round Lake Beach, Belvidere, and Burbank. We ranked all 323 cities with more than 5,000 residents on adult high-school-dropout and college-degree shares.
Is Illinois a smart state?
Illinois ranks as the 31st smartest state in the country, with an average IQ of 99. City by city, though, the attainment numbers swing a lot — which is what this ranking maps.
What is the smartest place in Illinois?
Western Springs is the smartest place in Illinois by this measure, with the best educational attainment numbers of the 323 cities we ranked.
Does this actually measure how smart people are?
No — it measures schooling, not smarts. The ranking counts adults without a high school diploma and adults with a college degree, straight from Census American Community Survey data, and diplomas are not the same thing as intelligence.


