Streator SnackAbility
Overall SnackAbility
Crime in Streator summary. We use data from the FBI to determine the crime rates in Streator. Key points include:
There were 237 total crimes in Streator in the last reporting year.
The overall crime rate per 100,000 people in Streator is 1,942.1 / 100k people.
The violent crime rate per 100,000 people in Streator is 188.5 / 100k people.
The property crime rate per 100,000 people in Streator is 1,753.7 / 100k people.
Overall, crime in Streator is -8.36% below the national average.
Total Crimes
Below National Average
Crime In Streator Comparison Table
| Statistic | Count Raw |
Streator / 100k People |
Illinois / 100k People |
National / 100k People |
|---|---|---|---|---|
| Total Crimes Per 100K | 237 | 1,942.1 | 2,004.4 | 2,119.2 |
| Violent Crime | 23 | 188.5 | 289.2 | 359.0 |
| Murder | 0 | 0.0 | 5.8 | 5.0 |
| Robbery | 0 | 0.0 | 90.2 | 61.0 |
| Aggravated Assault | 19 | 155.7 | 146.3 | 256.0 |
| Property Crime | 214 | 1,753.7 | 1,715.2 | 1,760.0 |
| Burglary | 36 | 295.0 | 290.5 | 229.0 |
| Larceny | 174 | 1,425.9 | 1,134.4 | 1,272.0 |
| Car Theft | 4 | 32.8 | 290.4 | 259.0 |
Source: FBI Uniform Crime Reporting (2024)
Cost of living in Streator summary. We use data on the cost of living to determine how expensive it is to live in Streator. Real estate prices drive most of the variance in cost of living around Illinois. Key points include:
The cost of living in Streator is 82 with 100 being average.
The cost of living in Streator is 0.8x lower than the national average.
The median home value in Streator is $122,609.
The median income in Streator is $57,609.
Streator's Overall Cost Of Living
Lower Than The National Average
Cost Of Living In Streator Comparison Table
| Living Expense | Streator | Illinois | National Average |
|---|---|---|---|
| Overall | 82 | 98 | 100 |
| Services | 101 | 99 | 100 |
| Groceries | 104 | 99 | 100 |
| Health | 51 | 96 | 100 |
| Housing | 98 | 101 | 100 |
| Transportation | 102 | 99 | 100 |
| Utilities | 93 | 101 | 100 |
Source: Cost of living index, normalized to US average = 100
Streator, IL Weather
The average high in Streator is 60.4° and the average low is 40.3°.
There are 67.6 days of precipitation each year.
Expect an average of 37.5 inches of precipitation each year with 25.3 inches of snow.
| Stat | Streator |
|---|---|
| Average Annual High | 60.4 |
| Average Annual Low | 40.3 |
| Annual Precipitation Days | 67.6 |
| Average Annual Precipitation | 37.5 |
| Average Annual Snowfall | 25.3 |
Average High
Days of Rain
Source: NOAA climate normals (30-year)
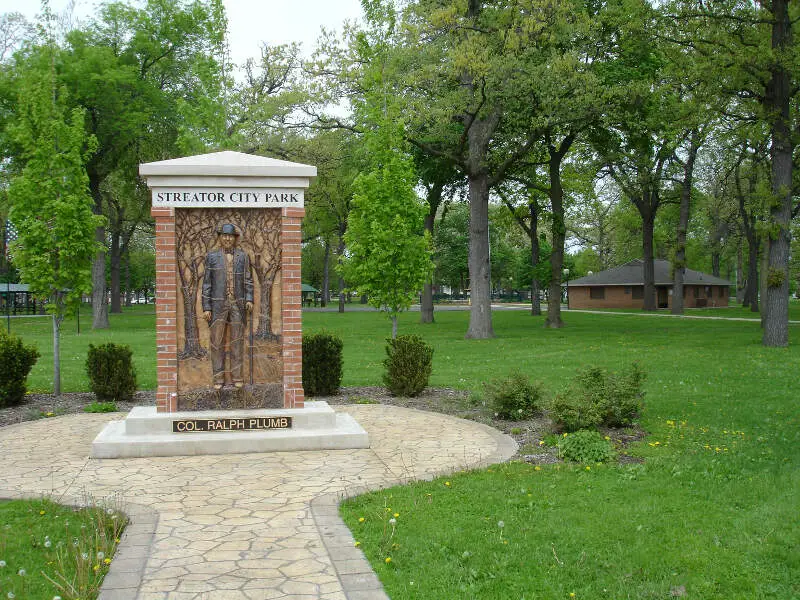
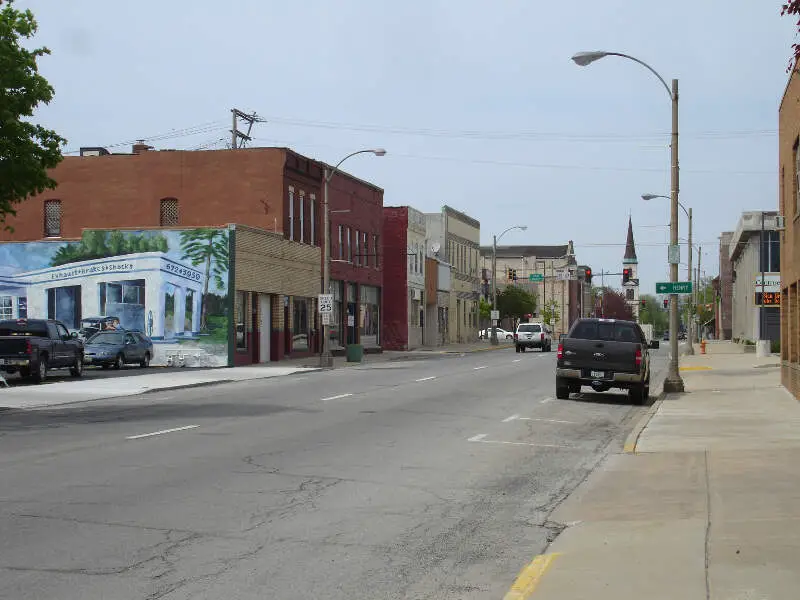
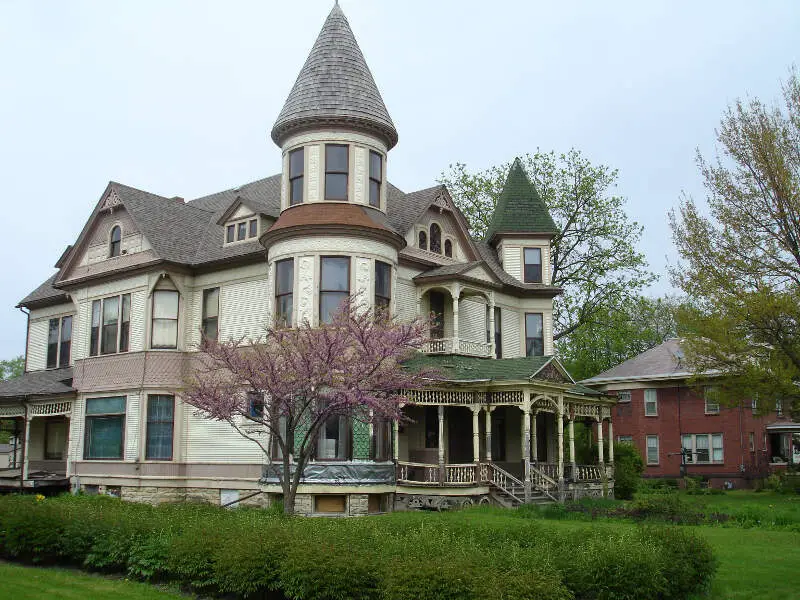
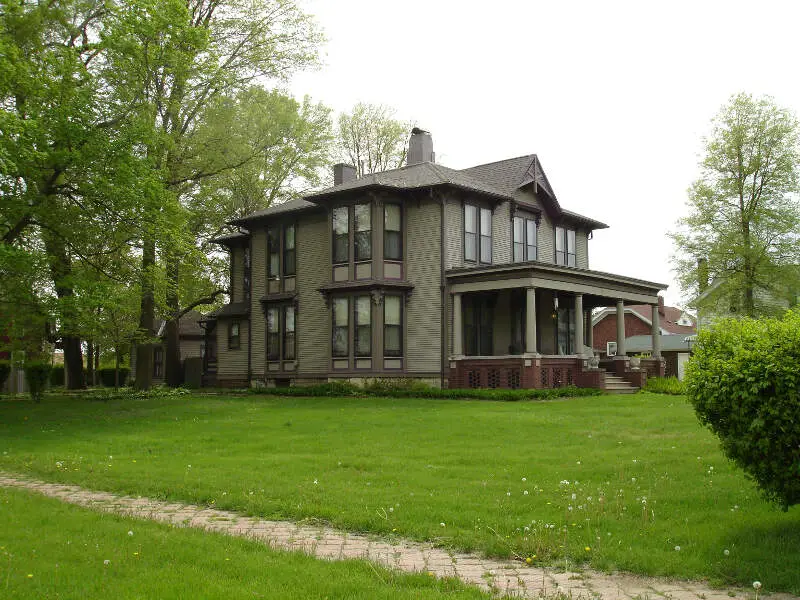
Streator, IL Photos


Rankings & Articles For Streator


Locations Around Streator
Map Of Streator, IL
Best Places Around Streator
Plainfield, IL
Population 46,708
Boulder Hill, IL
Population 8,989
Oswego, IL
Population 36,375
Morton, IL
Population 16,595
Sugar Grove, IL
Population 9,240
Washington, IL
Population 15,919
Shorewood, IL
Population 18,343
Bloomington, IL
Population 78,907
Sandwich, IL
Population 7,219
Yorkville, IL
Population 23,617
Streator Demographics And Statistics
Population over time in Streator
The current population in Streator is 12,330. The population has decreased 6.6% from 2010.
| Year | Population | % Change |
|---|---|---|
| 2024 | 12,330 | 0.5% |
| 2023 | 12,274 | -0.0% |
| 2022 | 12,279 | 1.2% |
| 2021 | 12,135 | -1.6% |
| 2020 | 12,337 | -2.5% |
| 2019 | 12,653 | -1.1% |
| 2018 | 12,791 | -3.4% |
| 2017 | 13,241 | 0.6% |
| 2016 | 13,163 | 1.3% |
| 2015 | 12,990 | -1.2% |
| 2014 | 13,152 | 1.0% |
| 2013 | 13,021 | -0.4% |
| 2012 | 13,068 | -3.8% |
| 2011 | 13,590 | 3.0% |
| 2010 | 13,195 | - |
Race / Ethnicity in Streator
See the full breakdown
Streator is:
73.9% White with 9,114 White residents.
3.7% African American with 462 African American residents.
0.0% American Indian with 2 American Indian residents.
0.8% Asian with 96 Asian residents.
0.0% Hawaiian with 0 Hawaiian residents.
0.0% Other with 0 Other residents.
3.7% Two Or More with 462 Two Or More residents.
17.8% Hispanic with 2,194 Hispanic residents.
| Race | Streator | IL | USA |
|---|---|---|---|
| White | 73.9% | 58.1% | 57.4% |
| African American | 3.7% | 13.3% | 11.9% |
| American Indian | 0.0% | 0.1% | 0.5% |
| Asian | 0.8% | 5.9% | 5.9% |
| Hawaiian | 0.0% | 0.0% | 0.2% |
| Other | 0.0% | 0.4% | 0.6% |
| Two Or More | 3.7% | 3.4% | 4.3% |
| Hispanic | 17.8% | 18.8% | 19.3% |
Gender in Streator
See the full breakdown
Streator is 50.6% female with 6,244 female residents.
Streator is 49.4% male with 6,086 male residents.
| Gender | Streator | IL | USA |
|---|---|---|---|
| Female | 50.6% | 50.6% | 50.5% |
| Male | 49.4% | 49.4% | 49.5% |
Highest level of educational attainment in Streator for adults over 25
See the full breakdown
5.0% of adults in Streator completed < 9th grade.
7.0% of adults in Streator completed 9-12th grade.
41.0% of adults in Streator completed high school / ged.
26.0% of adults in Streator completed some college.
9.0% of adults in Streator completed associate's degree.
9.0% of adults in Streator completed bachelor's degree.
2.0% of adults in Streator completed master's degree.
1.0% of adults in Streator completed professional degree.
0.0% of adults in Streator completed doctorate degree.
| Education | Streator | IL | USA |
|---|---|---|---|
| < 9th Grade | 5.0% | 5.0% | 4.0% |
| 9-12th Grade | 7.0% | 5.0% | 6.0% |
| High School / GED | 41.0% | 25.0% | 26.0% |
| Some College | 26.0% | 19.0% | 19.0% |
| Associate's Degree | 9.0% | 8.0% | 9.0% |
| Bachelor's Degree | 9.0% | 23.0% | 22.0% |
| Master's Degree | 2.0% | 11.0% | 10.0% |
| Professional Degree | 1.0% | 2.0% | 2.0% |
| Doctorate Degree | 0.0% | 2.0% | 2.0% |
Household Income For Streator, Illinois
See the full breakdown
6.8% of households in Streator earn Less than $10,000.
6.6% of households in Streator earn $10,000 to $14,999.
11.5% of households in Streator earn $15,000 to $24,999.
6.4% of households in Streator earn $25,000 to $34,999.
13.9% of households in Streator earn $35,000 to $49,999.
18.0% of households in Streator earn $50,000 to $74,999.
16.8% of households in Streator earn $75,000 to $99,999.
11.2% of households in Streator earn $100,000 to $149,999.
4.5% of households in Streator earn $150,000 to $199,999.
4.2% of households in Streator earn $200,000 or more.
| Income | Streator | IL | USA |
|---|---|---|---|
| Less than $10,000 | 6.8% | 5.4% | 5.0% |
| $10,000 to $14,999 | 6.6% | 3.2% | 3.4% |
| $15,000 to $24,999 | 11.5% | 5.9% | 6.3% |
| $25,000 to $34,999 | 6.4% | 6.3% | 6.6% |
| $35,000 to $49,999 | 13.9% | 9.7% | 10.1% |
| $50,000 to $74,999 | 18.0% | 14.8% | 15.5% |
| $75,000 to $99,999 | 16.8% | 12.6% | 12.6% |
| $100,000 to $149,999 | 11.2% | 18.0% | 17.5% |
| $150,000 to $199,999 | 4.5% | 10.1% | 9.6% |
| $200,000 or more | 4.2% | 13.8% | 13.4% |
Source: U.S. Census ACS 5-year estimates (2024)


