Balch Springs, TX
Demographics And Statistics
Living In Balch Springs, Texas Summary
Life in Balch Springs research summary. HomeSnacks has been using Saturday Night Science to research the quality of life in Balch Springs over the past nine years using Census, FBI, Zillow, and other primary data sources. Based on the most recently available data, we found the following about life in Balch Springs:
The population in Balch Springs is 27,181.
The median home value in Balch Springs is $220,099.
The median income in Balch Springs is $70,528.
The cost of living in Balch Springs is 98 which is 1.0x lower than the national average.
The median rent in Balch Springs is $1,260.
The unemployment rate in Balch Springs is 8.3%.
The poverty rate in Balch Springs is 7.0%.
The average high in Balch Springs is 76.1° and the average low is 54.5°.
Balch Springs SnackAbility
Overall SnackAbility
Balch Springs, TX Crime Report
Crime in Balch Springs summary. We use data from the FBI to determine the crime rates in Balch Springs. Key points include:
There were 867 total crimes in Balch Springs in the last reporting year.
The overall crime rate per 100,000 people in Balch Springs is 3,232.8 / 100k people.
The violent crime rate per 100,000 people in Balch Springs is 417.6 / 100k people.
The property crime rate per 100,000 people in Balch Springs is 2,815.2 / 100k people.
Overall, crime in Balch Springs is 52.54% above the national average.
Total Crimes
Above National Average
Crime In Balch Springs Comparison Table
| Statistic | Count Raw |
Balch Springs / 100k People |
Texas / 100k People |
National / 100k People |
|---|---|---|---|---|
| Total Crimes Per 100K | 867 | 3,232.8 | 2,429.9 | 2,119.2 |
| Violent Crime | 112 | 417.6 | 389.4 | 359.0 |
| Murder | 0 | 0.0 | 5.2 | 5.0 |
| Robbery | 29 | 108.1 | 63.5 | 61.0 |
| Aggravated Assault | 72 | 268.5 | 270.7 | 256.0 |
| Property Crime | 755 | 2,815.2 | 2,040.5 | 1,760.0 |
| Burglary | 89 | 331.9 | 284.3 | 229.0 |
| Larceny | 491 | 1,830.8 | 1,425.6 | 1,272.0 |
| Car Theft | 175 | 652.5 | 330.7 | 259.0 |
Balch Springs, TX Cost Of Living
Cost of living in Balch Springs summary. We use data on the cost of living to determine how expensive it is to live in Balch Springs. Real estate prices drive most of the variance in cost of living around Texas. Key points include:
The cost of living in Balch Springs is 98 with 100 being average.
The cost of living in Balch Springs is 1.0x lower than the national average.
The median home value in Balch Springs is $220,099.
The median income in Balch Springs is $70,528.
Balch Springs's Overall Cost Of Living
Lower Than The National Average
Cost Of Living In Balch Springs Comparison Table
| Living Expense | Balch Springs | Texas | National Average | |
|---|---|---|---|---|
| Overall | 98 | 92 | 100 | |
| Services | 108 | 97 | 100 | |
| Groceries | 102 | 97 | 100 | |
| Health | 108 | 93 | 100 | |
| Housing | 78 | 82 | 100 | |
| Transportation | 91 | 94 | 100 | |
| Utilities | 110 | 104 | 100 | |
Balch Springs, TX Weather
The average high in Balch Springs is 76.1° and the average low is 54.5°.
There are 57.1 days of precipitation each year.
Expect an average of 39.7 inches of precipitation each year with 0.6 inches of snow.
| Stat | Balch Springs |
|---|---|
| Average Annual High | 76.1 |
| Average Annual Low | 54.5 |
| Annual Precipitation Days | 57.1 |
| Average Annual Precipitation | 39.7 |
| Average Annual Snowfall | 0.6 |
Average High
Days of Rain
Balch Springs, TX Photos
2 Reviews & Comments About Balch Springs
/5

HomeSnacks User - 2018-09-10 13:12:49.083987
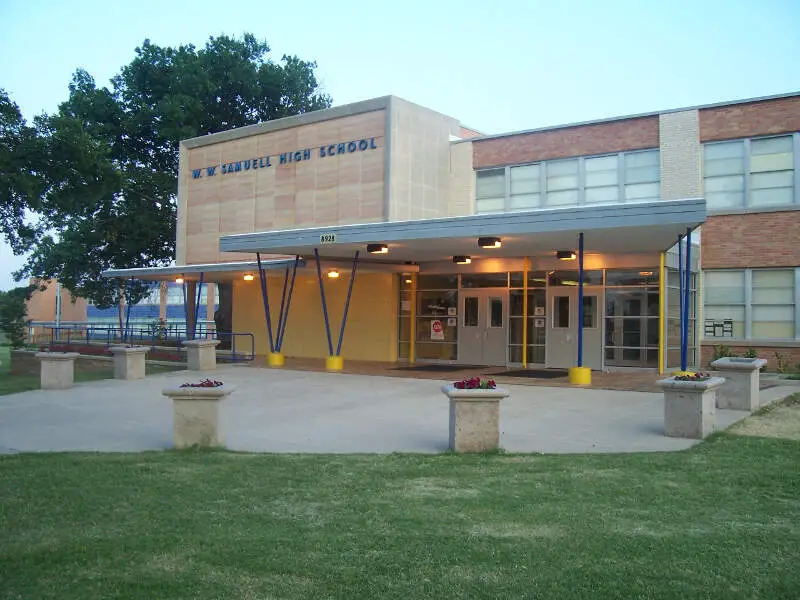
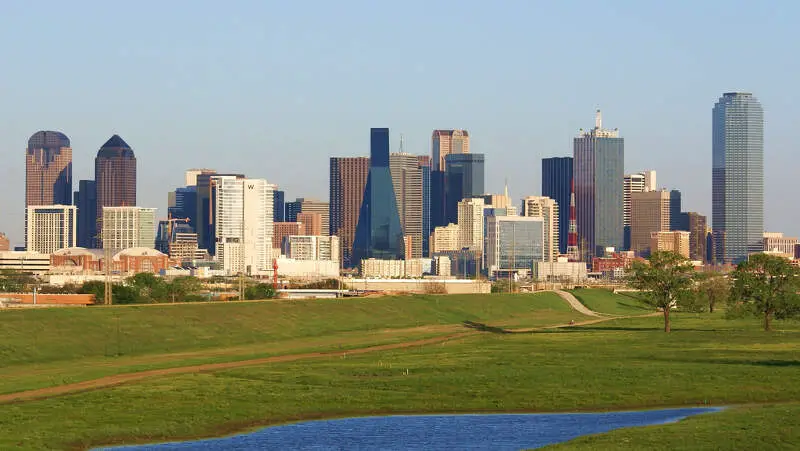
Balch Springs is a suburb of Dallas. It is small but close to a lot of restaurants and a large movie theater.
It has a small town vibe and it has good schools from the Mesquite school district. It has a big Walmart Super center.
HomeSnacks User - None
I live in Balch Springs. I have to disagree with you. It's better than Dallas. You have not been there lately. It has never been ghetto
Rankings for Balch Springs in Texas


Locations Around Balch Springs
Map Of Balch Springs, TX
Best Places Around Balch Springs
University Park, TX
Population 25,104
Richardson, TX
Population 118,269
Sachse, TX
Population 29,075
Rockwall, TX
Population 49,605
Rowlett, TX
Population 64,139
Duncanville, TX
Population 39,879
Forney, TX
Population 28,222
Garland, TX
Population 245,298
Red Oak, TX
Population 15,909
DeSoto, TX
Population 55,896
Balch Springs Demographics And Statistics
Population over time in Balch Springs
The current population in Balch Springs is 27,181. The population has increased 19.3% from 2010.
| Year | Population | % Change |
|---|---|---|
| 2023 | 27,181 | -0.5% |
| 2022 | 27,322 | -0.2% |
| 2021 | 27,369 | 8.9% |
| 2020 | 25,123 | -0.3% |
| 2019 | 25,190 | -0.5% |
| 2018 | 25,312 | 0.3% |
| 2017 | 25,236 | 0.8% |
| 2016 | 25,043 | 0.4% |
| 2015 | 24,948 | 1.0% |
| 2014 | 24,693 | 1.6% |
| 2013 | 24,294 | 1.8% |
| 2012 | 23,853 | 2.5% |
| 2011 | 23,270 | 2.2% |
| 2010 | 22,776 | - |
Race / Ethnicity in Balch Springs
Balch Springs is:
14.4% White with 3,910 White residents.
33.1% African American with 9,010 African American residents.
0.1% American Indian with 31 American Indian residents.
0.1% Asian with 15 Asian residents.
0.0% Hawaiian with 0 Hawaiian residents.
0.0% Other with 0 Other residents.
1.3% Two Or More with 364 Two Or More residents.
51.0% Hispanic with 13,851 Hispanic residents.
| Race | Balch Springs | TX | USA |
|---|---|---|---|
| White | 14.4% | 39.9% | 58.2% |
| African American | 33.1% | 11.9% | 12.0% |
| American Indian | 0.1% | 0.2% | 0.5% |
| Asian | 0.1% | 5.3% | 5.7% |
| Hawaiian | 0.0% | 0.1% | 0.2% |
| Other | 0.0% | 0.4% | 0.5% |
| Two Or More | 1.3% | 2.9% | 3.9% |
| Hispanic | 51.0% | 39.5% | 19.0% |
Gender in Balch Springs
Balch Springs is 49.1% female with 13,338 female residents.
Balch Springs is 50.9% male with 13,842 male residents.
| Gender | Balch Springs | TX | USA |
|---|---|---|---|
| Female | 49.1% | 50.1% | 50.5% |
| Male | 50.9% | 49.9% | 49.5% |
Highest level of educational attainment in Balch Springs for adults over 25
13.0% of adults in Balch Springs completed < 9th grade.
16.0% of adults in Balch Springs completed 9-12th grade.
32.0% of adults in Balch Springs completed high school / ged.
15.0% of adults in Balch Springs completed some college.
12.0% of adults in Balch Springs completed associate's degree.
8.0% of adults in Balch Springs completed bachelor's degree.
3.0% of adults in Balch Springs completed master's degree.
1.0% of adults in Balch Springs completed professional degree.
0.0% of adults in Balch Springs completed doctorate degree.
| Education | Balch Springs | TX | USA |
|---|---|---|---|
| < 9th Grade | 13.0% | 7.0% | 5.0% |
| 9-12th Grade | 16.0% | 7.0% | 6.0% |
| High School / GED | 32.0% | 24.0% | 26.0% |
| Some College | 15.0% | 21.0% | 19.0% |
| Associate's Degree | 12.0% | 8.0% | 9.0% |
| Bachelor's Degree | 8.0% | 21.0% | 21.0% |
| Master's Degree | 3.0% | 9.0% | 10.0% |
| Professional Degree | 1.0% | 2.0% | 2.0% |
| Doctorate Degree | 0.0% | 1.0% | 2.0% |
Household Income For Balch Springs, Texas
1.7% of households in Balch Springs earn Less than $10,000.
3.2% of households in Balch Springs earn $10,000 to $14,999.
6.4% of households in Balch Springs earn $15,000 to $24,999.
3.8% of households in Balch Springs earn $25,000 to $34,999.
17.3% of households in Balch Springs earn $35,000 to $49,999.
21.0% of households in Balch Springs earn $50,000 to $74,999.
16.7% of households in Balch Springs earn $75,000 to $99,999.
21.6% of households in Balch Springs earn $100,000 to $149,999.
4.4% of households in Balch Springs earn $150,000 to $199,999.
3.8% of households in Balch Springs earn $200,000 or more.
| Income | Balch Springs | TX | USA |
|---|---|---|---|
| Less than $10,000 | 1.7% | 5.0% | 4.9% |
| $10,000 to $14,999 | 3.2% | 3.4% | 3.6% |
| $15,000 to $24,999 | 6.4% | 6.5% | 6.6% |
| $25,000 to $34,999 | 3.8% | 7.0% | 6.8% |
| $35,000 to $49,999 | 17.3% | 10.9% | 10.4% |
| $50,000 to $74,999 | 21.0% | 16.4% | 15.7% |
| $75,000 to $99,999 | 16.7% | 12.8% | 12.7% |
| $100,000 to $149,999 | 21.6% | 17.2% | 17.4% |
| $150,000 to $199,999 | 4.4% | 9.1% | 9.3% |
| $200,000 or more | 3.8% | 11.7% | 12.6% |


