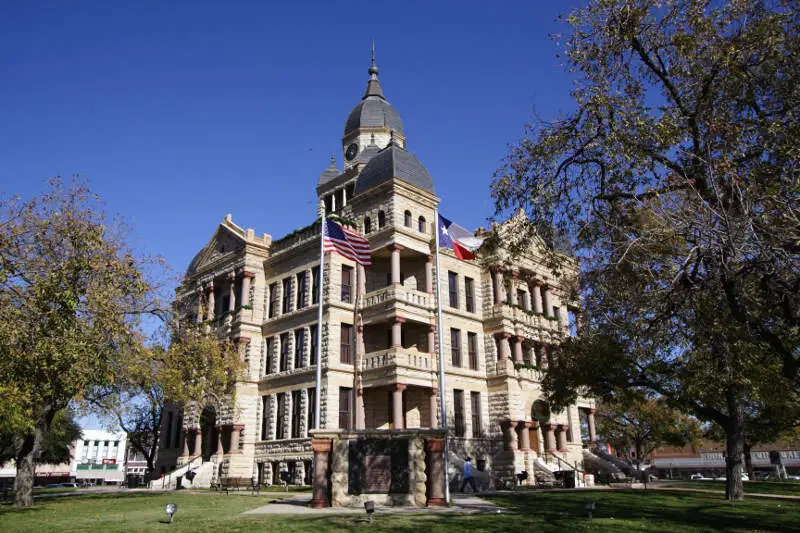
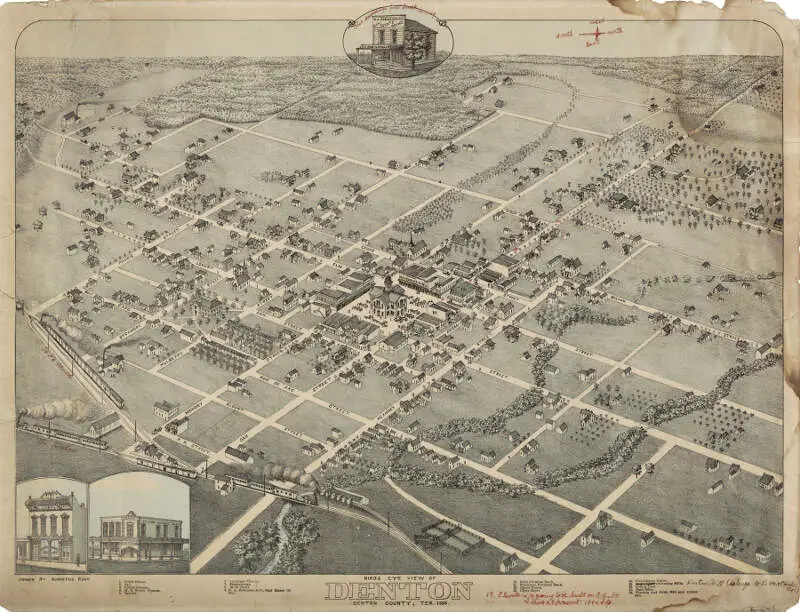
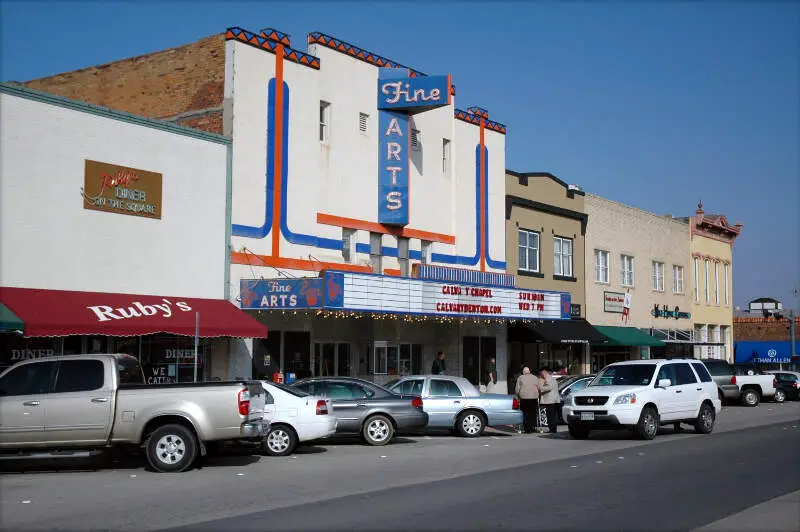
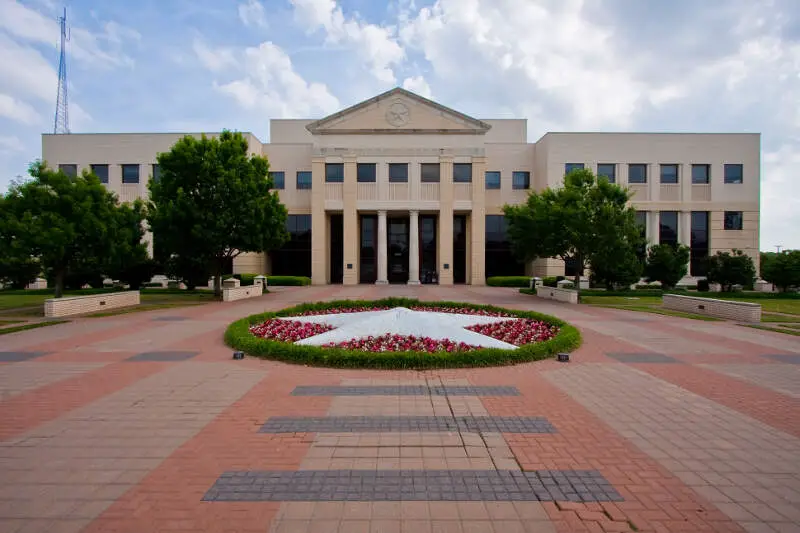
Denton, TX
Demographics And Statistics
Living In Denton, Texas Summary
Life in Denton research summary. HomeSnacks has been using Saturday Night Science to research the quality of life in Denton over the past nine years using Census, FBI, Zillow, and other primary data sources. Based on the most recently available data, we found the following about life in Denton:
The population in Denton is 146,987.
The median home value in Denton is $352,463.
The median income in Denton is $73,719.
The cost of living in Denton is 116 which is 1.2x higher than the national average.
The median rent in Denton is $1,344.
The unemployment rate in Denton is 5.2%.
The poverty rate in Denton is 15.9%.
The average high in Denton is 75.9° and the average low is 53.8°.
Denton SnackAbility
Overall SnackAbility
Denton, TX Crime Report
Crime in Denton summary. We use data from the FBI to determine the crime rates in Denton. Key points include:
There were 3,207 total crimes in Denton in the last reporting year.
The overall crime rate per 100,000 people in Denton is 1,948.8 / 100k people.
The violent crime rate per 100,000 people in Denton is 204.2 / 100k people.
The property crime rate per 100,000 people in Denton is 1,744.6 / 100k people.
Overall, crime in Denton is -8.04% below the national average.
Total Crimes
Below National Average
Crime In Denton Comparison Table
| Statistic | Count Raw |
Denton / 100k People |
Texas / 100k People |
National / 100k People |
|---|---|---|---|---|
| Total Crimes Per 100K | 3,207 | 1,948.8 | 2,429.9 | 2,119.2 |
| Violent Crime | 336 | 204.2 | 389.4 | 359.0 |
| Murder | 7 | 4.3 | 5.2 | 5.0 |
| Robbery | 43 | 26.1 | 63.5 | 61.0 |
| Aggravated Assault | 191 | 116.1 | 270.7 | 256.0 |
| Property Crime | 2,871 | 1,744.6 | 2,040.5 | 1,760.0 |
| Burglary | 219 | 133.1 | 284.3 | 229.0 |
| Larceny | 2,420 | 1,470.5 | 1,425.6 | 1,272.0 |
| Car Theft | 232 | 141.0 | 330.7 | 259.0 |
Denton, TX Cost Of Living
Cost of living in Denton summary. We use data on the cost of living to determine how expensive it is to live in Denton. Real estate prices drive most of the variance in cost of living around Texas. Key points include:
The cost of living in Denton is 116 with 100 being average.
The cost of living in Denton is 1.2x higher than the national average.
The median home value in Denton is $352,463.
The median income in Denton is $73,719.
Denton's Overall Cost Of Living
Higher Than The National Average
Cost Of Living In Denton Comparison Table
| Living Expense | Denton | Texas | National Average | |
|---|---|---|---|---|
| Overall | 116 | 92 | 100 | |
| Services | 121 | 97 | 100 | |
| Groceries | 99 | 97 | 100 | |
| Health | 111 | 93 | 100 | |
| Housing | 125 | 82 | 100 | |
| Transportation | 92 | 94 | 100 | |
| Utilities | 116 | 104 | 100 | |
Denton, TX Weather
The average high in Denton is 75.9° and the average low is 53.8°.
There are 51.1 days of precipitation each year.
Expect an average of 38.4 inches of precipitation each year with 0.2 inches of snow.
| Stat | Denton |
|---|---|
| Average Annual High | 75.9 |
| Average Annual Low | 53.8 |
| Annual Precipitation Days | 51.1 |
| Average Annual Precipitation | 38.4 |
| Average Annual Snowfall | 0.2 |
Average High
Days of Rain
Denton, TX Photos


1 Reviews & Comments About Denton
/5

HomeSnacks User - 2018-07-14 17:14:45.092530
It's a mini Dallas,Tx. The schools are excellent both academics and sports. There are lots of things to do whether it be relaxing, drinking, or shopping.
Denton is very diverse which is a good thing. Just wish I could say the same thing for the construction...
Rankings for Denton in Texas


Locations Around Denton
Map Of Denton, TX
Best Places Around Denton
Corinth, TX
Population 22,868
Flower Mound, TX
Population 77,886
Frisco, TX
Population 210,238
Coppell, TX
Population 42,029
Southlake, TX
Population 31,044
The Colony, TX
Population 44,916
Grapevine, TX
Population 50,875
Lewisville, TX
Population 128,313
Little Elm, TX
Population 51,426
Lakewood, WA
Population 63,034
Denton Demographics And Statistics
Population over time in Denton
The current population in Denton is 146,987. The population has increased 34.6% from 2010.
| Year | Population | % Change |
|---|---|---|
| 2023 | 146,987 | 3.3% |
| 2022 | 142,262 | 1.8% |
| 2021 | 139,704 | -0.0% |
| 2020 | 139,734 | 2.6% |
| 2019 | 136,195 | 1.9% |
| 2018 | 133,661 | 2.0% |
| 2017 | 131,097 | 2.1% |
| 2016 | 128,421 | 2.1% |
| 2015 | 125,734 | 2.4% |
| 2014 | 122,742 | 4.1% |
| 2013 | 117,895 | 2.4% |
| 2012 | 115,098 | 2.8% |
| 2011 | 111,960 | 2.5% |
| 2010 | 109,192 | - |
Race / Ethnicity in Denton
Denton is:
54.6% White with 80,238 White residents.
11.5% African American with 16,837 African American residents.
0.2% American Indian with 241 American Indian residents.
3.9% Asian with 5,741 Asian residents.
0.1% Hawaiian with 91 Hawaiian residents.
0.3% Other with 504 Other residents.
4.3% Two Or More with 6,381 Two Or More residents.
25.1% Hispanic with 36,954 Hispanic residents.
| Race | Denton | TX | USA |
|---|---|---|---|
| White | 54.6% | 39.9% | 58.2% |
| African American | 11.5% | 11.9% | 12.0% |
| American Indian | 0.2% | 0.2% | 0.5% |
| Asian | 3.9% | 5.3% | 5.7% |
| Hawaiian | 0.1% | 0.1% | 0.2% |
| Other | 0.3% | 0.4% | 0.5% |
| Two Or More | 4.3% | 2.9% | 3.9% |
| Hispanic | 25.1% | 39.5% | 19.0% |
Gender in Denton
Denton is 50.5% female with 74,273 female residents.
Denton is 49.5% male with 72,714 male residents.
| Gender | Denton | TX | USA |
|---|---|---|---|
| Female | 50.5% | 50.1% | 50.5% |
| Male | 49.5% | 49.9% | 49.5% |
Highest level of educational attainment in Denton for adults over 25
4.0% of adults in Denton completed < 9th grade.
4.0% of adults in Denton completed 9-12th grade.
20.0% of adults in Denton completed high school / ged.
23.0% of adults in Denton completed some college.
7.0% of adults in Denton completed associate's degree.
26.0% of adults in Denton completed bachelor's degree.
12.0% of adults in Denton completed master's degree.
1.0% of adults in Denton completed professional degree.
3.0% of adults in Denton completed doctorate degree.
| Education | Denton | TX | USA |
|---|---|---|---|
| < 9th Grade | 4.0% | 7.0% | 5.0% |
| 9-12th Grade | 4.0% | 7.0% | 6.0% |
| High School / GED | 20.0% | 24.0% | 26.0% |
| Some College | 23.0% | 21.0% | 19.0% |
| Associate's Degree | 7.0% | 8.0% | 9.0% |
| Bachelor's Degree | 26.0% | 21.0% | 21.0% |
| Master's Degree | 12.0% | 9.0% | 10.0% |
| Professional Degree | 1.0% | 2.0% | 2.0% |
| Doctorate Degree | 3.0% | 1.0% | 2.0% |
Household Income For Denton, Texas
6.7% of households in Denton earn Less than $10,000.
2.9% of households in Denton earn $10,000 to $14,999.
7.2% of households in Denton earn $15,000 to $24,999.
7.5% of households in Denton earn $25,000 to $34,999.
11.5% of households in Denton earn $35,000 to $49,999.
15.0% of households in Denton earn $50,000 to $74,999.
13.7% of households in Denton earn $75,000 to $99,999.
16.9% of households in Denton earn $100,000 to $149,999.
8.6% of households in Denton earn $150,000 to $199,999.
10.2% of households in Denton earn $200,000 or more.
| Income | Denton | TX | USA |
|---|---|---|---|
| Less than $10,000 | 6.7% | 5.0% | 4.9% |
| $10,000 to $14,999 | 2.9% | 3.4% | 3.6% |
| $15,000 to $24,999 | 7.2% | 6.5% | 6.6% |
| $25,000 to $34,999 | 7.5% | 7.0% | 6.8% |
| $35,000 to $49,999 | 11.5% | 10.9% | 10.4% |
| $50,000 to $74,999 | 15.0% | 16.4% | 15.7% |
| $75,000 to $99,999 | 13.7% | 12.8% | 12.7% |
| $100,000 to $149,999 | 16.9% | 17.2% | 17.4% |
| $150,000 to $199,999 | 8.6% | 9.1% | 9.3% |
| $200,000 or more | 10.2% | 11.7% | 12.6% |


