Mansfield, TX
Demographics And Statistics
Living In Mansfield, Texas Summary
Life in Mansfield research summary. HomeSnacks has been using Saturday Night Science to research the quality of life in Mansfield over the past nine years using Census, FBI, Zillow, and other primary data sources. Based on the most recently available data, we found the following about life in Mansfield:
The population in Mansfield is 75,398.
The median home value in Mansfield is $438,497.
The median income in Mansfield is $116,590.
The cost of living in Mansfield is 119 which is 1.2x higher than the national average.
The median rent in Mansfield is $1,798.
The unemployment rate in Mansfield is 3.6%.
The poverty rate in Mansfield is 6.3%.
The average high in Mansfield is 76.8° and the average low is 55.1°.
Mansfield SnackAbility
Overall SnackAbility
Mansfield, TX Crime Report
Crime in Mansfield summary. We use data from the FBI to determine the crime rates in Mansfield. Key points include:
There were 1,188 total crimes in Mansfield in the last reporting year.
The overall crime rate per 100,000 people in Mansfield is 1,474.5 / 100k people.
The violent crime rate per 100,000 people in Mansfield is 93.1 / 100k people.
The property crime rate per 100,000 people in Mansfield is 1,381.4 / 100k people.
Overall, crime in Mansfield is -30.42% below the national average.
Total Crimes
Below National Average
Crime In Mansfield Comparison Table
| Statistic | Count Raw |
Mansfield / 100k People |
Texas / 100k People |
National / 100k People |
|---|---|---|---|---|
| Total Crimes Per 100K | 1,188 | 1,474.5 | 2,429.9 | 2,119.2 |
| Violent Crime | 75 | 93.1 | 389.4 | 359.0 |
| Murder | 2 | 2.5 | 5.2 | 5.0 |
| Robbery | 8 | 9.9 | 63.5 | 61.0 |
| Aggravated Assault | 51 | 63.3 | 270.7 | 256.0 |
| Property Crime | 1,113 | 1,381.4 | 2,040.5 | 1,760.0 |
| Burglary | 89 | 110.5 | 284.3 | 229.0 |
| Larceny | 901 | 1,118.3 | 1,425.6 | 1,272.0 |
| Car Theft | 123 | 152.7 | 330.7 | 259.0 |
Mansfield, TX Cost Of Living
Cost of living in Mansfield summary. We use data on the cost of living to determine how expensive it is to live in Mansfield. Real estate prices drive most of the variance in cost of living around Texas. Key points include:
The cost of living in Mansfield is 119 with 100 being average.
The cost of living in Mansfield is 1.2x higher than the national average.
The median home value in Mansfield is $438,497.
The median income in Mansfield is $116,590.
Mansfield's Overall Cost Of Living
Higher Than The National Average
Cost Of Living In Mansfield Comparison Table
| Living Expense | Mansfield | Texas | National Average | |
|---|---|---|---|---|
| Overall | 119 | 92 | 100 | |
| Services | 108 | 97 | 100 | |
| Groceries | 98 | 97 | 100 | |
| Health | 106 | 93 | 100 | |
| Housing | 154 | 82 | 100 | |
| Transportation | 91 | 94 | 100 | |
| Utilities | 111 | 104 | 100 | |
Mansfield, TX Weather
The average high in Mansfield is 76.8° and the average low is 55.1°.
There are 51.9 days of precipitation each year.
Expect an average of 37.8 inches of precipitation each year with 0.6 inches of snow.
| Stat | Mansfield |
|---|---|
| Average Annual High | 76.8 |
| Average Annual Low | 55.1 |
| Annual Precipitation Days | 51.9 |
| Average Annual Precipitation | 37.8 |
| Average Annual Snowfall | 0.6 |
Average High
Days of Rain
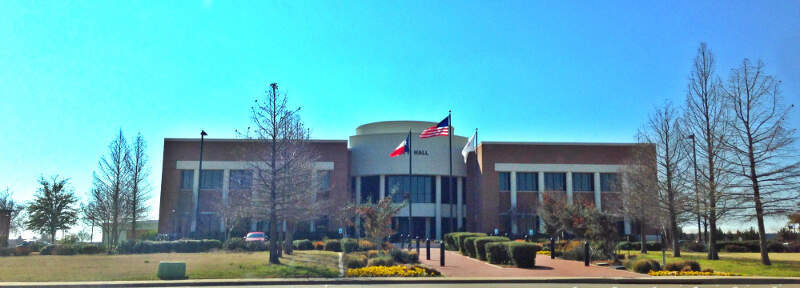
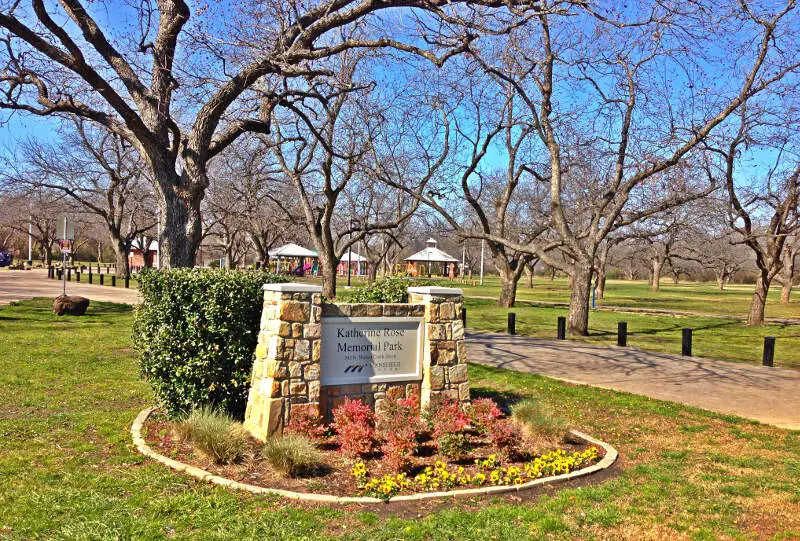
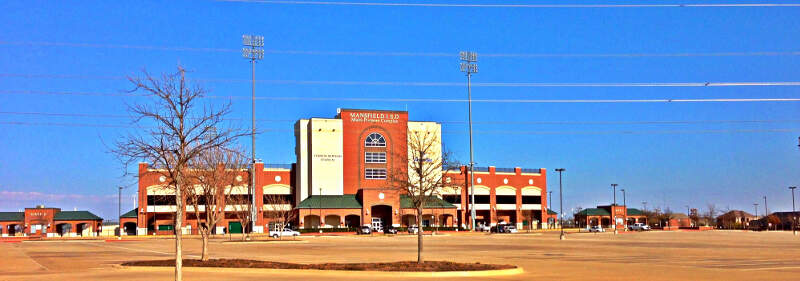
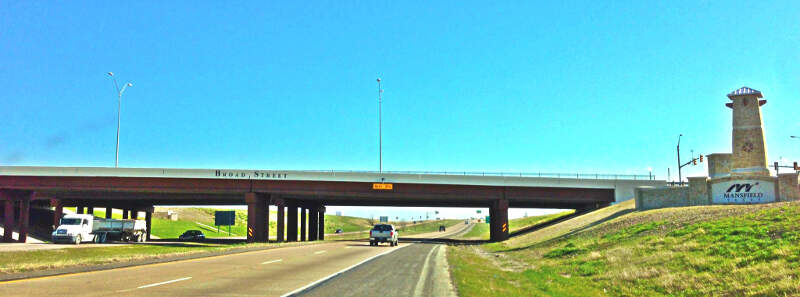
Mansfield, TX Photos


Rankings for Mansfield in Texas


Locations Around Mansfield
Map Of Mansfield, TX
Best Places Around Mansfield
Bedford, TX
Population 49,191
Hurst, TX
Population 39,912
Euless, TX
Population 60,373
Burleson, TX
Population 50,981
Arlington, TX
Population 394,769
Rendon, TX
Population 15,894
Crowley, TX
Population 19,007
Forest Hill, TX
Population 13,923
Duncanville, TX
Population 39,879
Waxahachie, TX
Population 43,591
Mansfield Demographics And Statistics
Population over time in Mansfield
The current population in Mansfield is 75,398. The population has increased 48.0% from 2010.
| Year | Population | % Change |
|---|---|---|
| 2023 | 75,398 | 2.3% |
| 2022 | 73,680 | 3.2% |
| 2021 | 71,375 | -0.1% |
| 2020 | 71,419 | 2.7% |
| 2019 | 69,557 | 3.1% |
| 2018 | 67,492 | 3.8% |
| 2017 | 65,033 | 3.0% |
| 2016 | 63,141 | 2.6% |
| 2015 | 61,559 | 3.0% |
| 2014 | 59,757 | 3.9% |
| 2013 | 57,529 | 3.1% |
| 2012 | 55,818 | 3.7% |
| 2011 | 53,806 | 5.6% |
| 2010 | 50,941 | - |
Race / Ethnicity in Mansfield
Mansfield is:
50.5% White with 38,048 White residents.
23.4% African American with 17,642 African American residents.
0.1% American Indian with 71 American Indian residents.
4.7% Asian with 3,510 Asian residents.
0.0% Hawaiian with 0 Hawaiian residents.
0.3% Other with 202 Other residents.
4.1% Two Or More with 3,121 Two Or More residents.
17.0% Hispanic with 12,804 Hispanic residents.
| Race | Mansfield | TX | USA |
|---|---|---|---|
| White | 50.5% | 39.9% | 58.2% |
| African American | 23.4% | 11.9% | 12.0% |
| American Indian | 0.1% | 0.2% | 0.5% |
| Asian | 4.7% | 5.3% | 5.7% |
| Hawaiian | 0.0% | 0.1% | 0.2% |
| Other | 0.3% | 0.4% | 0.5% |
| Two Or More | 4.1% | 2.9% | 3.9% |
| Hispanic | 17.0% | 39.5% | 19.0% |
Gender in Mansfield
Mansfield is 52.1% female with 39,249 female residents.
Mansfield is 47.9% male with 36,148 male residents.
| Gender | Mansfield | TX | USA |
|---|---|---|---|
| Female | 52.1% | 50.1% | 50.5% |
| Male | 47.9% | 49.9% | 49.5% |
Highest level of educational attainment in Mansfield for adults over 25
1.0% of adults in Mansfield completed < 9th grade.
3.0% of adults in Mansfield completed 9-12th grade.
19.0% of adults in Mansfield completed high school / ged.
24.0% of adults in Mansfield completed some college.
9.0% of adults in Mansfield completed associate's degree.
28.0% of adults in Mansfield completed bachelor's degree.
12.0% of adults in Mansfield completed master's degree.
2.0% of adults in Mansfield completed professional degree.
2.0% of adults in Mansfield completed doctorate degree.
| Education | Mansfield | TX | USA |
|---|---|---|---|
| < 9th Grade | 1.0% | 7.0% | 5.0% |
| 9-12th Grade | 3.0% | 7.0% | 6.0% |
| High School / GED | 19.0% | 24.0% | 26.0% |
| Some College | 24.0% | 21.0% | 19.0% |
| Associate's Degree | 9.0% | 8.0% | 9.0% |
| Bachelor's Degree | 28.0% | 21.0% | 21.0% |
| Master's Degree | 12.0% | 9.0% | 10.0% |
| Professional Degree | 2.0% | 2.0% | 2.0% |
| Doctorate Degree | 2.0% | 1.0% | 2.0% |
Household Income For Mansfield, Texas
3.2% of households in Mansfield earn Less than $10,000.
2.0% of households in Mansfield earn $10,000 to $14,999.
1.8% of households in Mansfield earn $15,000 to $24,999.
3.0% of households in Mansfield earn $25,000 to $34,999.
7.0% of households in Mansfield earn $35,000 to $49,999.
12.1% of households in Mansfield earn $50,000 to $74,999.
12.3% of households in Mansfield earn $75,000 to $99,999.
23.4% of households in Mansfield earn $100,000 to $149,999.
14.5% of households in Mansfield earn $150,000 to $199,999.
20.8% of households in Mansfield earn $200,000 or more.
| Income | Mansfield | TX | USA |
|---|---|---|---|
| Less than $10,000 | 3.2% | 5.0% | 4.9% |
| $10,000 to $14,999 | 2.0% | 3.4% | 3.6% |
| $15,000 to $24,999 | 1.8% | 6.5% | 6.6% |
| $25,000 to $34,999 | 3.0% | 7.0% | 6.8% |
| $35,000 to $49,999 | 7.0% | 10.9% | 10.4% |
| $50,000 to $74,999 | 12.1% | 16.4% | 15.7% |
| $75,000 to $99,999 | 12.3% | 12.8% | 12.7% |
| $100,000 to $149,999 | 23.4% | 17.2% | 17.4% |
| $150,000 to $199,999 | 14.5% | 9.1% | 9.3% |
| $200,000 or more | 20.8% | 11.7% | 12.6% |


