Ivins SnackAbility
Overall SnackAbility
Cost of living in Ivins summary. We use data on the cost of living to determine how expensive it is to live in Ivins. Real estate prices drive most of the variance in cost of living around Utah. Key points include:
The cost of living in Ivins is 124 with 100 being average.
The cost of living in Ivins is 1.2x higher than the national average.
The median home value in Ivins is $617,241.
The median income in Ivins is $78,089.
Ivins's Overall Cost Of Living
Higher Than The National Average
Cost Of Living In Ivins Comparison Table
| Living Expense | Ivins | Utah | National Average |
|---|---|---|---|
| Overall | 124 | 106 | 100 |
| Services | 104 | 100 | 100 |
| Groceries | 99 | 101 | 100 |
| Health | 173 | 111 | 100 |
| Housing | 107 | 103 | 100 |
| Transportation | 101 | 103 | 100 |
| Utilities | 100 | 103 | 100 |
Source: Cost of living index, normalized to US average = 100
Ivins, UT Weather
The average high in Ivins is 76.6° and the average low is 48.1°.
There are 32.7 days of precipitation each year.
Expect an average of 9.1 inches of precipitation each year with 4.4 inches of snow.
| Stat | Ivins |
|---|---|
| Average Annual High | 76.6 |
| Average Annual Low | 48.1 |
| Annual Precipitation Days | 32.7 |
| Average Annual Precipitation | 9.1 |
| Average Annual Snowfall | 4.4 |
Average High
Days of Rain
Source: NOAA climate normals (30-year)
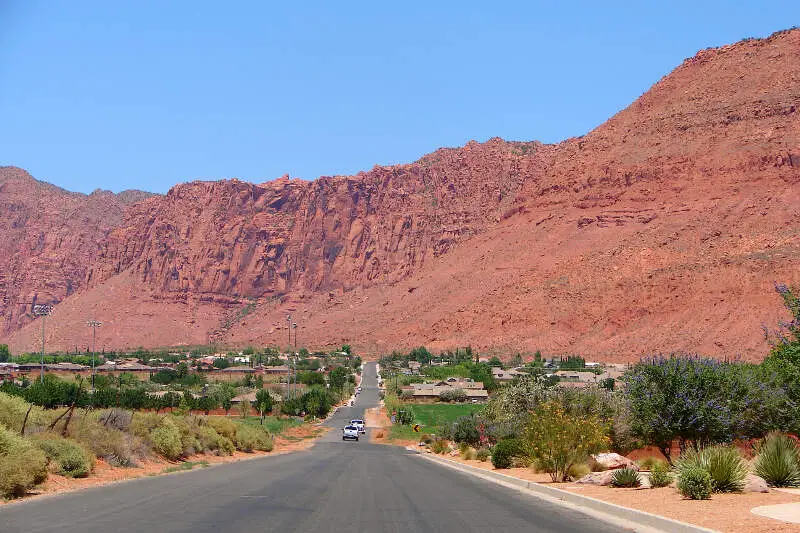
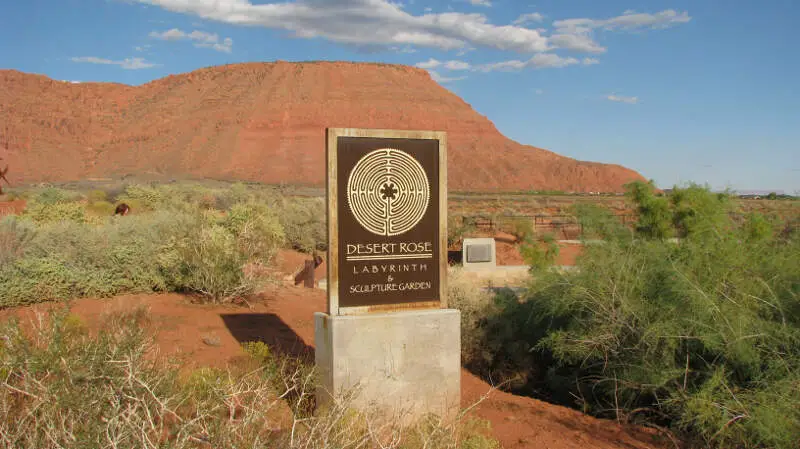
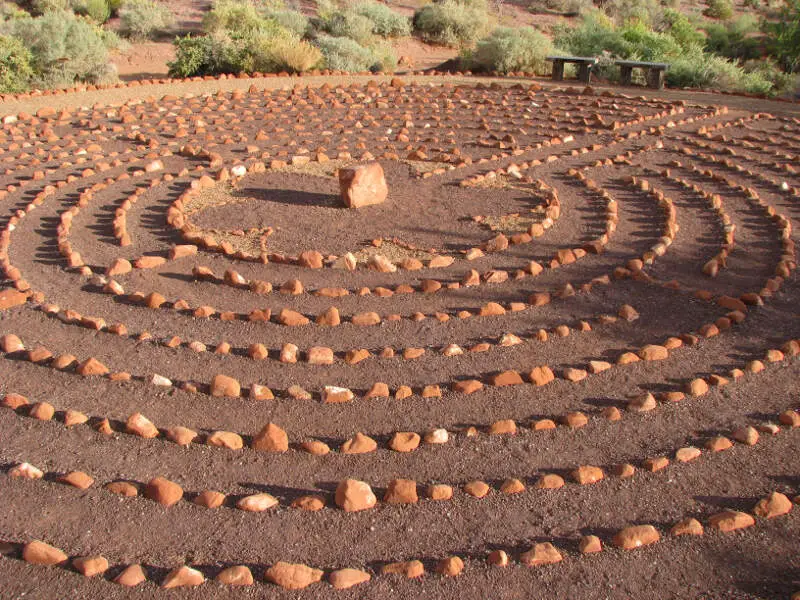
Ivins, UT Photos

Rankings & Articles For Ivins


Locations Around Ivins
Map Of Ivins, UT
Best Places Around Ivins
Santa Clara, UT
Population 8,152
St. George, UT
Population 101,995
Washington, UT
Population 32,348
Mesquite, NV
Population 22,059
Hurricane, UT
Population 22,771
Ivins Demographics And Statistics
Population over time in Ivins
The current population in Ivins is 9,998. The population has increased 51.7% from 2010.
| Year | Population | % Change |
|---|---|---|
| 2024 | 9,998 | 5.0% |
| 2023 | 9,524 | 3.8% |
| 2022 | 9,174 | 4.4% |
| 2021 | 8,786 | -1.6% |
| 2020 | 8,931 | 4.7% |
| 2019 | 8,530 | 3.9% |
| 2018 | 8,211 | 3.8% |
| 2017 | 7,908 | 3.4% |
| 2016 | 7,646 | 3.2% |
| 2015 | 7,406 | 3.1% |
| 2014 | 7,184 | 2.8% |
| 2013 | 6,990 | 2.0% |
| 2012 | 6,856 | 2.0% |
| 2011 | 6,721 | 2.0% |
| 2010 | 6,590 | - |
Race / Ethnicity in Ivins
See the full breakdown
Ivins is:
88.5% White with 8,845 White residents.
0.1% African American with 9 African American residents.
0.0% American Indian with 0 American Indian residents.
0.9% Asian with 89 Asian residents.
0.0% Hawaiian with 0 Hawaiian residents.
0.3% Other with 31 Other residents.
3.2% Two Or More with 324 Two Or More residents.
7.0% Hispanic with 700 Hispanic residents.
| Race | Ivins | UT | USA |
|---|---|---|---|
| White | 88.5% | 74.7% | 57.4% |
| African American | 0.1% | 1.1% | 11.9% |
| American Indian | 0.0% | 0.6% | 0.5% |
| Asian | 0.9% | 2.4% | 5.9% |
| Hawaiian | 0.0% | 0.9% | 0.2% |
| Other | 0.3% | 0.4% | 0.6% |
| Two Or More | 3.2% | 4.0% | 4.3% |
| Hispanic | 7.0% | 15.9% | 19.3% |
Gender in Ivins
See the full breakdown
Ivins is 47.3% female with 4,726 female residents.
Ivins is 52.7% male with 5,271 male residents.
| Gender | Ivins | UT | USA |
|---|---|---|---|
| Female | 47.3% | 49.3% | 50.5% |
| Male | 52.7% | 50.7% | 49.5% |
Highest level of educational attainment in Ivins for adults over 25
See the full breakdown
1.0% of adults in Ivins completed < 9th grade.
1.0% of adults in Ivins completed 9-12th grade.
16.0% of adults in Ivins completed high school / ged.
23.0% of adults in Ivins completed some college.
11.0% of adults in Ivins completed associate's degree.
34.0% of adults in Ivins completed bachelor's degree.
8.0% of adults in Ivins completed master's degree.
3.0% of adults in Ivins completed professional degree.
3.0% of adults in Ivins completed doctorate degree.
| Education | Ivins | UT | USA |
|---|---|---|---|
| < 9th Grade | 1.0% | 2.0% | 4.0% |
| 9-12th Grade | 1.0% | 4.0% | 6.0% |
| High School / GED | 16.0% | 22.0% | 26.0% |
| Some College | 23.0% | 23.0% | 19.0% |
| Associate's Degree | 11.0% | 10.0% | 9.0% |
| Bachelor's Degree | 34.0% | 25.0% | 22.0% |
| Master's Degree | 8.0% | 10.0% | 10.0% |
| Professional Degree | 3.0% | 2.0% | 2.0% |
| Doctorate Degree | 3.0% | 2.0% | 2.0% |
Household Income For Ivins, Utah
See the full breakdown
6.6% of households in Ivins earn Less than $10,000.
2.0% of households in Ivins earn $10,000 to $14,999.
3.4% of households in Ivins earn $15,000 to $24,999.
7.5% of households in Ivins earn $25,000 to $34,999.
7.4% of households in Ivins earn $35,000 to $49,999.
21.9% of households in Ivins earn $50,000 to $74,999.
7.1% of households in Ivins earn $75,000 to $99,999.
25.1% of households in Ivins earn $100,000 to $149,999.
10.0% of households in Ivins earn $150,000 to $199,999.
9.1% of households in Ivins earn $200,000 or more.
| Income | Ivins | UT | USA |
|---|---|---|---|
| Less than $10,000 | 6.6% | 3.1% | 5.0% |
| $10,000 to $14,999 | 2.0% | 2.0% | 3.4% |
| $15,000 to $24,999 | 3.4% | 4.0% | 6.3% |
| $25,000 to $34,999 | 7.5% | 5.0% | 6.6% |
| $35,000 to $49,999 | 7.4% | 8.8% | 10.1% |
| $50,000 to $74,999 | 21.9% | 15.5% | 15.5% |
| $75,000 to $99,999 | 7.1% | 14.2% | 12.6% |
| $100,000 to $149,999 | 25.1% | 21.6% | 17.5% |
| $150,000 to $199,999 | 10.0% | 11.9% | 9.6% |
| $200,000 or more | 9.1% | 13.9% | 13.4% |
Source: U.S. Census ACS 5-year estimates (2024)


