Moab SnackAbility
Overall SnackAbility
Crime in Moab summary. We use data from the FBI to determine the crime rates in Moab. Key points include:
There were 96 total crimes in Moab in the last reporting year.
The overall crime rate per 100,000 people in Moab is 1,855.1 / 100k people.
The violent crime rate per 100,000 people in Moab is 734.3 / 100k people.
The property crime rate per 100,000 people in Moab is 1,120.8 / 100k people.
Overall, crime in Moab is -12.46% below the national average.
Total Crimes
Below National Average
Crime In Moab Comparison Table
| Statistic | Count Raw |
Moab / 100k People |
Utah / 100k People |
National / 100k People |
|---|---|---|---|---|
| Total Crimes Per 100K | 96 | 1,855.1 | 1,638.5 | 2,119.2 |
| Violent Crime | 38 | 734.3 | 229.6 | 359.0 |
| Murder | 0 | 0.0 | 2.6 | 5.0 |
| Robbery | 0 | 0.0 | 27.3 | 61.0 |
| Aggravated Assault | 28 | 541.1 | 141.7 | 256.0 |
| Property Crime | 58 | 1,120.8 | 1,408.9 | 1,760.0 |
| Burglary | 7 | 135.3 | 146.6 | 229.0 |
| Larceny | 47 | 908.2 | 1,145.8 | 1,272.0 |
| Car Theft | 4 | 77.3 | 116.5 | 259.0 |
Source: FBI Uniform Crime Reporting (2024)
Cost of living in Moab summary. We use data on the cost of living to determine how expensive it is to live in Moab. Real estate prices drive most of the variance in cost of living around Utah. Key points include:
The cost of living in Moab is 110 with 100 being average.
The cost of living in Moab is 1.1x higher than the national average.
The median home value in Moab is $543,316.
The median income in Moab is $61,667.
Moab's Overall Cost Of Living
Higher Than The National Average
Cost Of Living In Moab Comparison Table
| Living Expense | Moab | Utah | National Average |
|---|---|---|---|
| Overall | 110 | 106 | 100 |
| Services | 104 | 100 | 100 |
| Groceries | 107 | 101 | 100 |
| Health | 118 | 111 | 100 |
| Housing | 108 | 103 | 100 |
| Transportation | 108 | 103 | 100 |
| Utilities | 108 | 103 | 100 |
Source: Cost of living index, normalized to US average = 100
Moab, UT Weather
The average high in Moab is 70.9° and the average low is 41.0°.
There are 27.9 days of precipitation each year.
Expect an average of 9.4 inches of precipitation each year with 7.5 inches of snow.
| Stat | Moab |
|---|---|
| Average Annual High | 70.9 |
| Average Annual Low | 41.0 |
| Annual Precipitation Days | 27.9 |
| Average Annual Precipitation | 9.4 |
| Average Annual Snowfall | 7.5 |
Average High
Days of Rain
Source: NOAA climate normals (30-year)
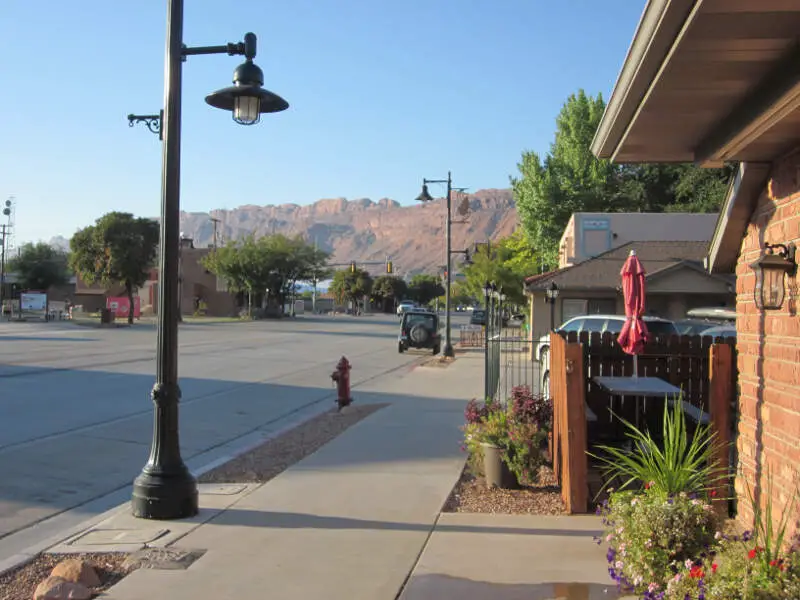
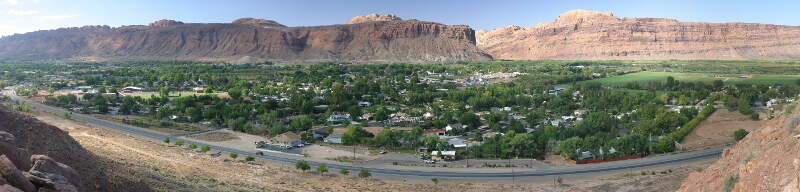
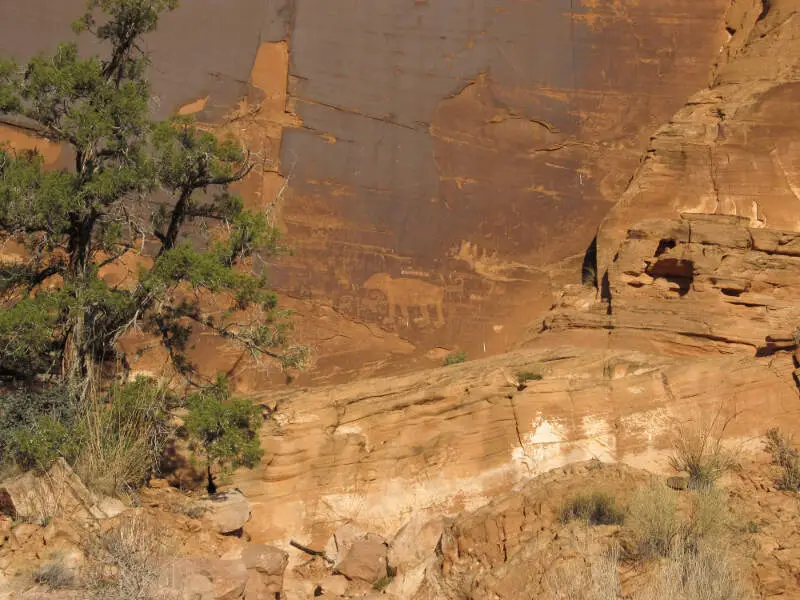
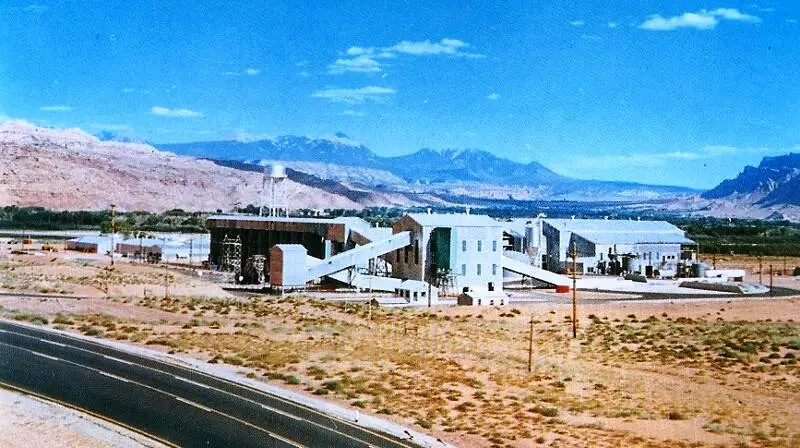
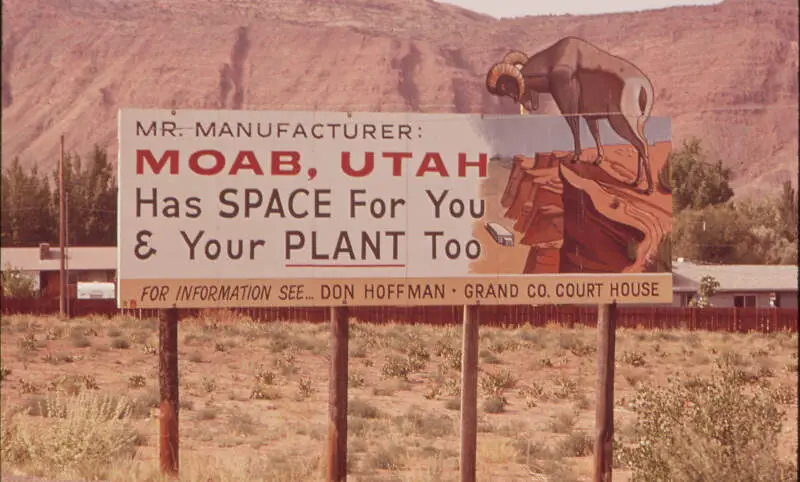
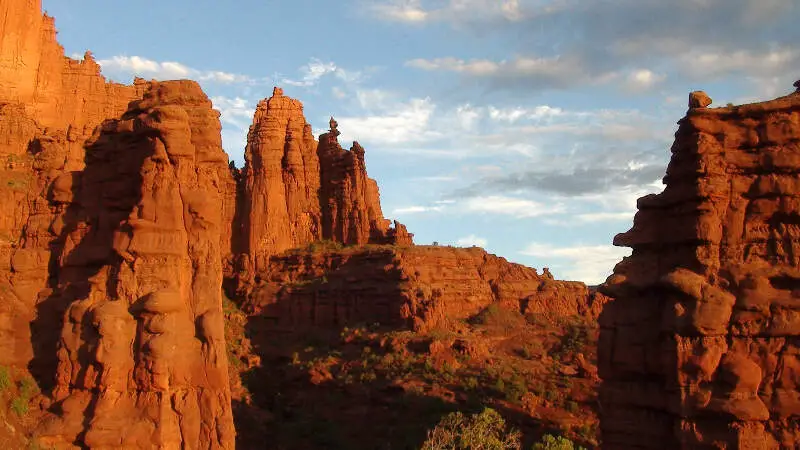
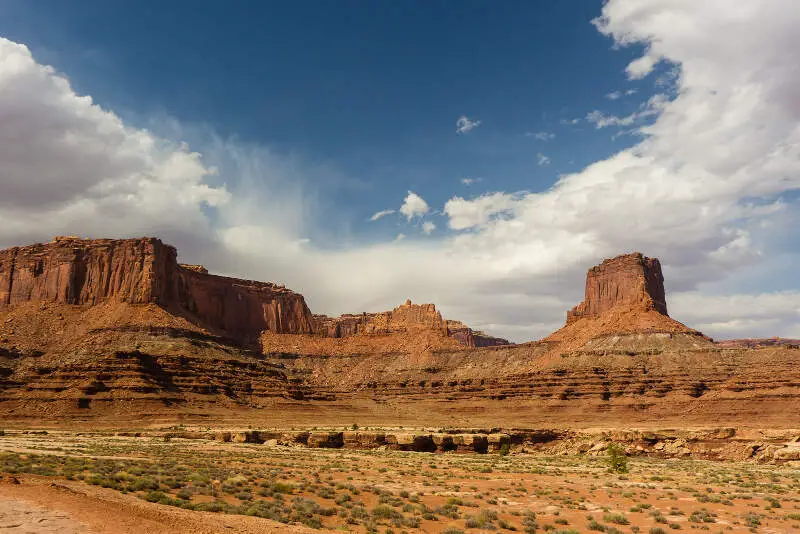
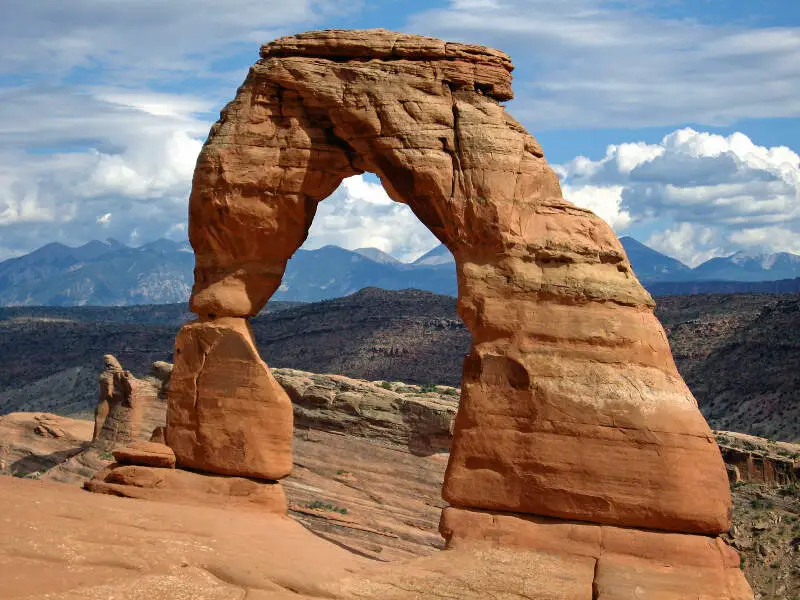
Moab, UT Photos
3 Reviews & Comments About Moab

There was an unending supply of activities including camping, off-roading, biking, climbing, and rafting. The people were friendly and the streets were clean.
My favorite place in Moab was the Moab Brewery. The food was good and the beer was good as well. The main thing to watch out for in Moab is the heat. It was over 100 degrees every day that I was there.
The city has a lot of great shops and dining establishments from which to choose. The city seems safe and friendly, everyone is very nice. People all take an acute interest in nature and engaging in physical activities out doors. Housing is reasonable and there is someone you can always meet and get along with when hanging out in town.
There is so much natural beauty that abounds in the general vicinity. You can simply tell that people enjoy their lives and enjoy living here. There is not a lot of stress like in the day to day work a day world, and much of what you are experiencing in Moab just seems real, like you have left the rest of the world behind. Just getting to meet other people with similar life interests in nature and out door recreation is whats makes the city a very friendly and fun place to be.
The gateway to Arches National Park. Has Jeep rental, some simple hotels, places to eat
Arches National Park is "the thing" that brings all visitors to Moab.
Rankings & Articles For Moab


Locations Around Moab
Map Of Moab, UT
Best Places Around Moab
Moab Demographics And Statistics
Population over time in Moab
The current population in Moab is 5,312. The population has increased 7.3% from 2010.
| Year | Population | % Change |
|---|---|---|
| 2024 | 5,312 | -0.1% |
| 2023 | 5,316 | -0.2% |
| 2022 | 5,329 | 0.0% |
| 2021 | 5,329 | 0.5% |
| 2020 | 5,303 | 0.7% |
| 2019 | 5,268 | 0.2% |
| 2018 | 5,259 | 0.5% |
| 2017 | 5,232 | 0.7% |
| 2016 | 5,196 | 0.4% |
| 2015 | 5,175 | 1.4% |
| 2014 | 5,105 | 0.4% |
| 2013 | 5,087 | 1.1% |
| 2012 | 5,031 | 0.7% |
| 2011 | 4,997 | 0.9% |
| 2010 | 4,950 | - |
Race / Ethnicity in Moab
See the full breakdown
Moab is:
71.1% White with 3,779 White residents.
0.0% African American with 0 African American residents.
4.1% American Indian with 216 American Indian residents.
1.7% Asian with 90 Asian residents.
1.4% Hawaiian with 73 Hawaiian residents.
0.2% Other with 8 Other residents.
3.0% Two Or More with 160 Two Or More residents.
18.6% Hispanic with 986 Hispanic residents.
| Race | Moab | UT | USA |
|---|---|---|---|
| White | 71.1% | 74.7% | 57.4% |
| African American | 0.0% | 1.1% | 11.9% |
| American Indian | 4.1% | 0.6% | 0.5% |
| Asian | 1.7% | 2.4% | 5.9% |
| Hawaiian | 1.4% | 0.9% | 0.2% |
| Other | 0.2% | 0.4% | 0.6% |
| Two Or More | 3.0% | 4.0% | 4.3% |
| Hispanic | 18.6% | 15.9% | 19.3% |
Gender in Moab
See the full breakdown
Moab is 46.8% female with 2,483 female residents.
Moab is 53.2% male with 2,828 male residents.
| Gender | Moab | UT | USA |
|---|---|---|---|
| Female | 46.8% | 49.3% | 50.5% |
| Male | 53.2% | 50.7% | 49.5% |
Highest level of educational attainment in Moab for adults over 25
See the full breakdown
2.0% of adults in Moab completed < 9th grade.
6.0% of adults in Moab completed 9-12th grade.
18.0% of adults in Moab completed high school / ged.
28.0% of adults in Moab completed some college.
7.0% of adults in Moab completed associate's degree.
27.0% of adults in Moab completed bachelor's degree.
7.0% of adults in Moab completed master's degree.
3.0% of adults in Moab completed professional degree.
2.0% of adults in Moab completed doctorate degree.
| Education | Moab | UT | USA |
|---|---|---|---|
| < 9th Grade | 2.0% | 2.0% | 4.0% |
| 9-12th Grade | 6.0% | 4.0% | 6.0% |
| High School / GED | 18.0% | 22.0% | 26.0% |
| Some College | 28.0% | 23.0% | 19.0% |
| Associate's Degree | 7.0% | 10.0% | 9.0% |
| Bachelor's Degree | 27.0% | 25.0% | 22.0% |
| Master's Degree | 7.0% | 10.0% | 10.0% |
| Professional Degree | 3.0% | 2.0% | 2.0% |
| Doctorate Degree | 2.0% | 2.0% | 2.0% |
Household Income For Moab, Utah
See the full breakdown
12.8% of households in Moab earn Less than $10,000.
4.9% of households in Moab earn $10,000 to $14,999.
5.4% of households in Moab earn $15,000 to $24,999.
7.0% of households in Moab earn $25,000 to $34,999.
10.0% of households in Moab earn $35,000 to $49,999.
19.1% of households in Moab earn $50,000 to $74,999.
8.3% of households in Moab earn $75,000 to $99,999.
20.9% of households in Moab earn $100,000 to $149,999.
6.6% of households in Moab earn $150,000 to $199,999.
5.0% of households in Moab earn $200,000 or more.
| Income | Moab | UT | USA |
|---|---|---|---|
| Less than $10,000 | 12.8% | 3.1% | 5.0% |
| $10,000 to $14,999 | 4.9% | 2.0% | 3.4% |
| $15,000 to $24,999 | 5.4% | 4.0% | 6.3% |
| $25,000 to $34,999 | 7.0% | 5.0% | 6.6% |
| $35,000 to $49,999 | 10.0% | 8.8% | 10.1% |
| $50,000 to $74,999 | 19.1% | 15.5% | 15.5% |
| $75,000 to $99,999 | 8.3% | 14.2% | 12.6% |
| $100,000 to $149,999 | 20.9% | 21.6% | 17.5% |
| $150,000 to $199,999 | 6.6% | 11.9% | 9.6% |
| $200,000 or more | 5.0% | 13.9% | 13.4% |
Source: U.S. Census ACS 5-year estimates (2024)


