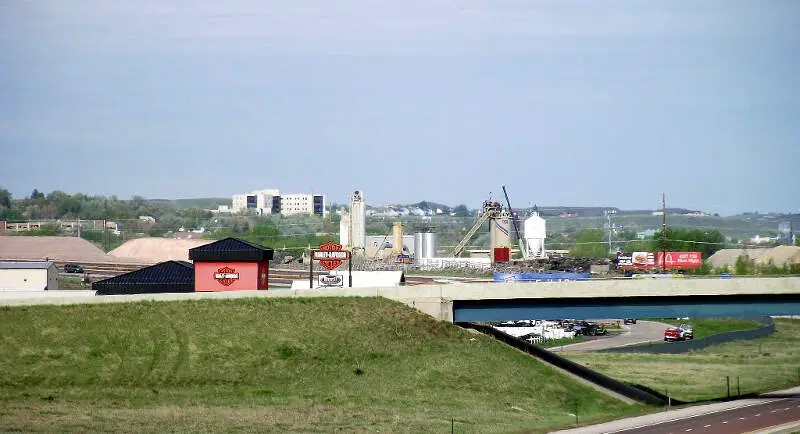
Gillette, WY
Demographics And Statistics
Living In Gillette, Wyoming Summary
Life in Gillette research summary. HomeSnacks has been using Saturday Night Science to research the quality of life in Gillette over the past nine years using Census, FBI, Zillow, and other primary data sources. Based on the most recently available data, we found the following about life in Gillette:
The population in Gillette is 33,278.
The median home value in Gillette is $332,944.
The median income in Gillette is $90,699.
The cost of living in Gillette is 97 which is 1.0x lower than the national average.
The median rent in Gillette is $922.
The unemployment rate in Gillette is 4.3%.
The poverty rate in Gillette is 9.0%.
The average high in Gillette is 57.9° and the average low is 32.7°.
Gillette SnackAbility
Overall SnackAbility
Gillette, WY Crime Report
Crime in Gillette summary. We use data from the FBI to determine the crime rates in Gillette. Key points include:
There were 575 total crimes in Gillette in the last reporting year.
The overall crime rate per 100,000 people in Gillette is 1,716.3 / 100k people.
The violent crime rate per 100,000 people in Gillette is 197.0 / 100k people.
The property crime rate per 100,000 people in Gillette is 1,519.3 / 100k people.
Overall, crime in Gillette is -19.01% below the national average.
Total Crimes
Below National Average
Crime In Gillette Comparison Table
| Statistic | Count Raw |
Gillette / 100k People |
Wyoming / 100k People |
National / 100k People |
|---|---|---|---|---|
| Total Crimes Per 100K | 575 | 1,716.3 | 1,435.3 | 2,119.2 |
| Violent Crime | 66 | 197.0 | 203.4 | 359.0 |
| Murder | 0 | 0.0 | 2.4 | 5.0 |
| Robbery | 1 | 3.0 | 7.1 | 61.0 |
| Aggravated Assault | 51 | 152.2 | 135.8 | 256.0 |
| Property Crime | 509 | 1,519.3 | 1,231.9 | 1,760.0 |
| Burglary | 47 | 140.3 | 171.2 | 229.0 |
| Larceny | 442 | 1,319.3 | 954.5 | 1,272.0 |
| Car Theft | 20 | 59.7 | 106.2 | 259.0 |
Gillette, WY Cost Of Living
Cost of living in Gillette summary. We use data on the cost of living to determine how expensive it is to live in Gillette. Real estate prices drive most of the variance in cost of living around Wyoming. Key points include:
The cost of living in Gillette is 97 with 100 being average.
The cost of living in Gillette is 1.0x lower than the national average.
The median home value in Gillette is $332,944.
The median income in Gillette is $90,699.
Gillette's Overall Cost Of Living
Lower Than The National Average
Cost Of Living In Gillette Comparison Table
| Living Expense | Gillette | Wyoming | National Average | |
|---|---|---|---|---|
| Overall | 97 | 97 | 100 | |
| Services | 97 | 99 | 100 | |
| Groceries | 99 | 103 | 100 | |
| Health | 97 | 101 | 100 | |
| Housing | 107 | 100 | 100 | |
| Transportation | 92 | 92 | 100 | |
| Utilities | 89 | 88 | 100 | |
Gillette, WY Weather
The average high in Gillette is 57.9° and the average low is 32.7°.
There are 43.2 days of precipitation each year.
Expect an average of 15.0 inches of precipitation each year with 56.6 inches of snow.
| Stat | Gillette |
|---|---|
| Average Annual High | 57.9 |
| Average Annual Low | 32.7 |
| Annual Precipitation Days | 43.2 |
| Average Annual Precipitation | 15.0 |
| Average Annual Snowfall | 56.6 |
Average High
Days of Rain
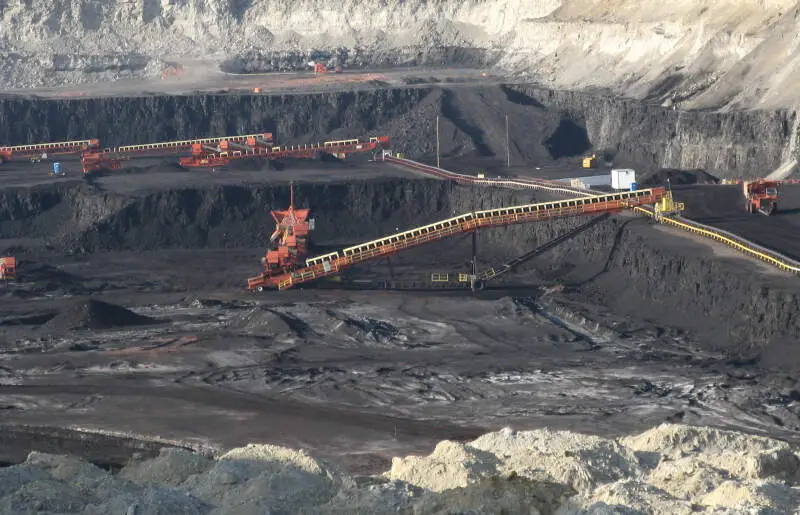
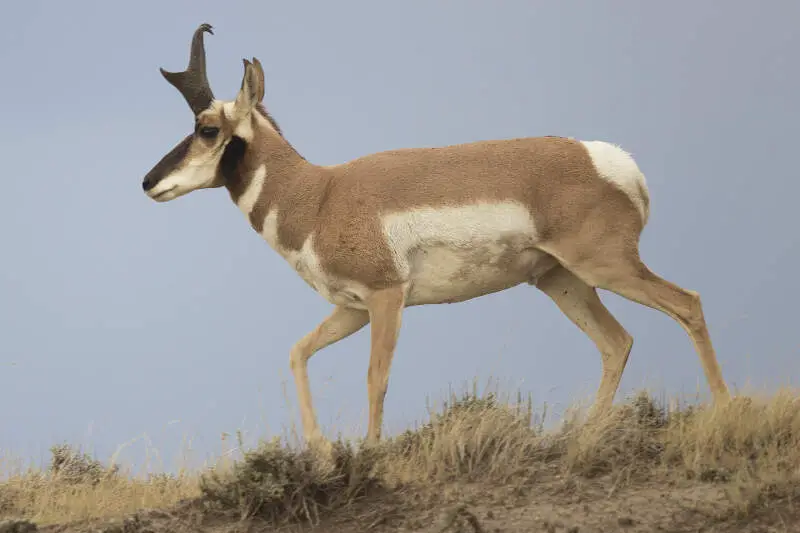
Gillette, WY Photos
1 Reviews & Comments About Gillette
/5

HomeSnacks User - 2019-03-29 01:46:01.238162
I've lived in Gillette since I was 11 years old. Over the past 14 years I have met some of the meanest, most ignorant, intolerable, and back stabbing people I've ever met. Nobody here cares for anyone else but themselves, they hardly take care of the snow in town like they should worst drivers I've ever seen, the m**h epidemic is absolutely outrageous, everyone I know is on it and cops don't do anything about dealers, the county 17 arrest page is full of arrests from traffic related incidents. The bullying in the schools, middle in particular, is the worst I've ever seen. There's a very clear line divided between the people who's parents work in coal or oil and have money and the ones who don't. The rich kids single out the poor or less well off kids, and torture and alienate them. Worst town I've ever lived in, 0/10
Literally has one movie theatre, one kids arcade, and about 15 bars and that's it for recreation pretty much. Unless you count the stagnant pond they call the fishing lake which has a playground.
Rankings for Gillette in Wyoming


Locations Around Gillette
Map Of Gillette, WY
Best Places Around Gillette
Gillette Demographics And Statistics
Population over time in Gillette
The current population in Gillette is 33,278. The population has increased 22.6% from 2010.
| Year | Population | % Change |
|---|---|---|
| 2023 | 33,278 | 0.4% |
| 2022 | 33,158 | 0.3% |
| 2021 | 33,047 | 1.6% |
| 2020 | 32,513 | -1.0% |
| 2019 | 32,857 | -0.6% |
| 2018 | 33,056 | 4.0% |
| 2017 | 31,783 | -0.8% |
| 2016 | 32,033 | 1.3% |
| 2015 | 31,634 | 1.7% |
| 2014 | 31,110 | 2.1% |
| 2013 | 30,467 | 3.4% |
| 2012 | 29,472 | 5.0% |
| 2011 | 28,063 | 3.4% |
| 2010 | 27,141 | - |
Race / Ethnicity in Gillette
Gillette is:
83.6% White with 27,808 White residents.
0.4% African American with 145 African American residents.
0.9% American Indian with 314 American Indian residents.
0.2% Asian with 79 Asian residents.
0.0% Hawaiian with 11 Hawaiian residents.
0.1% Other with 20 Other residents.
4.1% Two Or More with 1,372 Two Or More residents.
10.6% Hispanic with 3,529 Hispanic residents.
| Race | Gillette | WY | USA |
|---|---|---|---|
| White | 83.6% | 82.1% | 58.2% |
| African American | 0.4% | 0.8% | 12.0% |
| American Indian | 0.9% | 1.7% | 0.5% |
| Asian | 0.2% | 0.8% | 5.7% |
| Hawaiian | 0.0% | 0.1% | 0.2% |
| Other | 0.1% | 0.6% | 0.5% |
| Two Or More | 4.1% | 3.5% | 3.9% |
| Hispanic | 10.6% | 10.4% | 19.0% |
Gender in Gillette
Gillette is 47.5% female with 15,819 female residents.
Gillette is 52.5% male with 17,459 male residents.
| Gender | Gillette | WY | USA |
|---|---|---|---|
| Female | 47.5% | 48.8% | 50.5% |
| Male | 52.5% | 51.2% | 49.5% |
Highest level of educational attainment in Gillette for adults over 25
2.0% of adults in Gillette completed < 9th grade.
5.0% of adults in Gillette completed 9-12th grade.
32.0% of adults in Gillette completed high school / ged.
25.0% of adults in Gillette completed some college.
12.0% of adults in Gillette completed associate's degree.
13.0% of adults in Gillette completed bachelor's degree.
9.0% of adults in Gillette completed master's degree.
1.0% of adults in Gillette completed professional degree.
1.0% of adults in Gillette completed doctorate degree.
| Education | Gillette | WY | USA |
|---|---|---|---|
| < 9th Grade | 2.0% | 1.0% | 5.0% |
| 9-12th Grade | 5.0% | 4.0% | 6.0% |
| High School / GED | 32.0% | 28.0% | 26.0% |
| Some College | 25.0% | 25.0% | 19.0% |
| Associate's Degree | 12.0% | 12.0% | 9.0% |
| Bachelor's Degree | 13.0% | 19.0% | 21.0% |
| Master's Degree | 9.0% | 8.0% | 10.0% |
| Professional Degree | 1.0% | 2.0% | 2.0% |
| Doctorate Degree | 1.0% | 1.0% | 2.0% |
Household Income For Gillette, Wyoming
5.1% of households in Gillette earn Less than $10,000.
1.6% of households in Gillette earn $10,000 to $14,999.
5.3% of households in Gillette earn $15,000 to $24,999.
6.2% of households in Gillette earn $25,000 to $34,999.
7.3% of households in Gillette earn $35,000 to $49,999.
15.9% of households in Gillette earn $50,000 to $74,999.
13.0% of households in Gillette earn $75,000 to $99,999.
24.4% of households in Gillette earn $100,000 to $149,999.
12.6% of households in Gillette earn $150,000 to $199,999.
8.6% of households in Gillette earn $200,000 or more.
| Income | Gillette | WY | USA |
|---|---|---|---|
| Less than $10,000 | 5.1% | 4.6% | 4.9% |
| $10,000 to $14,999 | 1.6% | 3.4% | 3.6% |
| $15,000 to $24,999 | 5.3% | 7.0% | 6.6% |
| $25,000 to $34,999 | 6.2% | 7.4% | 6.8% |
| $35,000 to $49,999 | 7.3% | 10.5% | 10.4% |
| $50,000 to $74,999 | 15.9% | 17.2% | 15.7% |
| $75,000 to $99,999 | 13.0% | 13.7% | 12.7% |
| $100,000 to $149,999 | 24.4% | 19.2% | 17.4% |
| $150,000 to $199,999 | 12.6% | 9.1% | 9.3% |
| $200,000 or more | 8.6% | 7.9% | 12.6% |


