Yuma SnackAbility
Overall SnackAbility
Crime in Yuma summary. We use data from the FBI to determine the crime rates in Yuma. Key points include:
There were 1,704 total crimes in Yuma in the last reporting year.
The overall crime rate per 100,000 people in Yuma is 1,670.8 / 100k people.
The violent crime rate per 100,000 people in Yuma is 423.6 / 100k people.
The property crime rate per 100,000 people in Yuma is 1,247.2 / 100k people.
Overall, crime in Yuma is -21.16% below the national average.
Total Crimes
Below National Average
Crime In Yuma Comparison Table
| Statistic | Count Raw |
Yuma / 100k People |
Arizona / 100k People |
National / 100k People |
|---|---|---|---|---|
| Total Crimes Per 100K | 1,704 | 1,670.8 | 2,214.0 | 2,119.2 |
| Violent Crime | 432 | 423.6 | 421.9 | 359.0 |
| Murder | 3 | 2.9 | 4.9 | 5.0 |
| Robbery | 24 | 23.5 | 64.6 | 61.0 |
| Aggravated Assault | 361 | 354.0 | 312.4 | 256.0 |
| Property Crime | 1,272 | 1,247.2 | 1,792.1 | 1,760.0 |
| Burglary | 201 | 197.1 | 217.8 | 229.0 |
| Larceny | 906 | 888.3 | 1,329.9 | 1,272.0 |
| Car Theft | 165 | 161.8 | 244.4 | 259.0 |
Source: FBI Uniform Crime Reporting (2024)
Cost of living in Yuma summary. We use data on the cost of living to determine how expensive it is to live in Yuma. Real estate prices drive most of the variance in cost of living around Arizona. Key points include:
The cost of living in Yuma is 100 with 100 being average.
The cost of living in Yuma is 1.0x lower than the national average.
The median home value in Yuma is $301,507.
The median income in Yuma is $65,482.
Yuma's Overall Cost Of Living
Lower Than The National Average
Cost Of Living In Yuma Comparison Table
| Living Expense | Yuma | Arizona | National Average |
|---|---|---|---|
| Overall | 100 | 100 | 100 |
| Services | 101 | 99 | 100 |
| Groceries | 101 | 99 | 100 |
| Health | 87 | 97 | 100 |
| Housing | 102 | 104 | 100 |
| Transportation | 114 | 113 | 100 |
| Utilities | 102 | 104 | 100 |
Source: Cost of living index, normalized to US average = 100
Yuma, AZ Weather
The average high in Yuma is 88.0° and the average low is 58.7°.
There are 8.8 days of precipitation each year.
Expect an average of 3.6 inches of precipitation each year with 0.0 inches of snow.
| Stat | Yuma |
|---|---|
| Average Annual High | 88.0 |
| Average Annual Low | 58.7 |
| Annual Precipitation Days | 8.8 |
| Average Annual Precipitation | 3.6 |
| Average Annual Snowfall | 0.0 |
Average High
Days of Rain
Source: NOAA climate normals (30-year)
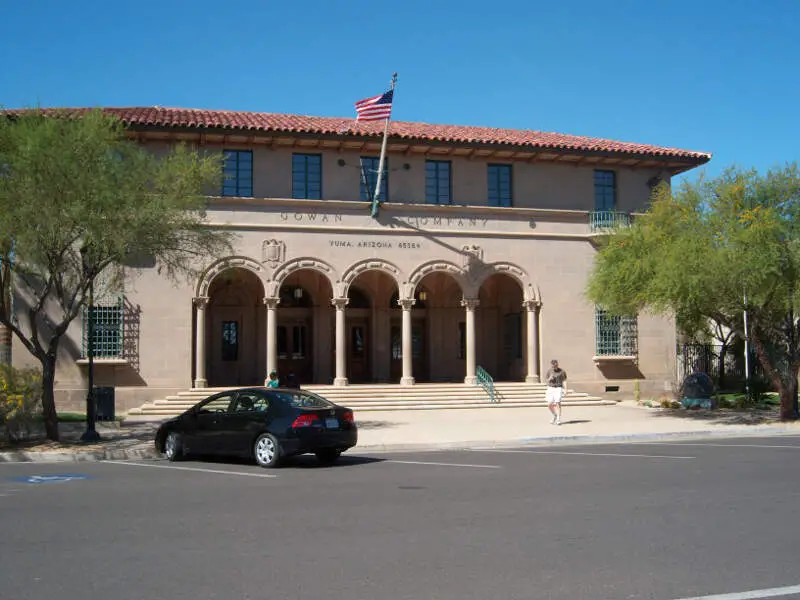
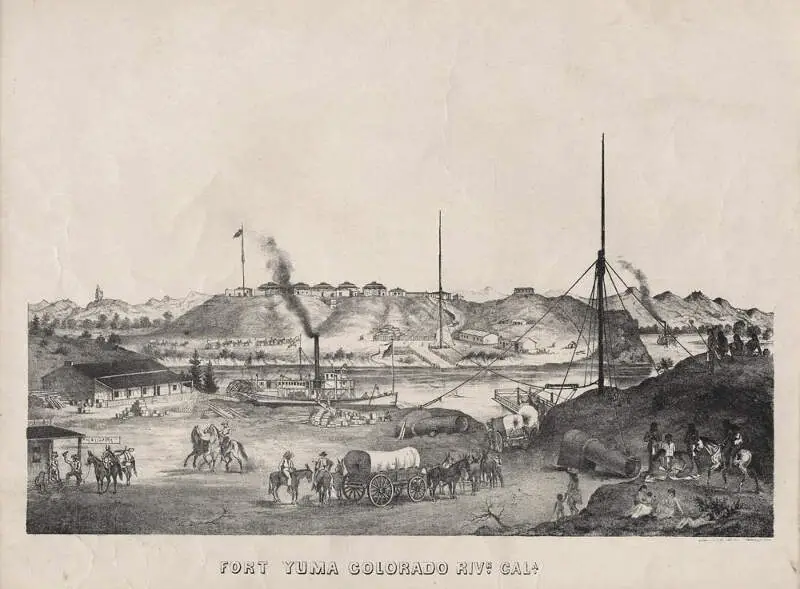
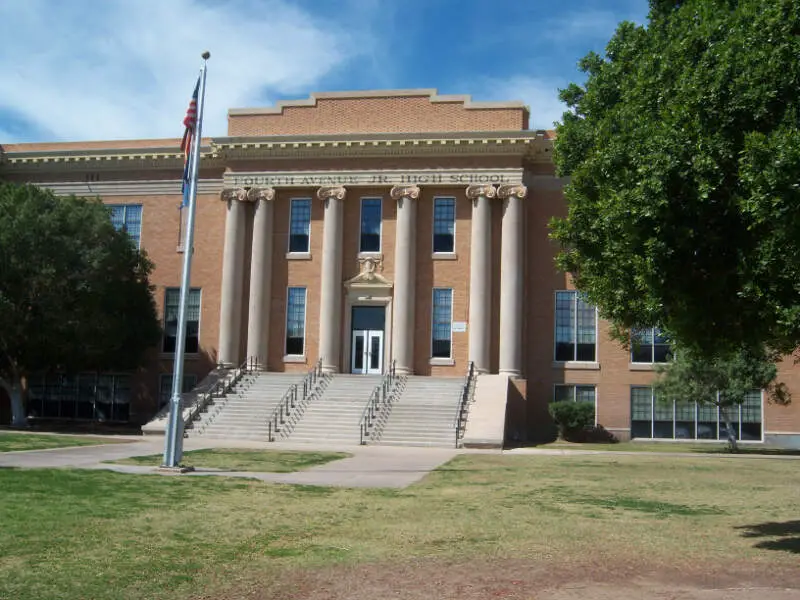
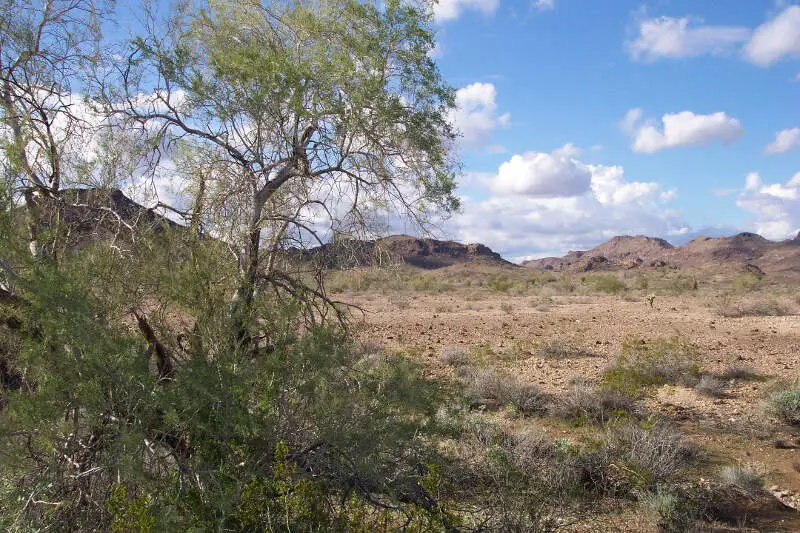
Yuma, AZ Photos
5 Reviews & Comments About Yuma

I lived in Yuma Az for About 1 year the schools were s**t and I passed out in the middle school and my desk looked like some put water on top of my head
I live in Yuma for almost 2 years. Only what I hate is the weather. I CAN'T STAND IT. People are nice and Yuma is close to important cities as San Diego and Nevada.
I was born and raised in Yuma it aint that bad.
actually I live in yuma & it's not that bad here
Crime toward the north and eastern part of Yuma appears to be non-existent. Overall, seems quite safe.
There are numerous activities especially from October through April. The Colorado River and desert hacking and off road activities are endless.
The restaurants are fair and there is a wide variety but, in need of nicer full service upper scale.
Rankings & Articles For Yuma


Locations Around Yuma
Map Of Yuma, AZ
Best Places Around Yuma
Fortuna Foothills, AZ
Population 28,896
Somerton, AZ
Population 14,574
San Luis, AZ
Population 37,337
Yuma Demographics And Statistics
Population over time in Yuma
The current population in Yuma is 100,139. The population has increased 9.8% from 2010.
| Year | Population | % Change |
|---|---|---|
| 2024 | 100,139 | 1.7% |
| 2023 | 98,461 | 2.2% |
| 2022 | 96,314 | 1.2% |
| 2021 | 95,154 | -2.3% |
| 2020 | 97,428 | 1.1% |
| 2019 | 96,349 | 0.8% |
| 2018 | 95,573 | 1.8% |
| 2017 | 93,851 | 0.2% |
| 2016 | 93,704 | -0.1% |
| 2015 | 93,812 | 0.8% |
| 2014 | 93,078 | 0.6% |
| 2013 | 92,492 | -1.4% |
| 2012 | 93,831 | 1.6% |
| 2011 | 92,367 | 1.3% |
| 2010 | 91,179 | - |
Race / Ethnicity in Yuma
See the full breakdown
Yuma is:
31.2% White with 31,204 White residents.
1.9% African American with 1,931 African American residents.
0.7% American Indian with 695 American Indian residents.
1.7% Asian with 1,708 Asian residents.
0.0% Hawaiian with 26 Hawaiian residents.
0.3% Other with 320 Other residents.
3.4% Two Or More with 3,364 Two Or More residents.
60.8% Hispanic with 60,891 Hispanic residents.
| Race | Yuma | AZ | USA |
|---|---|---|---|
| White | 31.2% | 52.6% | 57.4% |
| African American | 1.9% | 4.4% | 11.9% |
| American Indian | 0.7% | 3.2% | 0.5% |
| Asian | 1.7% | 3.5% | 5.9% |
| Hawaiian | 0.0% | 0.2% | 0.2% |
| Other | 0.3% | 0.5% | 0.6% |
| Two Or More | 3.4% | 4.4% | 4.3% |
| Hispanic | 60.8% | 31.4% | 19.3% |
Gender in Yuma
See the full breakdown
Yuma is 48.4% female with 48,432 female residents.
Yuma is 51.6% male with 51,706 male residents.
| Gender | Yuma | AZ | USA |
|---|---|---|---|
| Female | 48.4% | 50.1% | 50.5% |
| Male | 51.6% | 49.9% | 49.5% |
Highest level of educational attainment in Yuma for adults over 25
See the full breakdown
7.0% of adults in Yuma completed < 9th grade.
9.0% of adults in Yuma completed 9-12th grade.
29.0% of adults in Yuma completed high school / ged.
24.0% of adults in Yuma completed some college.
11.0% of adults in Yuma completed associate's degree.
13.0% of adults in Yuma completed bachelor's degree.
6.0% of adults in Yuma completed master's degree.
1.0% of adults in Yuma completed professional degree.
0.0% of adults in Yuma completed doctorate degree.
| Education | Yuma | AZ | USA |
|---|---|---|---|
| < 9th Grade | 7.0% | 6.0% | 4.0% |
| 9-12th Grade | 9.0% | 6.0% | 6.0% |
| High School / GED | 29.0% | 23.0% | 26.0% |
| Some College | 24.0% | 23.0% | 19.0% |
| Associate's Degree | 11.0% | 9.0% | 9.0% |
| Bachelor's Degree | 13.0% | 20.0% | 22.0% |
| Master's Degree | 6.0% | 9.0% | 10.0% |
| Professional Degree | 1.0% | 2.0% | 2.0% |
| Doctorate Degree | 0.0% | 2.0% | 2.0% |
Household Income For Yuma, Arizona
See the full breakdown
5.5% of households in Yuma earn Less than $10,000.
2.9% of households in Yuma earn $10,000 to $14,999.
8.0% of households in Yuma earn $15,000 to $24,999.
8.1% of households in Yuma earn $25,000 to $34,999.
12.3% of households in Yuma earn $35,000 to $49,999.
20.9% of households in Yuma earn $50,000 to $74,999.
13.9% of households in Yuma earn $75,000 to $99,999.
16.0% of households in Yuma earn $100,000 to $149,999.
6.6% of households in Yuma earn $150,000 to $199,999.
5.7% of households in Yuma earn $200,000 or more.
| Income | Yuma | AZ | USA |
|---|---|---|---|
| Less than $10,000 | 5.5% | 5.0% | 5.0% |
| $10,000 to $14,999 | 2.9% | 2.7% | 3.4% |
| $15,000 to $24,999 | 8.0% | 5.8% | 6.3% |
| $25,000 to $34,999 | 8.1% | 6.6% | 6.6% |
| $35,000 to $49,999 | 12.3% | 10.5% | 10.1% |
| $50,000 to $74,999 | 20.9% | 16.5% | 15.5% |
| $75,000 to $99,999 | 13.9% | 13.5% | 12.6% |
| $100,000 to $149,999 | 16.0% | 18.4% | 17.5% |
| $150,000 to $199,999 | 6.6% | 9.4% | 9.6% |
| $200,000 or more | 5.7% | 11.6% | 13.4% |
Source: U.S. Census ACS 5-year estimates (2024)


