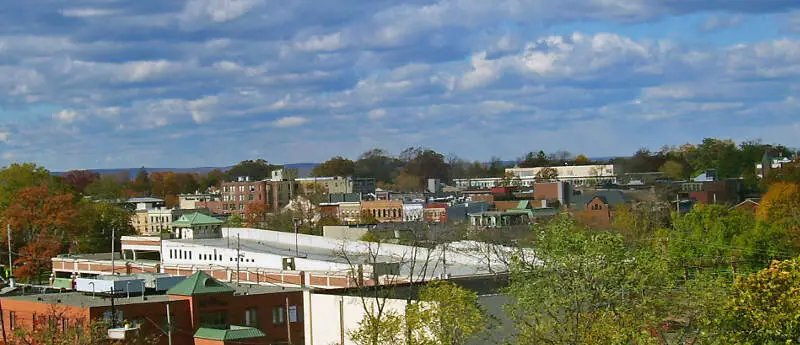
If your family loves pizza and bagels, then you should definitely live in New Jersey. And today’s your lucky day, because HomeSnacks is giving your family the ultimate life hack, we’ve created a list of the best places for families in New Jersey for 2026.
How did we determine New Jersey’s most family friendly places? We consulted the US Census on places in The Garden State with more than 10,000 residents. We looked at several factors: crime, education, family friendly activities, and the percent of households that currently have children. We ended up with 90 family friendly New Jersey places that any family would be lucky to call home. Matter of fact, if you ask any New Jerseyite, they will tell you that New Jersey is the best and that their corner of this Mid-Atlantic State is above the rest. They will also tell you that the state is great for families because they are one of the wealthiest states in the country. New Jersey not only has one of the highest median household incomes, but they have plenty of extra money to spend on the things that matter. Like, making their neighborhoods safe, their schools competitive, and their families happy, healthy, and entertained.
Speaking of family entertainment, when New Jersey families are ready for some fun in the sun, there is plenty of family friendly fun to be had. We think the best family day in New Jersey would go something like this: first, a trip to the freshest bagel shop in Jersey City; then, a ferry ride across the Newark Bay to shop ’til you drop in Elizabeth; followed up by a slice of ‘za’ in Linden’s Little Italy.
Want to know more? We suggest that you grab yourself a sunny spot at the Jersey Shore and read on.
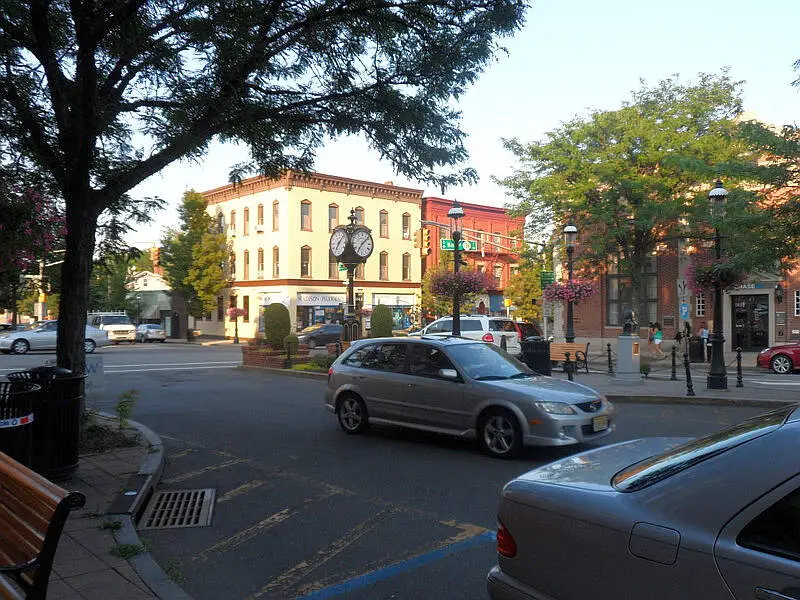
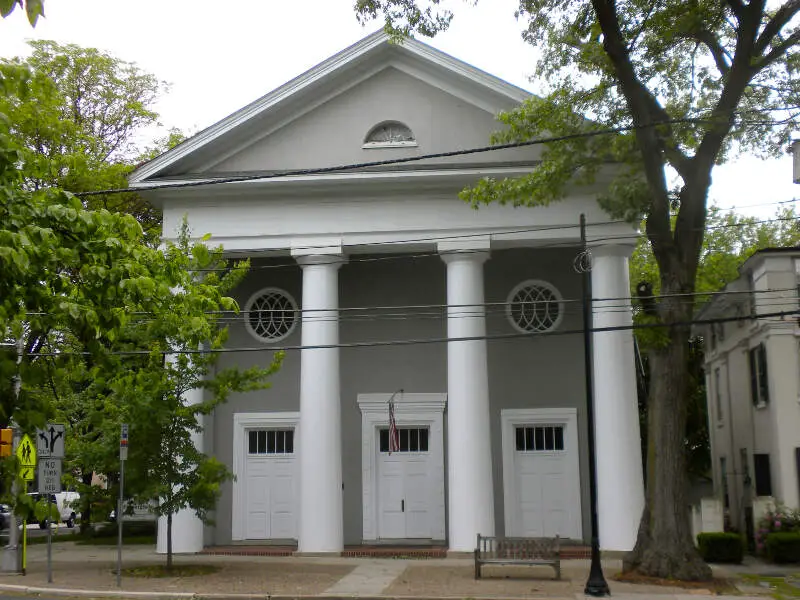
$171,471 median income · 36.1% households with kids
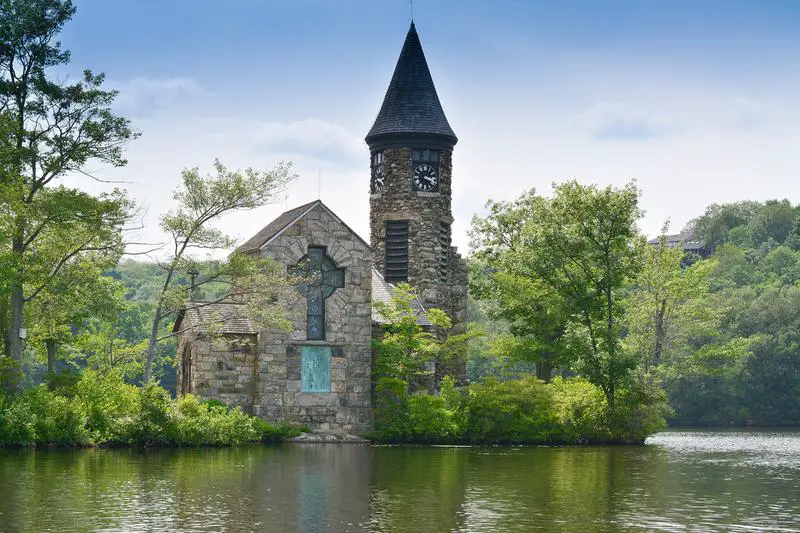
Madison is a borough in Morris County, New Jersey, United States. As of the 2010 United States Census, the population was 15,845, reflecting a drop in population of 685 from the 16,530 counted in the 2000 Census, which had in turn increased by 680 from the 15,850 counted in the 1990 Census. It is known as “The Rose City” and was named in honor of President James Madison.
Data | Crime | Cost of living | Movers
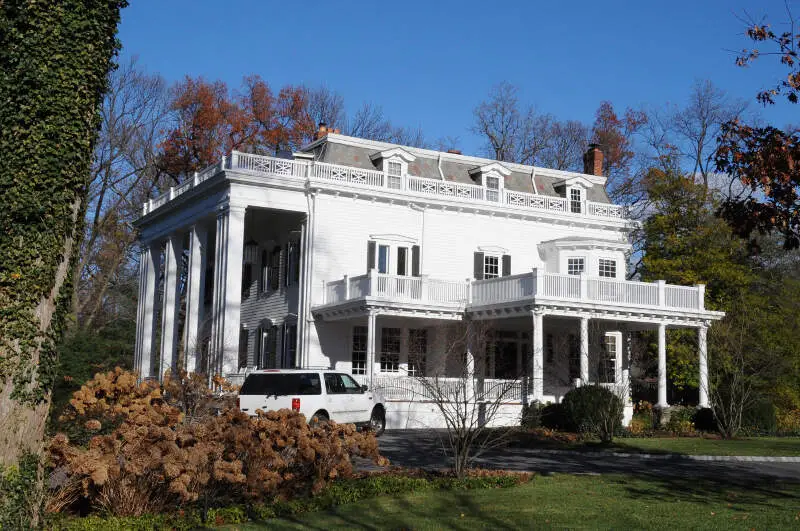
$215,096 median income · 51.9% households with kids
Glen Rock is a borough in Bergen County, New Jersey, United States. As of the 2010 United States Census, the borough’s population was 11,601, reflecting an increase of 55 from the 11,546 counted in the 2000 Census, which had in turn increased by 663 from the 10,883 counted in the 1990 Census.
Data | Crime | Cost of living | Movers
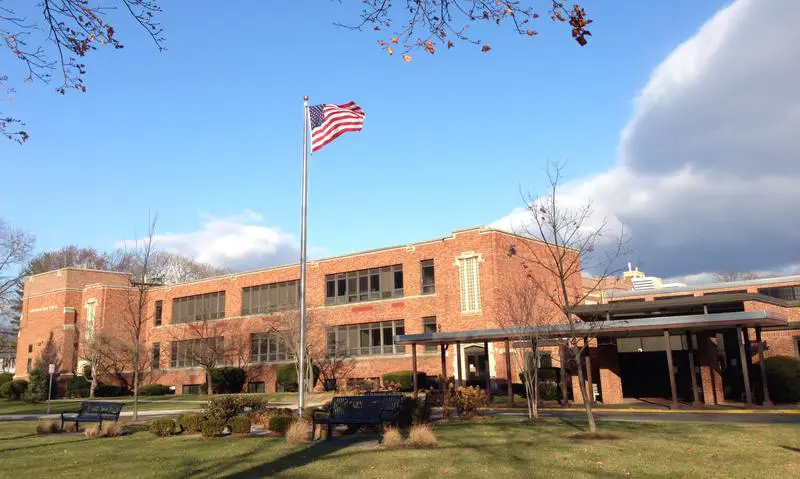
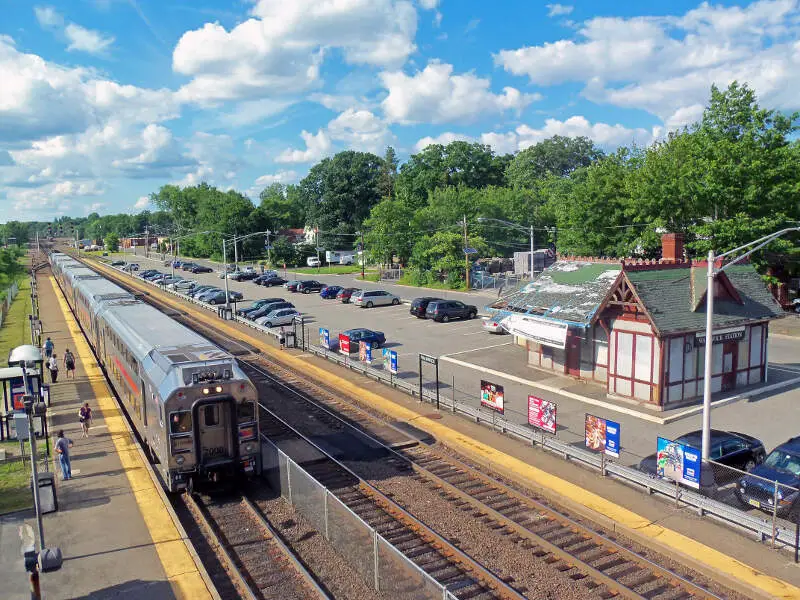
$232,629 median income · 43.8% households with kids
Westfield is a town in Union County of New Jersey, United States. As of the 2010 United States Census, the town’s population was 30,316, reflecting an increase of 672 from the 29,644 counted in the 2000 Census, which had in turn increased by 774 from the 28,870 counted in the 1990 Census. According to a 2014 nationwide survey, Westfield is considered to be the 30th-safest city to live in the United States.
Data | Crime | Cost of living | Movers
$208,200 median income · 51.1% households with kids
Data | Crime | Cost of living | Movers
$200,400 median income · 50.0% households with kids
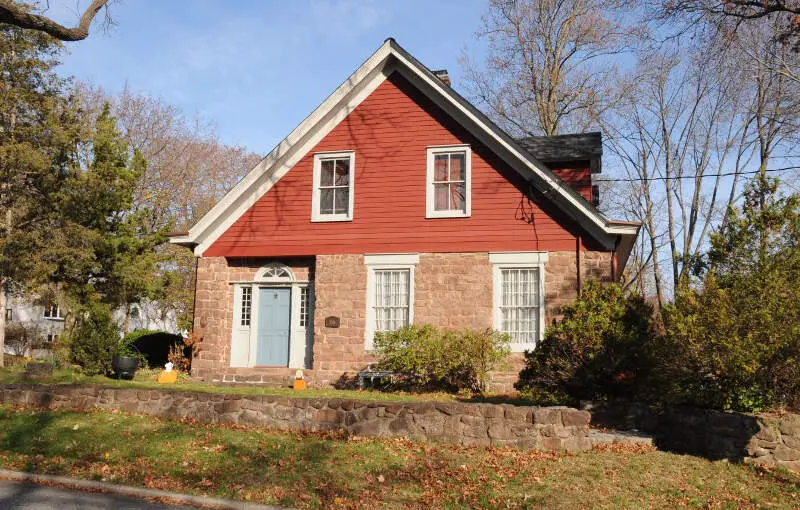
Haddonfield is a borough located in Camden County, New Jersey, United States. As of the 2010 United States Census, the borough had a total population of 11,593, reflecting a decline of 66 from the 11,659 counted in the 2000 Census, which had in turn increased by 31 from the 11,628 counted in the 1990 Census.
Data | Crime | Cost of living | Movers
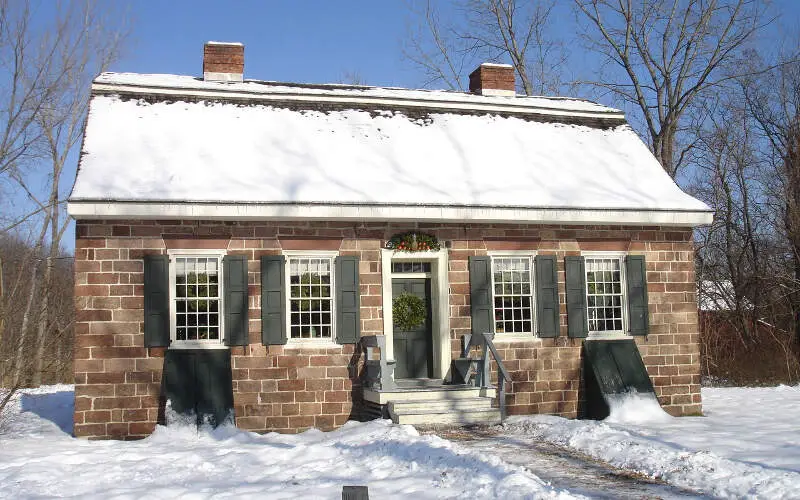
$177,962 median income · 37.9% households with kids
Waldwick is a borough in Bergen County, New Jersey, United States. As of the 2010 United States Census, the borough’s population was 9,625, reflecting an increase of 3 from the 9,622 counted in the 2000 Census, which had in turn declined by 135 from the 9,757 counted in the 1990 Census.
Data | Crime | Cost of living | Movers
$186,688 median income · 35.4% households with kids
Data | Crime | Cost of living | Movers
$159,028 median income · 35.6% households with kids
Data | Crime | Cost of living | Movers
$190,304 median income · 38.2% households with kids
Summit is a city in Union County, New Jersey, United States. At the 2010 United States Census, the city’s population was 21,457, reflecting an increase of 326 from the 21,131 counted in the 2000 Census, which had in turn increased by 1,374 from the 19,757 counted in the 1990 Census. Summit had the 16th-highest per capita income in the state as of the 2000 Census.
Data | Crime | Cost of living | Movers
$187,438 median income · 32.7% households with kids
Data | Crime | Cost of living | Movers
The receipts
Compare the top ten
Pick a metric. The bars rescale. The red line is New Jersey’s statewide median.
New Jersey statewide median: $103,556
New Jersey statewide median: $569,411
On the map
Where New Jersey’s most family-friendly cities are
Saturday Night Science
Methodology: How do you determine which place is best for families in New Jersey anyways?
To give you the places in New Jersey that are best for families, we must look at a handful of metrics. We want to measure the criteria people want in a family-friendly city utilizing Saturday Night Science.
After researching U.S. Census data produced for the state of New Jersey, we looked at the data for every single city in the state. We paid particular attention to:
- Crime (Both violent and property)
- Quality of local schools
- Distance to a major city without necessarily being in it
- % of households with children
- Family-friendly amenities nearby (museums, libraries, and colleges)
We then gave each city a “Family Score.”
The higher the score, the better the city is for families. We also limited our results to cities with over 10,000 people. For New Jersey, that meant a total of 90 cities.
We updated this article for 2026. This is our eleventh time ranking the best cities for families in New Jersey.
The full plate
Best Places For Families In New Jersey
Click any column to sort. Search by city name.
| Rank | City | Population | Median Income | Average Home Price | % Households w/ Kids |
|---|---|---|---|---|---|
| 1 | Madison | 16,447 | $171,471 | $990,723 | 36.1% |
| 2 | Glen Rock | 12,154 | $215,096 | $1,056,914 | 51.9% |
| 3 | Westfield | 31,111 | $232,629 | $1,269,853 | 43.8% |
| 4 | Tenafly | 15,319 | $208,200 | $1,262,422 | 51.1% |
| 5 | Haddonfield | 12,595 | $200,400 | $830,377 | 50.0% |
| 6 | Waldwick | 10,164 | $177,962 | $738,299 | 37.9% |
| 7 | Hillsdale | 10,144 | $186,688 | $843,788 | 35.4% |
| 8 | River Edge | 12,091 | $159,028 | $839,655 | 35.6% |
| 9 | Summit | 22,705 | $190,304 | $1,372,011 | 38.2% |
| 10 | Kinnelon | 10,013 | $187,438 | $836,759 | 32.7% |
| 11 | New Providence | 13,727 | $161,599 | $990,084 | 37.7% |
| 12 | Ridgewood | 26,308 | $208,211 | $1,200,489 | 43.6% |
| 13 | Westwood | 11,283 | $165,781 | $755,182 | 33.1% |
| 14 | Franklin Lakes | 11,084 | $235,795 | $1,557,852 | 41.2% |
| 15 | Paramus | 26,568 | $144,349 | $1,039,757 | 32.2% |
| 16 | Oakland | 12,768 | $162,019 | $750,020 | 36.8% |
| 17 | Metuchen | 15,144 | $158,052 | $683,090 | 37.6% |
| 18 | Ramsey | 14,805 | $160,996 | $863,404 | 35.5% |
| 19 | Ringwood | 11,657 | $152,414 | $596,571 | 26.6% |
| 20 | Hasbrouck Heights | 12,115 | $123,734 | $709,659 | 34.7% |
| 21 | Wood-Ridge | 10,218 | $136,108 | $709,508 | 30.6% |
| 22 | Rutherford | 18,894 | $143,153 | $738,683 | 34.7% |
| 23 | Dumont | 18,279 | $126,071 | $666,365 | 30.9% |
| 24 | Fair Lawn | 35,610 | $144,574 | $709,175 | 41.4% |
| 25 | Bergenfield | 28,450 | $130,045 | $629,539 | 36.2% |
| 26 | Florham Park | 13,564 | $158,696 | $1,025,256 | 27.3% |
| 27 | Maywood | 10,093 | $117,912 | $681,177 | 29.4% |
| 28 | Lincoln Park | 10,957 | $123,397 | $534,178 | 23.9% |
| 29 | Ridgefield | 11,498 | $118,059 | $778,380 | 31.4% |
| 30 | New Milford | 16,995 | $114,889 | $727,507 | 33.2% |
| 31 | Totowa | 10,959 | $113,563 | $659,952 | 35.0% |
| 32 | Roselle Park | 14,093 | $109,679 | $538,084 | 28.8% |
| 33 | Edgewater | 14,759 | $124,050 | $714,157 | 21.2% |
| 34 | South River | 16,124 | $96,147 | $528,552 | 37.1% |
| 35 | Hawthorne | 19,628 | $110,237 | $629,474 | 30.3% |
| 36 | South Plainfield | 24,473 | $130,239 | $583,003 | 34.9% |
| 37 | Ridgefield Park | 13,235 | $100,718 | $580,536 | 34.6% |
| 38 | Hoboken | 58,668 | $180,579 | $855,399 | 18.4% |
| 39 | Palisades Park | 20,290 | $94,743 | $987,743 | 24.0% |
| 40 | Woodland Park | 13,355 | $98,845 | $648,176 | 29.4% |
| 41 | Lodi | 26,082 | $89,305 | $619,465 | 31.6% |
| 42 | Wanaque | 11,206 | $113,175 | $507,937 | 21.7% |
| 43 | Englewood | 29,638 | $102,571 | $617,542 | 32.6% |
| 44 | Woodbury | 10,042 | $77,028 | $336,567 | 30.0% |
| 45 | Highland Park | 15,121 | $104,694 | $585,369 | 23.0% |
| 46 | Wallington | 11,889 | $85,862 | $673,350 | 30.6% |
| 47 | Rahway | 30,109 | $91,461 | $529,779 | 30.1% |
| 48 | Fort Lee | 40,067 | $107,274 | $588,321 | 22.8% |
| 49 | Red Bank | 12,862 | $97,477 | $693,365 | 20.9% |
| 50 | Cliffside Park | 25,781 | $93,452 | $645,671 | 23.1% |
| 51 | Carteret | 25,496 | $96,862 | $547,897 | 38.1% |
| 52 | Collingswood | 14,205 | $90,184 | $448,586 | 24.0% |
| 53 | Fairview | 15,099 | $63,606 | $654,535 | 33.7% |
| 54 | Plainfield | 55,236 | $85,908 | $511,835 | 47.3% |
| 55 | Hackensack | 46,057 | $84,277 | $465,836 | 20.9% |
| 56 | Dover | 18,563 | $73,737 | $507,729 | 36.0% |
| 57 | Secaucus | 21,778 | $139,821 | $662,670 | 27.8% |
| 58 | Point Pleasant | 19,334 | $115,625 | $733,630 | 29.0% |
| 59 | Elmwood Park | 21,412 | $101,740 | $616,473 | 32.6% |
| 60 | Hopatcong | 14,565 | $115,758 | $447,232 | 25.5% |
| 61 | Somerville | 13,410 | $103,760 | $542,519 | 25.7% |
| 62 | Clifton | 89,379 | $98,237 | $612,462 | 26.7% |
| 63 | New Brunswick | 56,345 | $65,810 | $442,985 | 35.5% |
| 64 | Garfield | 32,783 | $79,700 | $580,601 | 34.5% |
| 65 | Guttenberg | 11,754 | $75,683 | $416,701 | 28.5% |
| 66 | Paterson | 158,735 | $55,997 | $528,882 | 44.0% |
| 67 | Bellmawr | 11,737 | $76,654 | $310,586 | 29.4% |
| 68 | Roselle | 22,646 | $92,762 | $507,576 | 28.7% |
| 69 | Passaic | 70,002 | $55,371 | $552,682 | 44.9% |
| 70 | Glassboro | 23,717 | $87,278 | $365,942 | 21.6% |
| 71 | Phillipsburg | 15,299 | $68,324 | $336,548 | 27.1% |
| 72 | Elizabeth | 137,302 | $66,555 | $534,667 | 40.2% |
| 73 | West New York | 52,004 | $71,729 | $463,006 | 29.6% |
| 74 | Beachwood | 11,088 | $106,858 | $462,369 | 28.8% |
| 75 | Perth Amboy | 55,855 | $61,977 | $495,686 | 39.2% |
| 76 | Harrison | 20,369 | $93,013 | $580,130 | 22.1% |
| 77 | Long Branch | 32,530 | $79,653 | $795,839 | 25.7% |
| 78 | Newark | 310,178 | $52,060 | $478,455 | 34.5% |
| 79 | Trenton | 90,338 | $52,537 | $345,376 | 31.7% |
| 80 | North Plainfield | 22,809 | $87,349 | $491,909 | 31.0% |
| 81 | Bridgeton | 27,001 | $55,781 | $253,951 | 48.8% |
| 82 | Vineland | 61,006 | $67,860 | $304,968 | 34.9% |
| 83 | Hammonton | 14,840 | $78,087 | $373,850 | 30.9% |
| 84 | Manville | 10,921 | $93,333 | $476,361 | 24.6% |
| 85 | East Orange | 70,090 | $60,830 | $474,293 | 28.4% |
| 86 | Pine Hill | 10,802 | $72,588 | $277,793 | 31.1% |
| 87 | Millville | 27,511 | $70,275 | $252,661 | 24.9% |
| 88 | Pleasantville | 20,712 | $53,661 | $241,645 | 35.8% |
| 89 | Lindenwold | 21,719 | $55,954 | $265,330 | 29.3% |
| 90 | Somers Point | 10,515 | $71,062 | $419,053 | 21.4% |
Source: U.S. Census data via Saturday Night Science. 90 New Jersey cities with more than 10,000 residents.
Summary
Summary: The Best Places To Raise A Family In New Jersey
If you’re looking for a breakdown of cities in New Jersey ranked by criteria that most agree make a place a great spot for families, this is an accurate list.
The best places for families in New Jersey are Madison, Glen Rock, Westfield, Tenafly, Haddonfield, Waldwick, Hillsdale, River Edge, Summit, and Kinnelon.


