You might think that the whole hippie movement has faded away, but the truth is, there are plenty of hippies out there in Ohio.
While they aren’t necessarily in your face all the time with war protests, and the next Woodstock isn’t being planned any time soon, we thought it would be fun to look at which cities in the Buckeye State where the most hippies would live.
And, after crunching the data, you know what? It was spot on.
How do you decide where the most hippies live? By the number of yoga studios, organic markets, and most importantly, where the liberals live in droves.
Using those criteria, it’s not hard to scrape the internet, run some scientific data on where hippies might live in Ohio, and then put out a list.
So, put on your tie-dye shirt and sandals as you go through this list with us.
Table Of Contents: Top Ten | Methodology | Summary | Table
The 10 Cities In Ohio With The Largest Hispanic Population For 2026
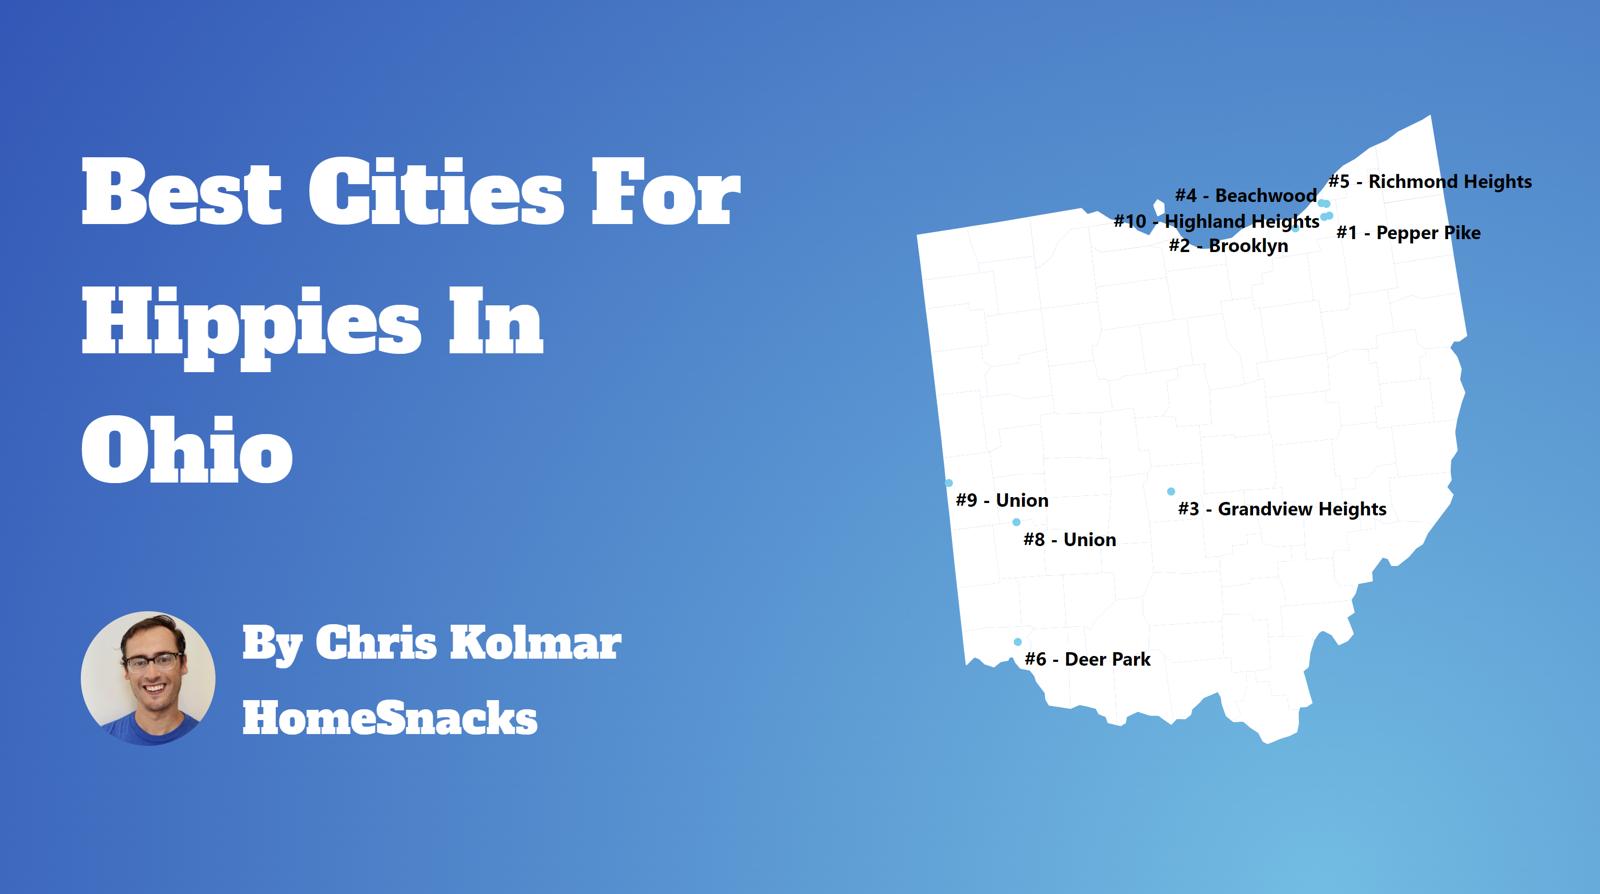
What’s the hippiest city in Ohio? The hippiest city in Ohio is Pepper Pike.
Read on below to see where your town ranked, Young Flower Child.

/10
Population: 6,079
% Liberal: 69.4%
More on Pepper Pike: Data | Crime | Cost Of Living | Movers

/10
Population: 11,047
% Liberal: 69.4%
More on Brooklyn: Data | Crime | Cost Of Living | Movers

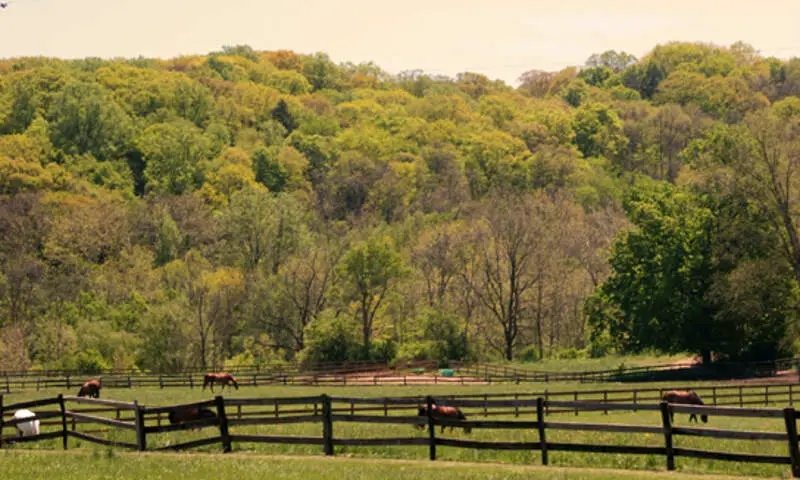
/10
Population: 6,836
% Liberal: 60.7%
More on Grandview Heights: Data | Crime | Cost Of Living | Movers

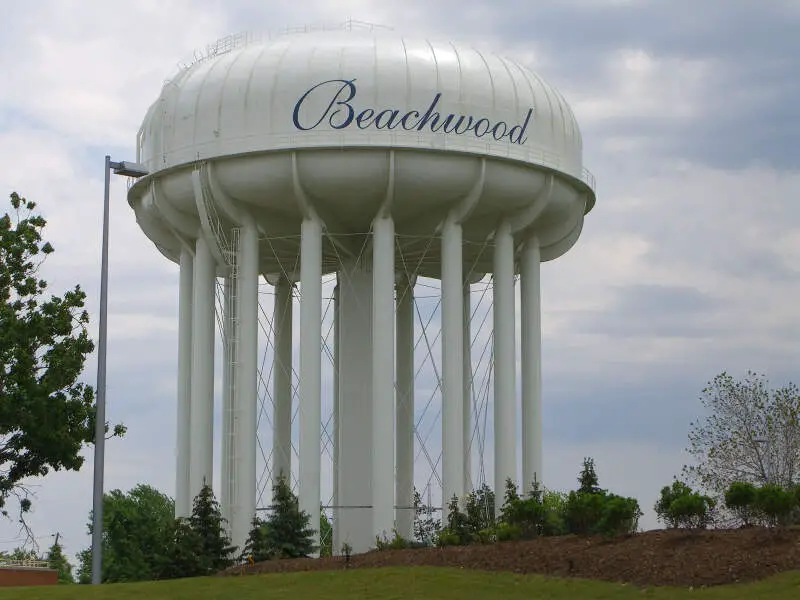
/10
Population: 11,855
% Liberal: 69.4%
More on Beachwood: Data | Crime | Cost Of Living | Movers

/10
Population: 10,508
% Liberal: 69.4%
More on Richmond Heights: Data | Crime | Cost Of Living | Movers

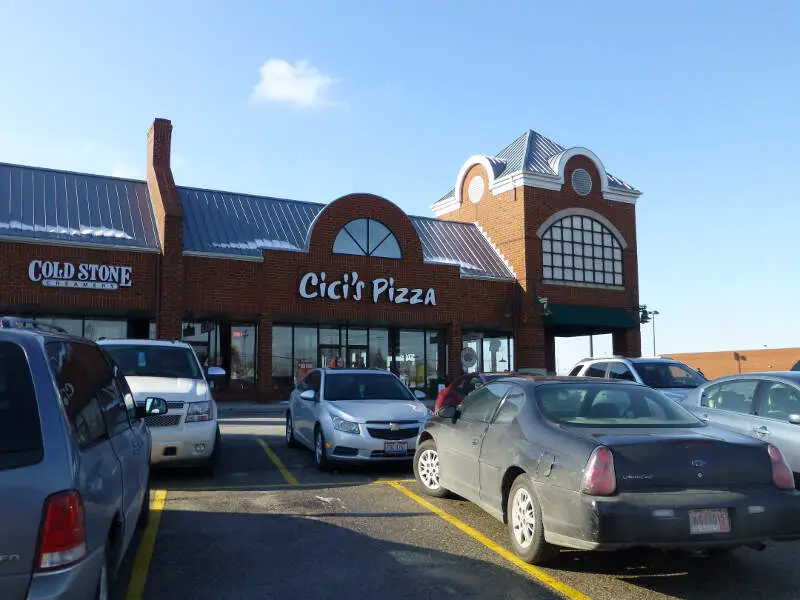
/10
Population: 5,720
% Liberal: 52.5%
More on Deer Park: Data | Crime | Cost Of Living | Movers

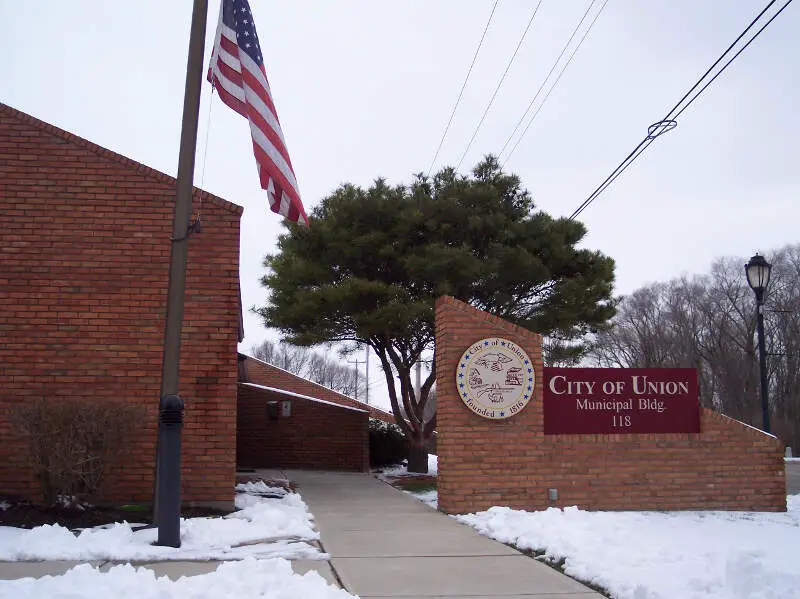
/10
Population: 6,425
% Liberal: 51.5%
More on Union: Data | Cost Of Living | Movers

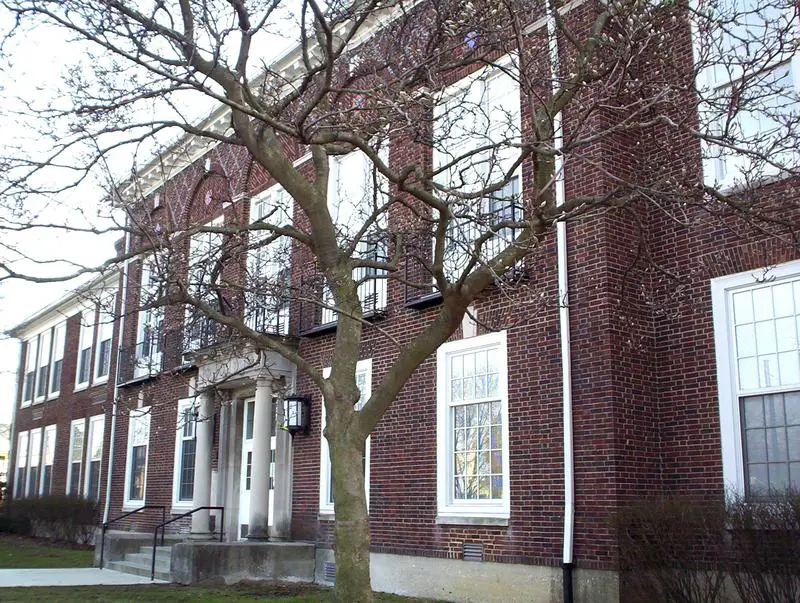
/10
Population: 8,324
% Liberal: 69.4%
More on Highland Heights: Data | Crime | Cost Of Living | Movers

/10
Population: 13,404
% Liberal: 69.4%
More on University Heights: Data | Crime | Cost Of Living | Movers

/10
Population: 13,727
% Liberal: 60.7%
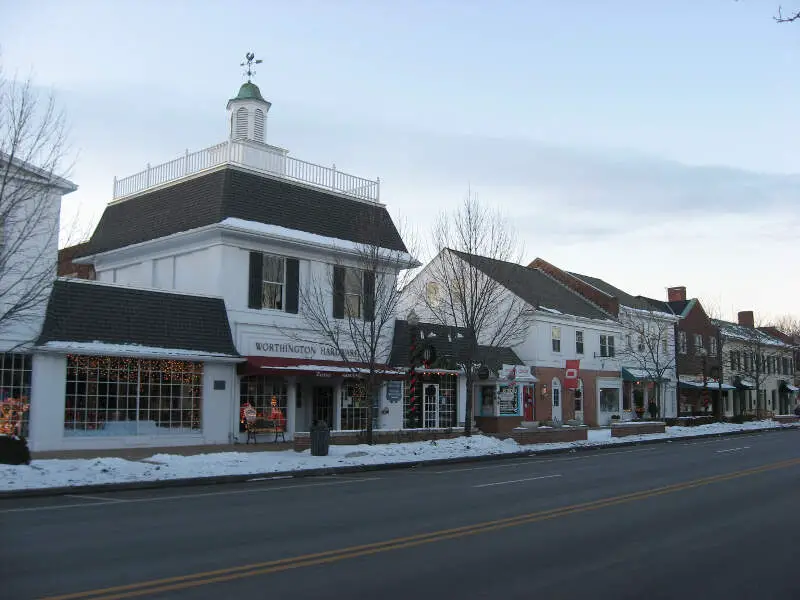
More on Worthington: Data | Crime | Cost Of Living | Movers
Methodology: How we determined the most beatnik city in Ohio
In order to rank the best cities for hippies in Ohio, we used Saturday Night Science to determine what criteria defines a hippie.
We threw a lot of criteria at this one in order to get the best, most complete results possible. Using the Google Places API, the Census’s 2020-2024 American Community Survey, and Voter Registration data, this is the criteria we used:
- Number of yoga studios per capita
- Number of organic markets per capita
- Number of pet adoption centers per capita
- Number of vegan restaurants per capita
- Number of thrift stores per capita
- Each city’s liberal voting population
For the sake of getting reliable numbers on places, we counted any place within a ~4.5 mile radius of a city’s center. The average city in the United States is about 18 square miles.
All of these results are listed in a per capita basis, meaning number of stores per person in a city. Additionally, we limited the analysis to non-CDPs that have over 5,000 people.
We ranked each place with scores from 1 to 260 in each category, where 1 was the most hippie.
Next, we averaged the rankings for each place to create a hippie index.
And finally, we crowned the city with the highest hippie index the “Best City for Hippies In Ohio.” We’re looking at you, Pepper Pike.
Read on below to learn more about what it’s like to live in hippie central. Or skip to the end to see the list of all the places in the state from hippiest to most square.
Summary: The Hippies Of Ohio
If you’re measuring the locations in Ohio where there are lots of liberals, and there are many options for vegan food, yoga and thrift stores, this is an accurate list.
The most hippie cities in Ohio are Pepper Pike, Brooklyn, Grandview Heights, Beachwood, Richmond Heights, Deer Park, Union, Highland Heights, University Heights, and Worthington.
If you’re curious, here are the most square places in Ohio:
- Mason
- Galion
- Delphos
For more Ohio reading, check out:
- Best Places To Live In Ohio
- Cheapest Places To Live In Ohio
- Best Places To Raise A Family In Ohio
- Richest Cities In Ohio
- Safest Places In Ohio
Detailed List Of The Most Hippie Cities In Ohio
| Rank | City | Population | % Liberal |
|---|---|---|---|
| 1 | Pepper Pike | 6,079 | 69.4% |
| 2 | Brooklyn | 11,047 | 69.4% |
| 3 | Grandview Heights | 6,836 | 60.7% |
| 4 | Beachwood | 11,855 | 69.4% |
| 5 | Richmond Heights | 10,508 | 69.4% |
| 6 | Deer Park | 5,720 | 52.5% |
| 7 | Union | 6,425 | 51.5% |
| 8 | Highland Heights | 8,324 | 69.4% |
| 9 | University Heights | 13,404 | 69.4% |
| 10 | Worthington | 13,727 | 60.7% |
| 11 | Madeira | 8,801 | 52.5% |
| 12 | Olmsted Falls | 8,943 | 69.4% |
| 13 | Lyndhurst | 13,856 | 69.4% |
| 14 | Munroe Falls | 5,037 | 57.2% |
| 15 | Warrensville Heights | 13,387 | 69.4% |
| 16 | Independence | 7,136 | 69.4% |
| 17 | Bedford Heights | 10,680 | 69.4% |
| 18 | Seven Hills | 11,735 | 69.4% |
| 19 | Fairview Park | 16,625 | 69.4% |
| 20 | Oakwood | 9,150 | 51.5% |
| 21 | Montgomery | 10,332 | 52.5% |
| 22 | Middleburg Heights | 15,823 | 69.4% |
| 23 | South Euclid | 22,052 | 69.4% |
| 24 | Reading | 10,357 | 52.5% |
| 25 | Fairlawn | 7,430 | 57.2% |
| 26 | Wyoming | 8,404 | 52.5% |
| 27 | East Cleveland | 17,619 | 69.4% |
| 28 | Norwood | 19,170 | 52.5% |
| 29 | Blue Ash | 12,124 | 52.5% |
| 30 | Maumee | 14,148 | 65.0% |
| 31 | Campbell | 8,127 | 63.5% |
| 32 | Moraine | 6,333 | 51.5% |
| 33 | Rossford | 6,434 | 51.3% |
| 34 | Brook Park | 19,027 | 69.4% |
| 35 | Greenville | 13,121 | 26.9% |
| 36 | Shaker Heights | 28,071 | 69.4% |
| 37 | Struthers | 10,574 | 63.5% |
| 38 | Bexley | 13,286 | 60.7% |
| 39 | Mayfield Heights | 18,973 | 69.4% |
| 40 | Rocky River | 20,145 | 69.4% |
| 41 | Berea | 19,044 | 69.4% |
| 42 | North College Hill | 9,366 | 52.5% |
| 43 | Sharonville | 13,836 | 52.5% |
| 44 | Upper Arlington | 34,191 | 60.7% |
| 45 | Mentor-On-The-Lake | 7,430 | 48.7% |
| 46 | Mount Healthy | 6,061 | 52.5% |
| 47 | Oakwood | 9,150 | 51.5% |
| 48 | Ontario | 6,160 | 39.3% |
| 49 | Parma Heights | 20,490 | 69.4% |
| 50 | Loveland | 12,425 | 52.5% |
| 51 | Groveport | 5,535 | 60.7% |
| 52 | Milford | 6,748 | 31.6% |
| 53 | Sylvania | 18,923 | 65.0% |
| 54 | Tallmadge | 17,463 | 57.2% |
| 55 | New Albany | 8,169 | 60.7% |
| 56 | Cheviot | 8,330 | 52.5% |
| 57 | Bellbrook | 7,035 | 38.6% |
| 58 | Springdale | 11,201 | 52.5% |
| 59 | Sheffield Lake | 9,090 | 56.9% |
| 60 | Oberlin | 8,368 | 56.9% |
| 61 | Willoughby Hills | 9,446 | 48.7% |
| 62 | Maple Heights | 22,880 | 69.4% |
| 63 | Girard | 9,799 | 60.6% |
| 64 | Canal Winchester | 7,334 | 60.7% |
| 65 | Riverside | 25,143 | 51.5% |
| 66 | Cleveland Heights | 45,657 | 69.4% |
| 67 | North Olmsted | 32,374 | 69.4% |
| 68 | Granville | 5,689 | 42.0% |
| 69 | North Canton | 17,437 | 49.3% |
| 70 | Bedford | 12,927 | 69.4% |
| 71 | Broadview Heights | 19,309 | 69.4% |
| 72 | Heath | 10,381 | 42.0% |
| 73 | Gahanna | 33,786 | 60.7% |
| 74 | Lexington | 5,706 | 39.3% |
| 75 | Belpre | 6,431 | 39.5% |
| 76 | Centerville | 23,986 | 51.5% |
| 77 | Whitehall | 18,383 | 60.7% |
| 78 | Norton | 12,052 | 57.2% |
| 79 | Avon | 21,783 | 56.9% |
| 80 | Powell | 12,012 | 37.8% |
| 81 | Macedonia | 11,364 | 57.2% |
| 82 | Westlake | 32,513 | 69.4% |
| 83 | Solon | 23,177 | 69.4% |
| 84 | Amherst | 12,080 | 56.9% |
| 85 | Brecksville | 13,543 | 69.4% |
| 86 | Lakewood | 51,434 | 69.4% |
| 87 | Athens | 24,151 | 66.2% |
| 88 | Pickerington | 19,014 | 41.5% |
| 89 | Canfield | 7,443 | 63.5% |
| 90 | Martins Ferry | 6,850 | 44.9% |
| 91 | Forest Park | 18,685 | 52.5% |
| 92 | North Royalton | 30,353 | 69.4% |
| 93 | Hilliard | 30,815 | 60.7% |
| 94 | Garfield Heights | 28,492 | 69.4% |
| 95 | Franklin | 11,817 | 29.6% |
| 96 | St. Clairsville | 5,151 | 44.9% |
| 97 | Eastlake | 18,448 | 48.7% |
| 98 | Perrysburg | 21,122 | 51.3% |
| 99 | Avon Lake | 22,881 | 56.9% |
| 100 | Dublin | 42,378 | 60.7% |


