Are you looking for love in Minnesota?
Or are you just hoping to hook up with a hot Minnesotan?
Either way, we’ve got you covered here.
If you live in Minnesota, there’s a pretty good chance there are a lot of singles in your area. The North Star State has plenty of people over 18 who aren’t married or in a serious relationship.
That’s great news for people who are single and looking to mingle.
So, where are the best cities for singles in Minnesota? We used Saturday Night Science to find out.
33.4 median age · 14.0% married households
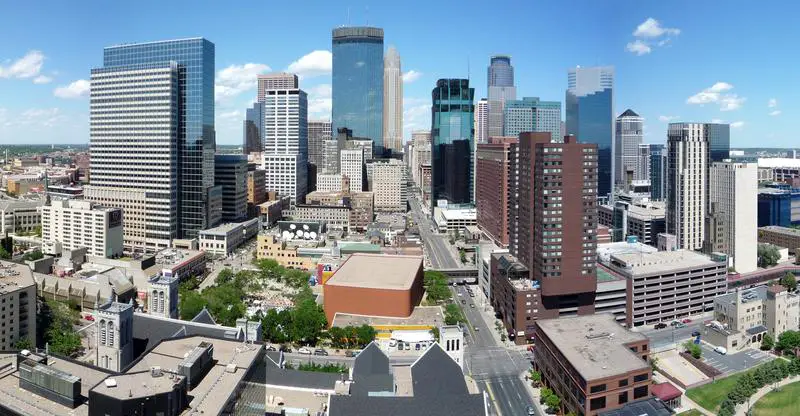
Minneapolis ) is the county seat of Hennepin County, and the larger of the Twin Cities, the 16th-largest metropolitan area in the United States. As of 2016, Minneapolis is the largest city in the state of Minnesota and 46th-largest in the United States, with an estimated population of 413,651. The Twin Cities metropolitan area consists of Minneapolis, its neighbor Saint Paul, and suburbs which together contain about 3.5 million people, the second-largest economic center in the Midwest, after Chicago.
Data | Crime | Cost of living | Movers
36.8 median age · 17.0% married households
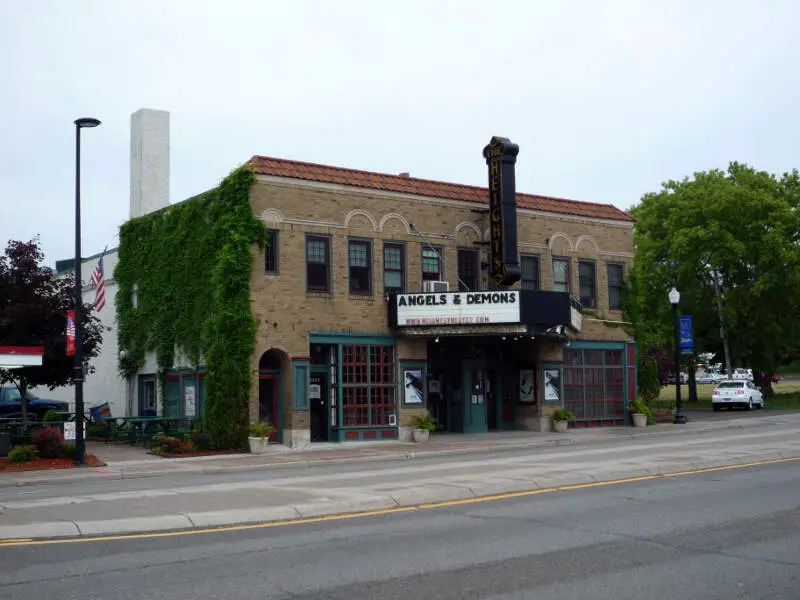
Columbia Heights is a city in Anoka County, Minnesota, United States. The population was 19,496 at the 2010 census.
Data | Crime | Cost of living | Movers
33.7 median age · 15.0% married households
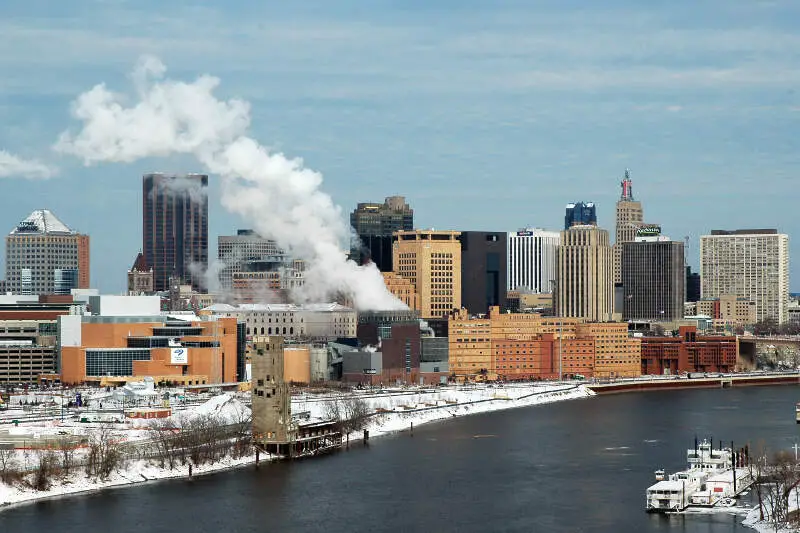
Saint Paul is the capital and second-most populous city of the U.S. state of Minnesota. As of 2016, the city’s estimated population was 304,442. Saint Paul is the county seat of Ramsey County, the smallest and most densely populated county in Minnesota. The city lies mostly on the east bank of the Mississippi River in the area surrounding its point of confluence with the Minnesota River, and adjoins Minneapolis, the state’s largest city. Known as the “Twin Cities”, the two form the core of Minneapolis-Saint Paul, the 16th-largest metropolitan area in the United States, with about 3.52 million residents.
Data | Crime | Cost of living | Movers
26.5 median age · 21.0% married households
Mankato is a city in Blue Earth, Nicollet, and Le Sueur counties in the state of Minnesota. It is the 22nd biggest city in Minnesota. The population was 41,044 according to 2015 US census estimates, making it the fifth largest city in Minnesota outside the Minneapolis-Saint Paul metropolitan area. The county seat of Blue Earth County, it is located along a large bend of the Minnesota River at its confluence with the Blue Earth River. Mankato is across the Minnesota River from North Mankato. Mankato and North Mankato have a combined population of over 53,000, according to the 2010 census. It completely encompasses the town of Skyline. North of Mankato Regional Airport, a tiny non-contiguous part of the city is located within Le Sueur County. Most of the city of Mankato is located within Blue Earth County.
Data | Crime | Cost of living | Movers
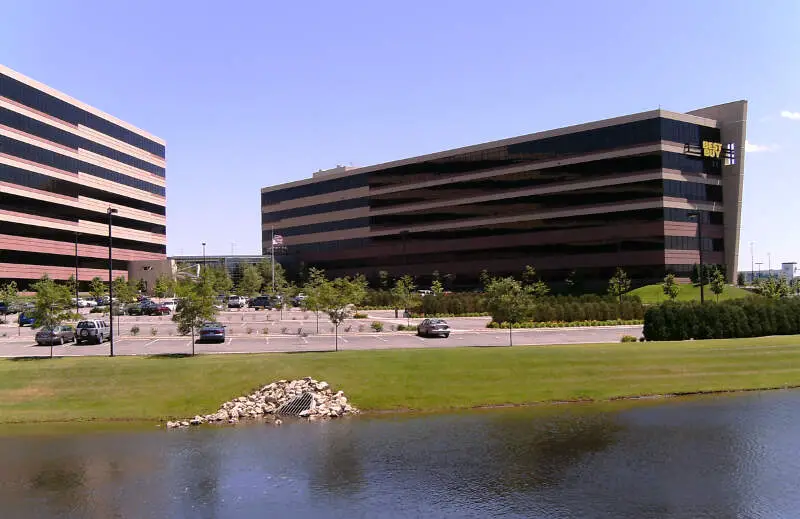
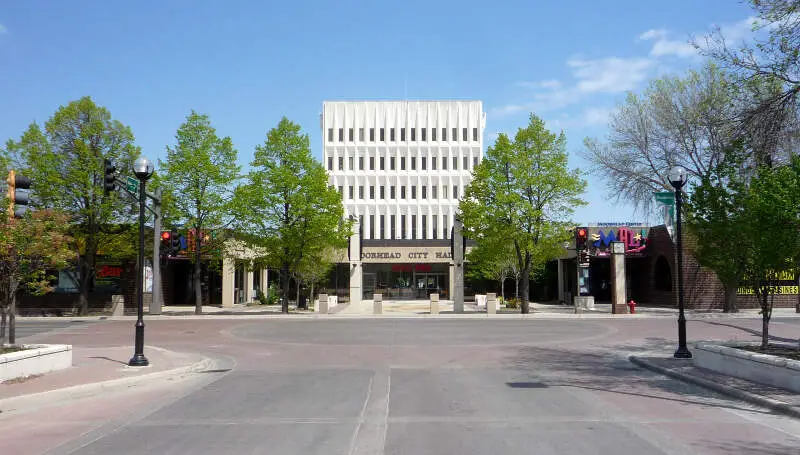
39.4 median age · 23.0% married households
Richfield is a city in Hennepin County, Minnesota, United States. An inner-ring suburb of the Minneapolis-Saint Paul region, it is bordered by Minneapolis to the north, Minneapolis-Saint Paul International Airport to the east, Bloomington to the south, and Edina to the west. Best Buy, the U.S.’s largest electronics retailer, has its headquarters in Richfield. The population was 35,228 at the 2010 census.
Data | Crime | Cost of living | Movers
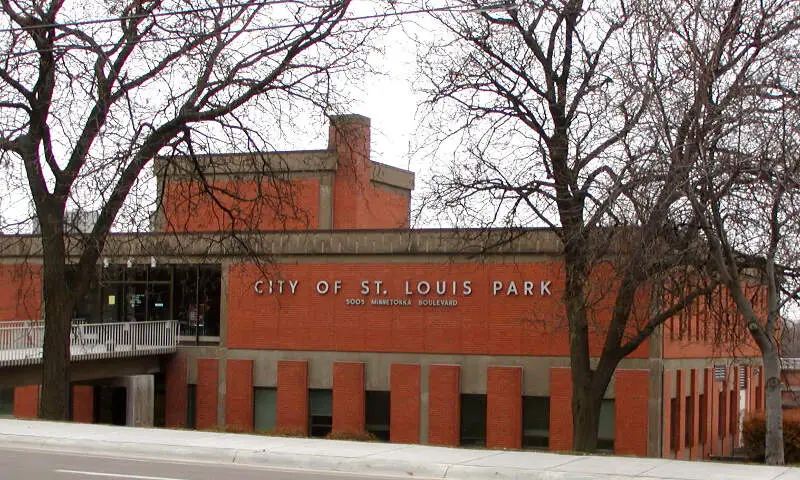
36.1 median age · 22.0% married households
Saint Louis Park is a city in Hennepin County, Minnesota, United States. The population was 45,250 at the 2010 census. It is a first-ring suburb immediately west of Minneapolis. Other adjacent cities include Edina, Golden Valley, Minnetonka, Plymouth, and Hopkins.
Data | Crime | Cost of living | Movers
31.3 median age · 18.0% married households
Data | Crime | Cost of living | Movers
39.4 median age · 27.0% married households
Robbinsdale is a city in Hennepin County, Minnesota, United States. The population was 13,953 at the 2010 census.
Data | Crime | Cost of living | Movers
37.7 median age · 28.0% married households
Data | Crime | Cost of living | Movers
35.2 median age · 25.0% married households
North Saint Paul is a city in Ramsey County, Minnesota, located east-northeast of the city of Saint Paul. The population was 11,460 at the 2010 census.
Data | Crime | Cost of living | Movers
The receipts
Compare the top ten
Pick a metric. The bars rescale. The red line is Minnesota’s statewide median.
On the map
Where Minnesota’s singles cluster
Saturday Night Science
Methodology: How do you determine which city is best for singles in Minnesota anyways?
To give you the places in Minnesota which are best for singles to find one another, we used Saturday Night Science to look at a handful of metrics. Of course, we want to measure the type of people who live in each city and make some assumptions about what single people like.
So we researched the internet for a database that contains all that information.
We threw a lot of criteria at this one to get the best, most complete results possible. Using the 2020-2024 American Community Survey Census data produced for the state of Minnesota, we looked at every single city in the state. We paid particular attention to:
- Population density
- % of population that’s male vs. female (closer to a 50-50 ratio is better)
- % of households with kids
- Median age
- Number of unmarried people in each city
We then gave each city a “Singles Score.”
The higher the score, the better the city is for singles to find one another. We also limited our results to cities with over 10,000 people. For Minnesota, that meant a total of 101 cities.
We updated this article for 2026. This is our eleventh time ranking the best cities for singles in Minnesota.
Read on to see why Minneapolis is the talk of the town while Ham Lake is probably a bit on the bland side.
The full plate
Best Cities For Singles In Minnesota
Click any column to sort. Search by city name.
| Rank | City | Singles Score | Population | Median Age | % Married Households | % Households w/ Kids |
|---|---|---|---|---|---|---|
| 1 | Minneapolis | 10.30 | 427,246 | 33.4 | 14.0% | 20.6% |
| 2 | Columbia Heights | 14.50 | 22,155 | 36.8 | 17.0% | 26.1% |
| 3 | St. Paul | 16.40 | 307,284 | 33.7 | 15.0% | 26.3% |
| 4 | Mankato | 18.50 | 45,473 | 26.5 | 21.0% | 21.9% |
| 5 | Richfield | 18.70 | 36,642 | 39.4 | 23.0% | 22.1% |
| 6 | St. Louis Park | 21.20 | 49,594 | 36.1 | 22.0% | 18.7% |
| 7 | Moorhead | 23.80 | 45,036 | 31.3 | 18.0% | 27.9% |
| 8 | Robbinsdale | 24.30 | 14,234 | 39.4 | 27.0% | 25.1% |
| 9 | Crystal | 28.00 | 22,476 | 37.7 | 28.0% | 25.5% |
| 10 | North St. Paul | 29.80 | 12,570 | 35.2 | 25.0% | 32.0% |
| 11 | Duluth | 30.00 | 87,093 | 35.2 | 25.0% | 22.2% |
| 12 | Brooklyn Park | 30.10 | 83,876 | 35.2 | 19.0% | 40.3% |
| 13 | Winona | 30.40 | 26,009 | 31.3 | 18.0% | 15.4% |
| 14 | St. Cloud | 30.90 | 70,629 | 30.6 | 20.0% | 28.4% |
| 15 | Hopkins | 30.90 | 18,819 | 37.8 | 18.0% | 19.8% |
| 16 | St. Peter | 31.70 | 12,185 | 35.6 | 20.0% | 26.8% |
| 17 | Little Canada | 31.80 | 10,514 | 40.4 | 21.0% | 28.1% |
| 18 | Northfield | 31.90 | 20,742 | 28.2 | 19.0% | 27.1% |
| 19 | New Brighton | 32.30 | 22,710 | 37.0 | 26.0% | 29.5% |
| 20 | Fridley | 32.40 | 30,241 | 34.7 | 24.0% | 30.7% |
| 21 | Brooklyn Center | 33.20 | 32,479 | 33.5 | 14.0% | 35.5% |
| 22 | Austin | 34.40 | 26,358 | 36.2 | 24.0% | 35.1% |
| 23 | Bemidji | 34.50 | 15,569 | 30.0 | 18.0% | 24.6% |
| 24 | South St. Paul | 34.90 | 20,611 | 37.2 | 29.0% | 28.1% |
| 25 | Oakdale | 37.00 | 28,585 | 39.7 | 30.0% | 28.0% |
| 26 | Eagan | 37.30 | 68,000 | 39.3 | 26.0% | 29.0% |
| 27 | Burnsville | 37.90 | 64,463 | 36.7 | 21.0% | 27.8% |
| 28 | Rochester | 41.80 | 122,330 | 36.3 | 22.0% | 28.5% |
| 29 | West St. Paul | 41.80 | 21,382 | 39.8 | 24.0% | 22.4% |
| 30 | Worthington | 42.70 | 13,780 | 33.5 | 13.0% | 34.7% |
| 31 | Roseville | 43.10 | 35,802 | 41.1 | 26.0% | 22.7% |
| 32 | Coon Rapids | 43.30 | 63,468 | 39.0 | 27.0% | 30.0% |
| 33 | Anoka | 43.60 | 17,970 | 40.6 | 30.0% | 30.0% |
| 34 | Maplewood | 45.50 | 40,695 | 39.5 | 24.0% | 26.8% |
| 35 | Albert Lea | 45.90 | 18,330 | 44.3 | 28.0% | 24.3% |
| 36 | Bloomington | 46.90 | 88,665 | 41.1 | 27.0% | 24.0% |
| 37 | White Bear Lake | 47.10 | 23,908 | 41.9 | 29.0% | 23.9% |
| 38 | Stillwater | 48.60 | 19,355 | 42.5 | 30.0% | 28.7% |
| 39 | Blaine | 48.80 | 72,488 | 37.5 | 30.0% | 37.4% |
| 40 | New Hope | 49.50 | 21,181 | 40.5 | 21.0% | 31.7% |
| 41 | Apple Valley | 49.70 | 55,679 | 39.0 | 24.0% | 31.5% |
| 42 | Woodbury | 50.60 | 78,305 | 38.0 | 26.0% | 36.5% |
| 43 | Mounds View | 50.70 | 12,926 | 40.2 | 31.0% | 28.2% |
| 44 | New Ulm | 50.90 | 14,056 | 39.3 | 35.0% | 25.6% |
| 45 | Cambridge | 50.90 | 10,307 | 37.6 | 30.0% | 25.9% |
| 46 | Monticello | 51.10 | 14,858 | 34.1 | 31.0% | 38.3% |
| 47 | Shakopee | 51.40 | 46,012 | 36.6 | 26.0% | 41.4% |
| 48 | Minnetonka | 51.80 | 53,064 | 42.9 | 30.0% | 25.9% |
| 49 | Willmar | 51.80 | 21,378 | 35.5 | 26.0% | 29.4% |
| 50 | Vadnais Heights | 52.40 | 12,838 | 39.6 | 30.0% | 28.3% |
| 51 | Faribault | 53.70 | 24,631 | 38.7 | 22.0% | 28.0% |
| 52 | Savage | 53.80 | 32,889 | 37.5 | 30.0% | 36.6% |
| 53 | Waconia | 54.20 | 13,434 | 38.4 | 38.0% | 38.8% |
| 54 | Golden Valley | 55.20 | 21,725 | 44.2 | 30.0% | 25.6% |
| 55 | Brainerd | 55.30 | 14,468 | 35.1 | 31.0% | 26.5% |
| 56 | Prior Lake | 55.40 | 28,016 | 39.6 | 31.0% | 38.6% |
| 57 | Detroit Lakes | 55.40 | 10,025 | 41.6 | 29.0% | 24.3% |
| 58 | Owatonna | 55.50 | 26,498 | 40.4 | 37.0% | 29.4% |
| 59 | Eden Prairie | 55.60 | 63,051 | 41.3 | 25.0% | 32.5% |
| 60 | Edina | 55.60 | 53,262 | 44.9 | 27.0% | 26.9% |
| 61 | Shoreview | 55.80 | 26,714 | 43.6 | 30.0% | 28.5% |
| 62 | Plymouth | 56.60 | 79,220 | 40.3 | 27.0% | 33.0% |
| 63 | North Mankato | 57.40 | 14,211 | 38.5 | 34.0% | 32.8% |
| 64 | Sauk Rapids | 57.80 | 13,852 | 35.3 | 35.0% | 31.1% |
| 65 | Mendota Heights | 57.80 | 11,612 | 47.0 | 35.0% | 26.6% |
| 66 | Alexandria | 57.90 | 14,735 | 40.8 | 34.0% | 23.6% |
| 67 | Cottage Grove | 58.20 | 40,992 | 36.5 | 34.0% | 38.1% |
| 68 | Maple Grove | 58.70 | 71,173 | 40.9 | 30.0% | 33.3% |
| 69 | Red Wing | 59.20 | 16,758 | 42.0 | 28.0% | 25.3% |
| 70 | Fergus Falls | 59.20 | 14,181 | 43.3 | 26.0% | 19.9% |
| 71 | Buffalo | 59.80 | 16,499 | 38.6 | 35.0% | 33.7% |
| 72 | Marshall | 59.90 | 13,896 | 35.9 | 31.0% | 30.7% |
| 73 | Chaska | 60.20 | 28,706 | 37.5 | 30.0% | 37.8% |
| 74 | Chanhassen | 60.70 | 26,006 | 41.5 | 30.0% | 34.8% |
| 75 | Lakeville | 60.80 | 74,354 | 36.8 | 32.0% | 42.7% |
| 76 | Ramsey | 61.30 | 28,421 | 36.9 | 40.0% | 35.1% |
| 77 | Rosemount | 62.80 | 27,562 | 38.9 | 33.0% | 38.9% |
| 78 | Sartell | 63.00 | 19,758 | 34.8 | 38.0% | 34.2% |
| 79 | Otsego | 63.50 | 22,245 | 34.9 | 37.0% | 43.8% |
| 80 | Champlin | 63.60 | 23,294 | 41.6 | 34.0% | 32.4% |
| 81 | Farmington | 63.70 | 23,902 | 35.4 | 32.0% | 43.6% |
| 82 | Hastings | 64.10 | 22,117 | 41.0 | 36.0% | 27.9% |
| 83 | Forest Lake | 65.10 | 20,729 | 39.6 | 35.0% | 30.2% |
| 84 | Hibbing | 66.50 | 16,057 | 45.7 | 32.0% | 19.2% |
| 85 | Hutchinson | 67.20 | 14,680 | 41.9 | 36.0% | 26.2% |
| 86 | Inver Grove Heights | 67.50 | 35,906 | 41.6 | 32.0% | 29.3% |
| 87 | Rogers | 67.80 | 13,685 | 37.0 | 41.0% | 46.7% |
| 88 | Elk River | 69.80 | 26,793 | 37.2 | 36.0% | 37.4% |
| 89 | East Bethel | 69.90 | 12,115 | 40.9 | 45.0% | 29.4% |
| 90 | Andover | 70.60 | 33,035 | 39.6 | 42.0% | 40.0% |
| 91 | Fairmont | 70.80 | 10,296 | 46.6 | 34.0% | 22.7% |
| 92 | Cloquet | 71.50 | 12,537 | 37.4 | 31.0% | 31.2% |
| 93 | Lake Elmo | 75.60 | 13,140 | 40.8 | 42.0% | 40.0% |
| 94 | North Branch | 76.20 | 11,565 | 39.5 | 36.0% | 30.1% |
| 95 | Victoria | 77.10 | 11,295 | 41.2 | 37.0% | 42.1% |
| 96 | Grand Rapids | 78.20 | 11,207 | 44.3 | 37.0% | 25.2% |
| 97 | Hugo | 79.20 | 16,340 | 40.1 | 43.0% | 32.9% |
| 98 | Hermantown | 82.00 | 10,218 | 38.7 | 40.0% | 33.5% |
| 99 | St. Michael | 84.10 | 20,010 | 37.6 | 38.0% | 43.7% |
| 100 | Lino Lakes | 85.60 | 22,113 | 41.5 | 41.0% | 32.8% |
Source: U.S. Census ACS 2020-2024. 101 cities with more than 10,000 residents.
Summary
Summary: The Best Cities For Singles In Minnesota For 2026
If you’re looking for a breakdown of cities in Minnesota ranked by criteria that most agree make a place a great spot for finding a single person (and potentially love), this is an accurate list.
The best cities for singles in Minnesota are Minneapolis, Columbia Heights, St. Paul, Mankato, Richfield, St. Louis Park, Moorhead, Robbinsdale, Crystal, and North St. Paul.


