
Some of you might be asking yourself, at this very moment, is New York a good place?
The answer is unequivocally yes… if you know where to locate the best counties to live in New York.
Lucky for you, we’re here to help you identify the best counties to live in the Empire State based on the most recently available data from the Census. And this isn’t our first rodeo — we’ve been using Saturday Night Science to rank places for years.
The question becomes if you wanted to relocate to the best part of New York, where would you go? To answer that, we looked at crime, cost of living, and demographic data for all 62 counties in the state.
Table Of Contents: Top Ten | Methodology | Table | FAQs | Summary
The 10 Best Counties To Live In New York For 2025
- Saratoga County
- Putnam County
- Ontario County
- Warren County
- Nassau County
- Madison County
- Dutchess County
- Albany County
- Suffolk County
- Rensselaer County
Saratoga County is the county to be when it comes to living the good life in New York. And you should avoid Bronx County if you can — at least according to the data.
Now you know exactly where to move in New York. Keep on reading for more about the top ten and a detailed methodology.
Or, check out the best places to live in New York and the cheapest places to live in New York.
Table Of Contents: Top Ten | Methodology | Summary | Table
The Best Counties To Live In New York For 2025
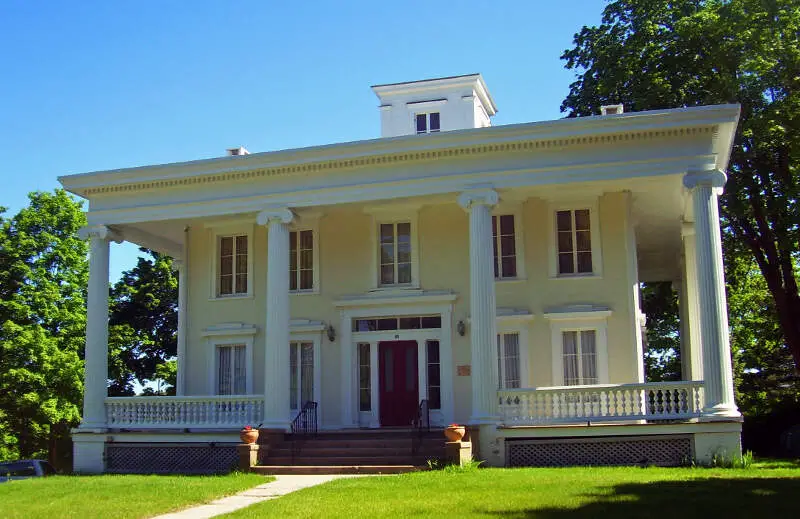
1. Saratoga County
Biggest Place: Saratoga Springs
Population: 237,075
Median Income: $99,653 (7th best)
Median Home Price: $324,800 (13th best)
Unemployment Rate: 3.1% (2nd best)
More on Saratoga County:
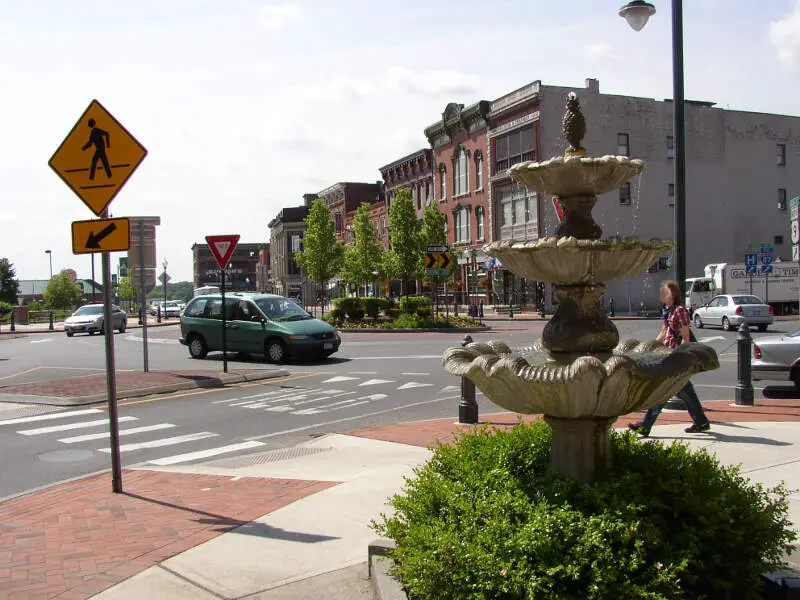
2. Putnam County
Biggest Place: Mahopac
Population: 97,988
Median Income: $127,405 (3rd best)
Median Home Price: $448,000 (10th best)
Unemployment Rate: 4.1% (12th best)
More on Putnam County:
3. Ontario County
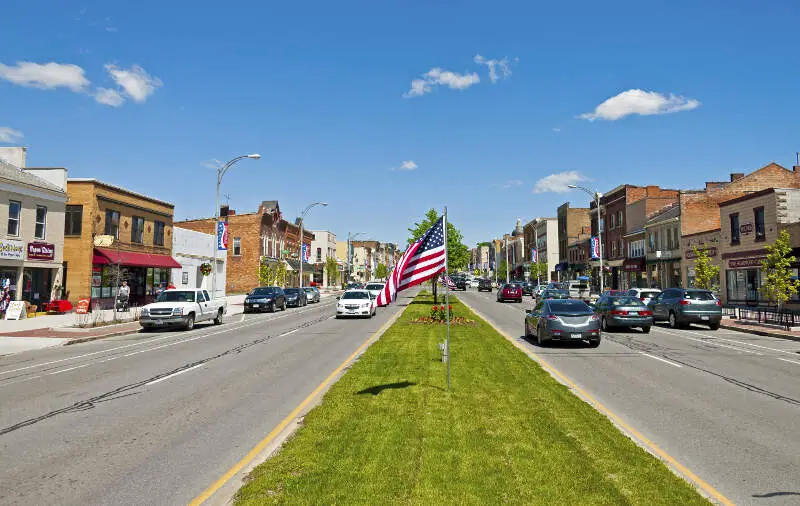
Biggest Place: Geneva
Population: 112,405
Median Income: $79,814 (16th best)
Median Home Price: $202,900 (25th best)
Unemployment Rate: 4.0% (10th best)
More on Ontario County:
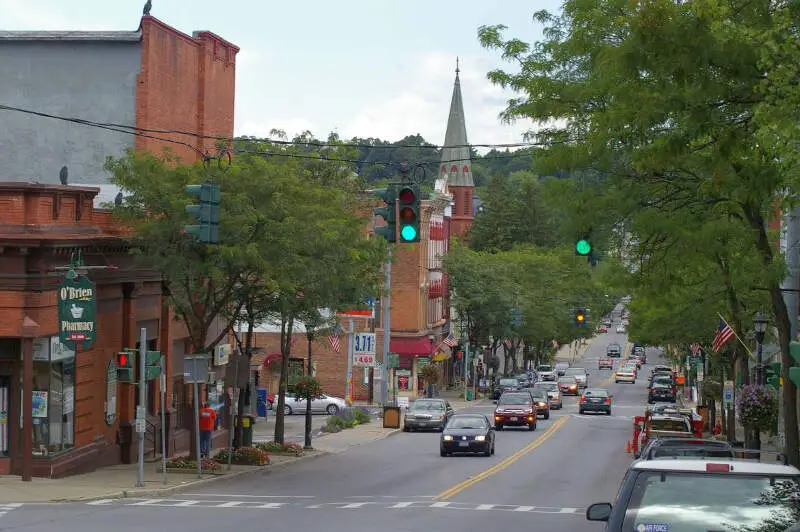
4. Warren County
Biggest Place: Glens Falls
Population: 65,560
Median Income: $78,239 (18th best)
Median Home Price: $247,600 (19th best)
Unemployment Rate: 3.8% (6th best)
More on Warren County:
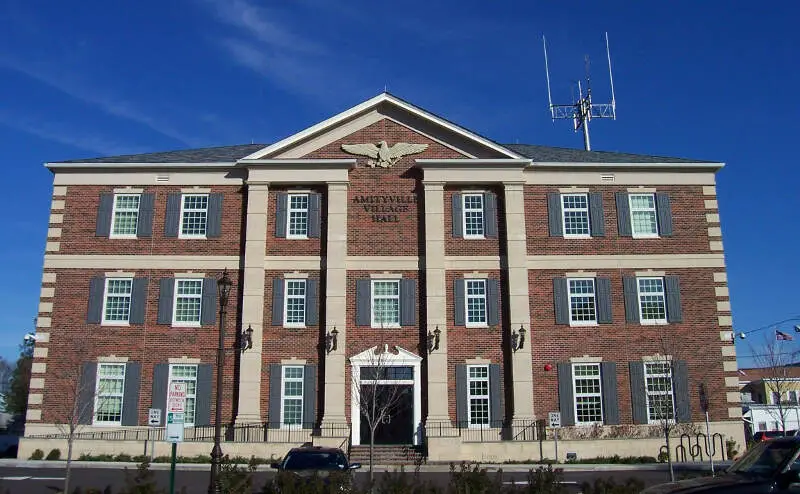
5. Nassau County
Biggest Place: Hempstead
Population: 1,388,138
Median Income: $143,408 (best)
Median Home Price: $658,700 (4th best)
Unemployment Rate: 4.8% (2best)
More on Nassau County:
6. Madison County

Biggest Place: Oneida
Population: 67,572
Median Income: $73,141 (24th best)
Median Home Price: $176,800 (34th best)
Unemployment Rate: 4.1% (11th best)
More on Madison County:
7. Dutchess County
![]()
Biggest Place: Poughkeepsie
Population: 297,144
Median Income: $97,273 (9th best)
Median Home Price: $368,100 (11th best)
Unemployment Rate: 4.8% (22nd best)
More on Dutchess County:
8. Albany County
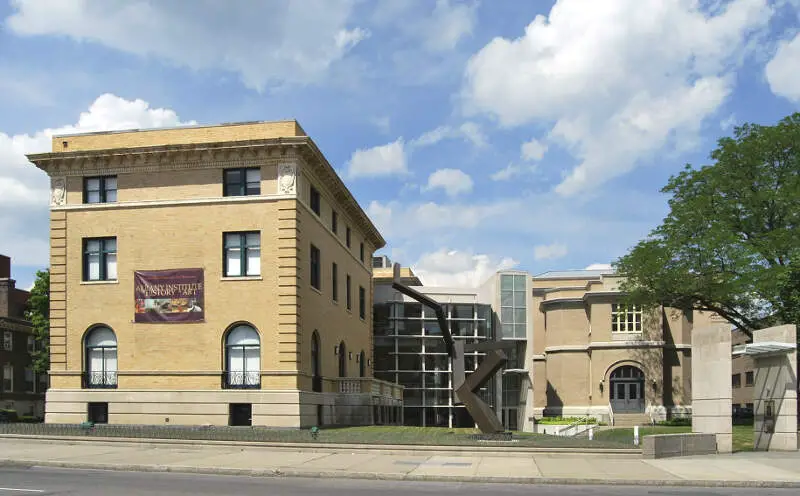
Biggest Place: Albany
Population: 315,374
Median Income: $83,149 (14th best)
Median Home Price: $277,400 (16th best)
Unemployment Rate: 5.2% (29th best)
More on Albany County:
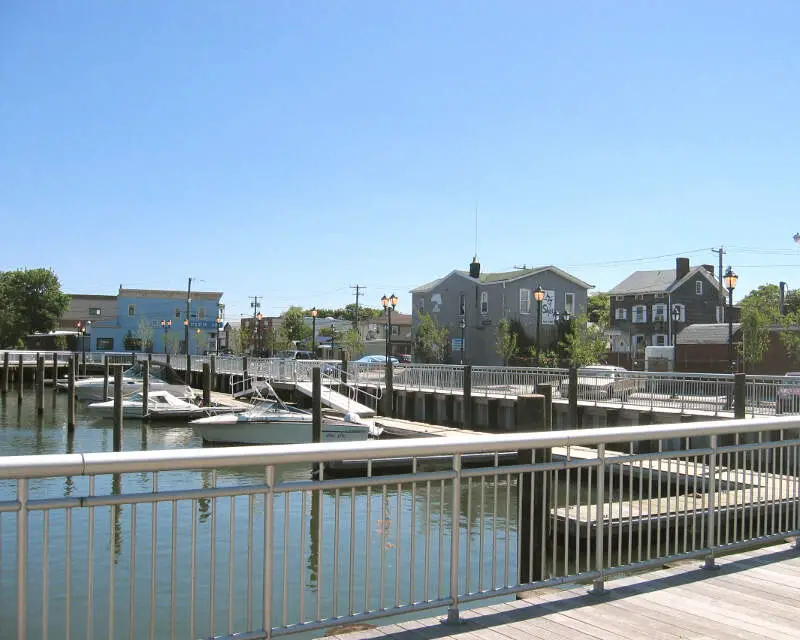
9. Suffolk County
Biggest Place: Brentwood
Population: 1,525,680
Median Income: $128,329 (2nd best)
Median Home Price: $539,500 (8th best)
Unemployment Rate: 4.6% (16th best)
More on Suffolk County:
10. Rensselaer County
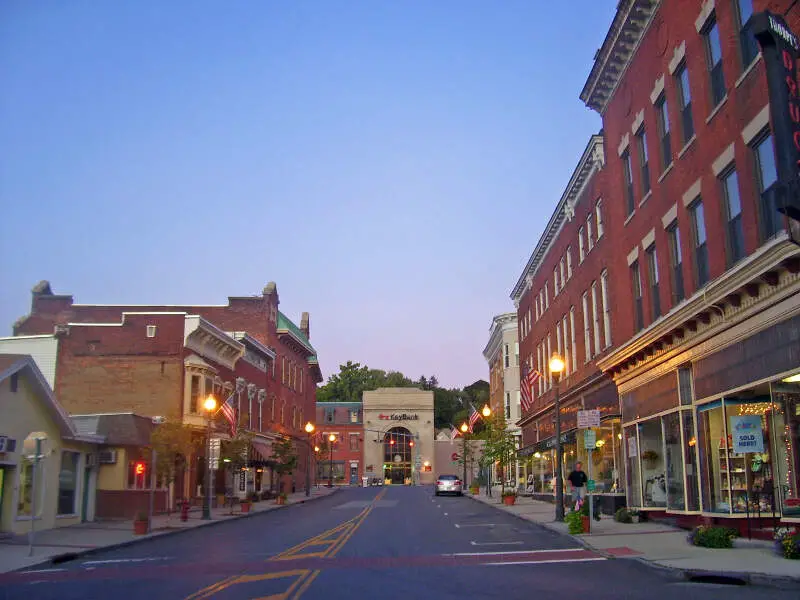
Biggest Place: Troy
Population: 160,341
Median Income: $86,663 (11th best)
Median Home Price: $244,300 (20th best)
Unemployment Rate: 5.6% (4best)
More on Rensselaer County:
Methodology: How do you determine which New York county is the best?
To give you the best county in New York, we have to look at a handful of metrics that signal the quality of a place. To do that, we made assumptions about what’s in a “best county” and what isn’t. For reference, we are trying to make the kind of argument you’d make at a bar using facts, Saturday Night Science.
With that in mind, we went to two of the best data sources on the internet. Namely, the American Community Survey data and FBI Crime data for the most recent period.
We paid particular attention to:
- Violent Crime Rates
- Property Crime Rates
- Median Home Values
- Median Income
- Unemployment Rates
- Adult Education Levels
- Health Insurance Coverage
- Poverty Rates
We then ranked each county in New York across each of the criteria from one to 62, with one being the best.
Taking the average rank across all criteria, we created a quality of life score with the county posting the lowest overall score being the “Best County To Live In New York.”
The result is some of the safest, quietest, and best counties to raise a family in the Empire State.
We updated this article for 2025. This report is our tenth time ranking the best counties to live in New York.
Read on to see why Saratoga County is the best county, while Bronx County is probably in contention for being the worst county in New York.
Summary: The Best Counties In New York To Call Home For 2025
Living in New York can vary from one part of the state to the next — who woulda thought?
The best counties in New York are Saratoga County, Putnam County, Ontario County, Warren County, Nassau County, Madison County, Dutchess County, Albany County, Suffolk County, and Rensselaer County.
But now you know the outstanding parts and the parts to avoid, and that’s why you came here to learn at the end of the day.
You are welcome.
Here’s a look at the worst counties in New York according to the data:
- Bronx County
- St. Lawrence County
- Allegany County
For more New York reading, check out:
- Safest Places In New York According To Science
- Best Places To Buy A House In New York
- Best Counties To Live In New York
- Best Places To Raise A Family In New York
Detailed List Of The Best Counties In New York
| Rank | County | Population | Median Income | Median Home Price |
|---|---|---|---|---|
| 1 | Saratoga County | 237,075 | $99,653 | $324,800 |
| 2 | Putnam County | 97,988 | $127,405 | $448,000 |
| 3 | Ontario County | 112,405 | $79,814 | $202,900 |
| 4 | Warren County | 65,560 | $78,239 | $247,600 |
| 5 | Nassau County | 1,388,138 | $143,408 | $658,700 |
| 6 | Madison County | 67,572 | $73,141 | $176,800 |
| 7 | Dutchess County | 297,144 | $97,273 | $368,100 |
| 8 | Albany County | 315,374 | $83,149 | $277,400 |
| 9 | Suffolk County | 1,525,680 | $128,329 | $539,500 |
| 10 | Rensselaer County | 160,341 | $86,663 | $244,300 |
| 11 | Columbia County | 61,245 | $83,619 | $309,800 |
| 12 | Greene County | 47,554 | $74,011 | $248,300 |
| 13 | Genesee County | 57,943 | $72,055 | $157,800 |
| 14 | Onondaga County | 471,611 | $74,740 | $185,300 |
| 15 | Erie County | 950,044 | $71,175 | $217,400 |
| 16 | Monroe County | 754,068 | $74,409 | $197,100 |
| 17 | Schenectady County | 159,603 | $76,989 | $223,100 |
| 18 | Tioga County | 48,106 | $71,791 | $153,200 |
| 19 | Livingston County | 61,588 | $72,464 | $169,600 |
| 20 | Richmond County | 492,734 | $98,290 | $658,500 |
| 21 | Tompkins County | 102,879 | $73,012 | $271,500 |
| 22 | Wayne County | 91,128 | $73,914 | $163,400 |
| 23 | Ulster County | 182,109 | $81,804 | $315,100 |
| 24 | Westchester County | 996,888 | $118,411 | $638,400 |
| 25 | Hamilton County | 5,102 | $68,950 | $242,000 |
| 26 | Essex County | 37,077 | $70,215 | $200,000 |
| 27 | Schoharie County | 29,979 | $71,188 | $182,000 |
| 28 | Orange County | 403,840 | $96,497 | $361,100 |
| 29 | Clinton County | 78,961 | $69,208 | $175,100 |
| 30 | Washington County | 60,883 | $72,342 | $185,000 |
| 31 | Niagara County | 211,341 | $67,809 | $177,400 |
| 32 | Wyoming County | 39,980 | $68,913 | $154,700 |
| 33 | Rockland County | 338,936 | $110,631 | $564,200 |
| 34 | New York County | 1,627,788 | $104,553 | $1,108,900 |
| 35 | Cortland County | 46,401 | $67,527 | $158,100 |
| 36 | Herkimer County | 59,932 | $68,858 | $135,000 |
| 37 | Oneida County | 229,645 | $68,819 | $171,100 |
| 38 | Cayuga County | 75,464 | $66,583 | $164,200 |
| 39 | Lewis County | 26,618 | $68,329 | $158,000 |
| 40 | Otsego County | 59,738 | $67,086 | $175,900 |
| 41 | Queens County | 2,330,124 | $84,961 | $699,200 |
| 42 | Fulton County | 52,787 | $62,615 | $156,100 |
| 43 | Yates County | 24,637 | $67,521 | $178,000 |
| 44 | Schuyler County | 17,749 | $65,625 | $163,300 |
| 45 | Steuben County | 93,034 | $64,740 | $128,600 |
| 46 | Jefferson County | 116,130 | $64,978 | $181,000 |
| 47 | Chenango County | 46,685 | $62,093 | $128,100 |
| 48 | Kings County | 2,646,306 | $78,548 | $889,700 |
| 49 | Delaware County | 44,551 | $60,226 | $176,200 |
| 50 | Sullivan County | 79,147 | $69,826 | $234,800 |
| 51 | Seneca County | 33,125 | $66,007 | $142,700 |
| 52 | Oswego County | 117,945 | $68,461 | $139,600 |
| 53 | Broome County | 197,738 | $61,059 | $145,100 |
| 54 | Chemung County | 82,805 | $63,469 | $132,100 |
| 55 | Montgomery County | 49,461 | $62,923 | $141,600 |
| 56 | Orleans County | 39,686 | $63,838 | $126,200 |
| 57 | Franklin County | 47,066 | $63,747 | $128,600 |
| 58 | Chautauqua County | 126,329 | $56,507 | $119,300 |
| 59 | Cattaraugus County | 76,479 | $58,248 | $109,400 |
| 60 | Allegany County | 47,027 | $61,233 | $97,900 |
| 61 | St. Lawrence County | 107,796 | $61,900 | $119,800 |
| 62 | Bronx County | 1,419,250 | $49,036 | $517,000 |